Gold Forecast This Week — Outlook, Drivers & Key Levels
This week's Gold outlook: key drivers, volatility context, risk-opportunity assessment and the week ahead.

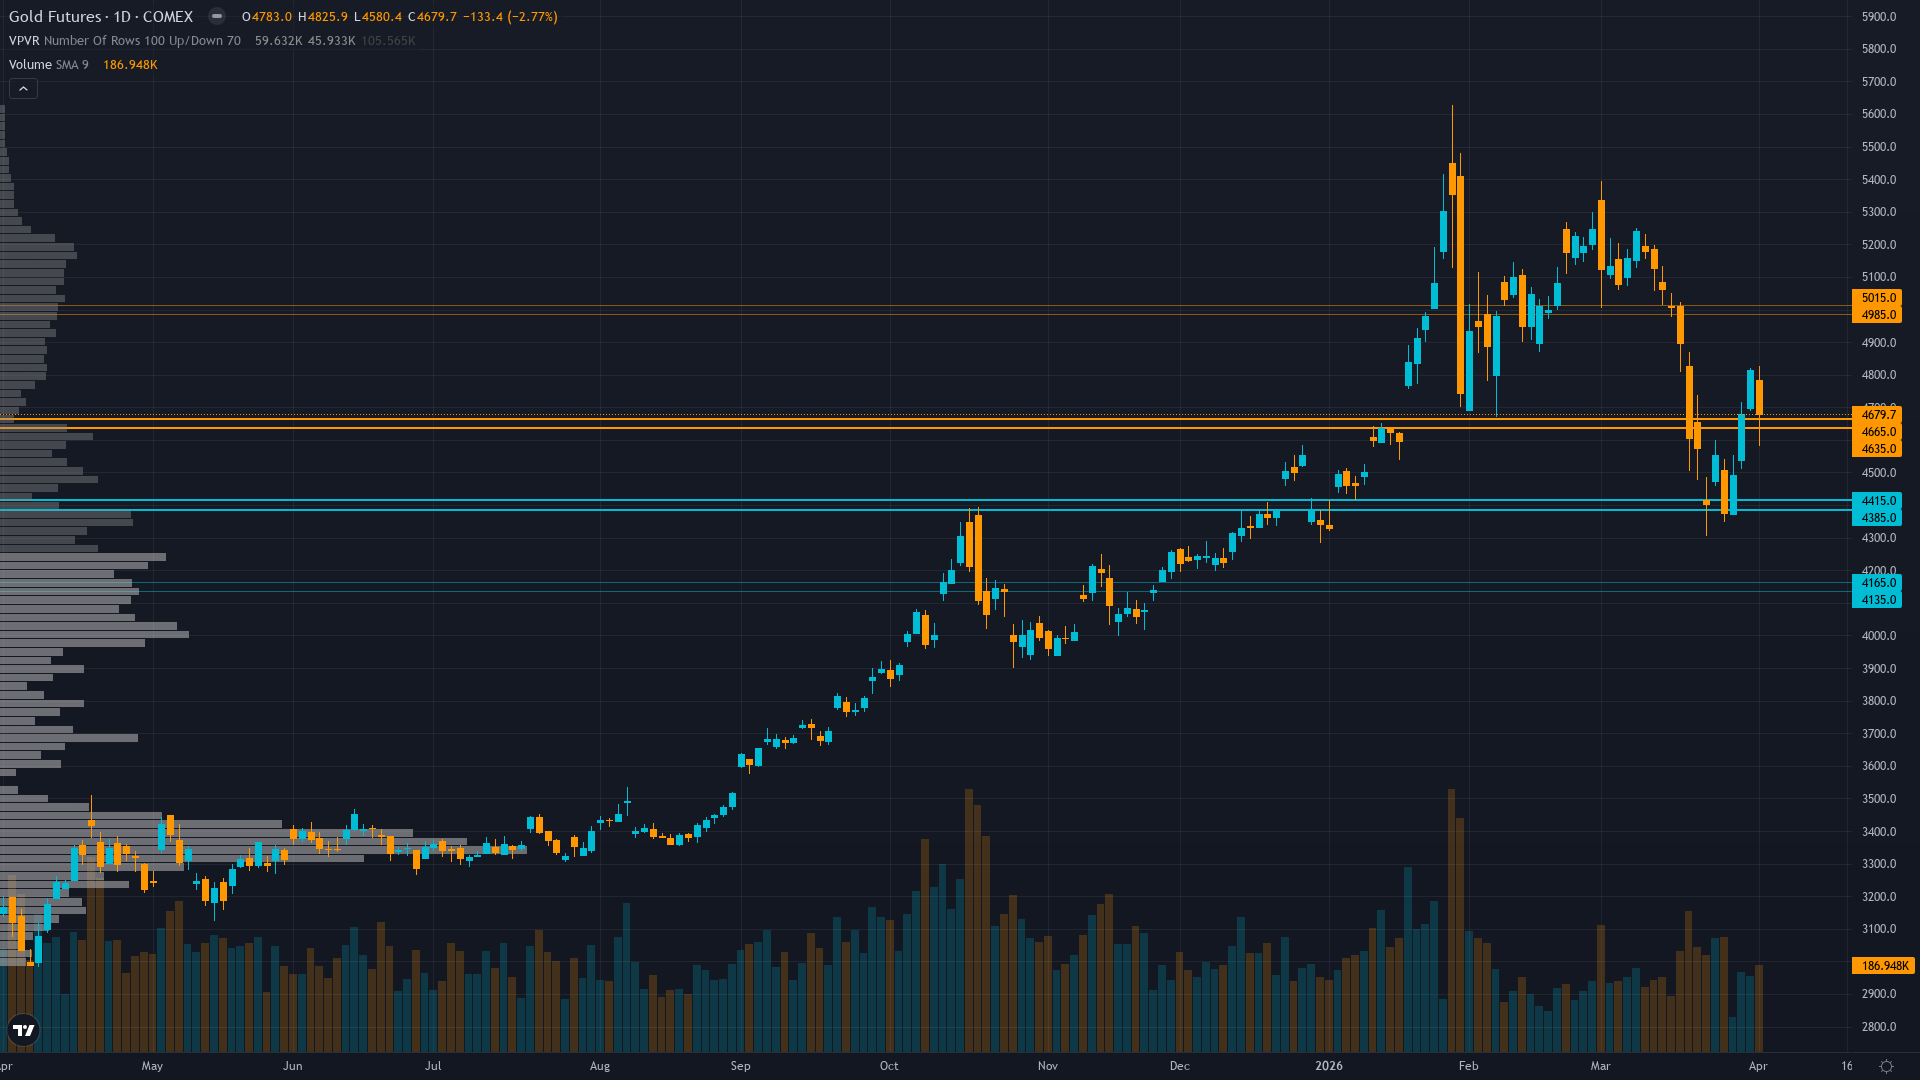
Market Overview
gold pushed to 4676.64 on a 4.68% advance, reflecting sustained demand across the session. gold futures is range-bound and tightening, with decreasing volatility signalling a directional resolution ahead.
Mixed with institutional price targets remaining at $5,000-5,400 (JP Morgan, Goldman Sachs) but near-term uncertainty elevated following worst quarterly decline since 1983 and central bank demand deceleration
This Week's Catalysts & Drivers
Primary driver: Gold consolidating at $4,677 following historic 23% correction from January $5,626 peak, attempting stabilization above 50-day MA ~$4,700 as technical bounce from March $4,150 low meets continued structural headwinds from central bank demand collapse and elevated real yields
Secondary factor: Central bank demand structurally deteriorating with Jan-Feb 2026 purchases at only 24 tonnes versus 26-27t monthly 2025 average, removing the permanent bid floor that drove 2025's 67% rally while creating fundamental regime shift
Additional influence: Dollar strength persists at DXY 100.2 (10-month high) despite VIX 26.78 fear environment, creating unusual regime where safe-haven gold faces dual headwinds from strong USD and Fed's March 18 hawkish hold reducing 2026 rate cut expectations
Economic backdrop: Fed held March 18 at 3.75-4.00% with hawkish dot plot revision to one 2026 cut, DXY at 100.2 creating headwind, VIX 26.78 above 25 threshold signals risk-off but gold paradoxically pressured by monetary policy recalibration
Fundamental assessment: Valuation fair at $4,677 versus institutional targets $5,000-5,400 but structural demand pillar weakening with central bank buying down 81% in January (5t vs 27t average) though real yields at 1.96% remain moderately supportive
Technical Picture
Daily downtrend from $5,000+ highs showing potential stabilization with price at $4,677 testing 50-day MA ~$4,700 after bouncing 8% from March 24 low of $4,150, but structure remains damaged with lower highs pattern intact
At 5/10, trend strength is middling — enough to suggest a lean, but not enough to trade with high confidence.
Bull & Bear Case
Primary risk: Dollar strength above DXY 100.2 combined with March CPI printing hot validates Fed higher-for-longer stance driving gold toward $4,300 200-day MA zone representing additional 6-7% downside from current levels (Probability: medium)
Primary opportunity: Mean reversion rally from oversold conditions and extreme sentiment capitulation (23% correction flushed weak hands) drives recovery toward $4,900-5,000 resistance zone as positioning has normalized and contrarian setup materializes (Timeframe: Next 2-4 weeks through April 10 CPI release as market digests whether March correction represents washout low or continuation of breakdown)
This week's edge: Market may be underestimating severity of central bank demand deterioration (Jan-Feb 24t vs 54t same period 2025) representing structural regime change, while sentiment-driven contrarian narrative may overweight single 8% bounce within broader 23% downtrend; desk recognizes positioning has normalized but timing of bullish call requires fresh catalyst confirmation
Volatility Regime
Volatility for gold price sits at the 88th percentile over 90 days — an elevated regime that demands wider risk parameters and faster decision-making. The vol trend is down, with contraction across timeframes creating the kind of coiled conditions that historically resolve explosively.
Elevated volatility at 88th percentile requires wider stops with daily ranges potentially 3-6% versus normal 1.5-2%; current bounce from $4,150 low suggests volatility may be peaking but until vol normalizes below 70th percentile breakouts remain unreliable
What to Watch
The March 2026 CPI release critical for validating Fed's inflation concerns that drove hawkish shift, with hot print potentially extending correction while softer data could trigger relief rally on Friday 10 April stands as the week's primary risk event — high-impact and capable of overriding the existing technical and sentiment setup.
The interplay between consolidating market conditions and upcoming catalysts will define this week's trading landscape for COMEX gold.
This analysis covers one dimension. Our full weekly report combines six specialist agents into a single actionable briefing with directional bias, key levels, and risk-opportunity matrix.
Start Free — Get the Market of the WeekFree weekly report · No credit card · Upgrade anytime