Gold Forecast This Week — Outlook, Drivers & Key Levels
This week's Gold outlook: key drivers, volatility context, risk-opportunity assessment and the week ahead.

Current Market Picture
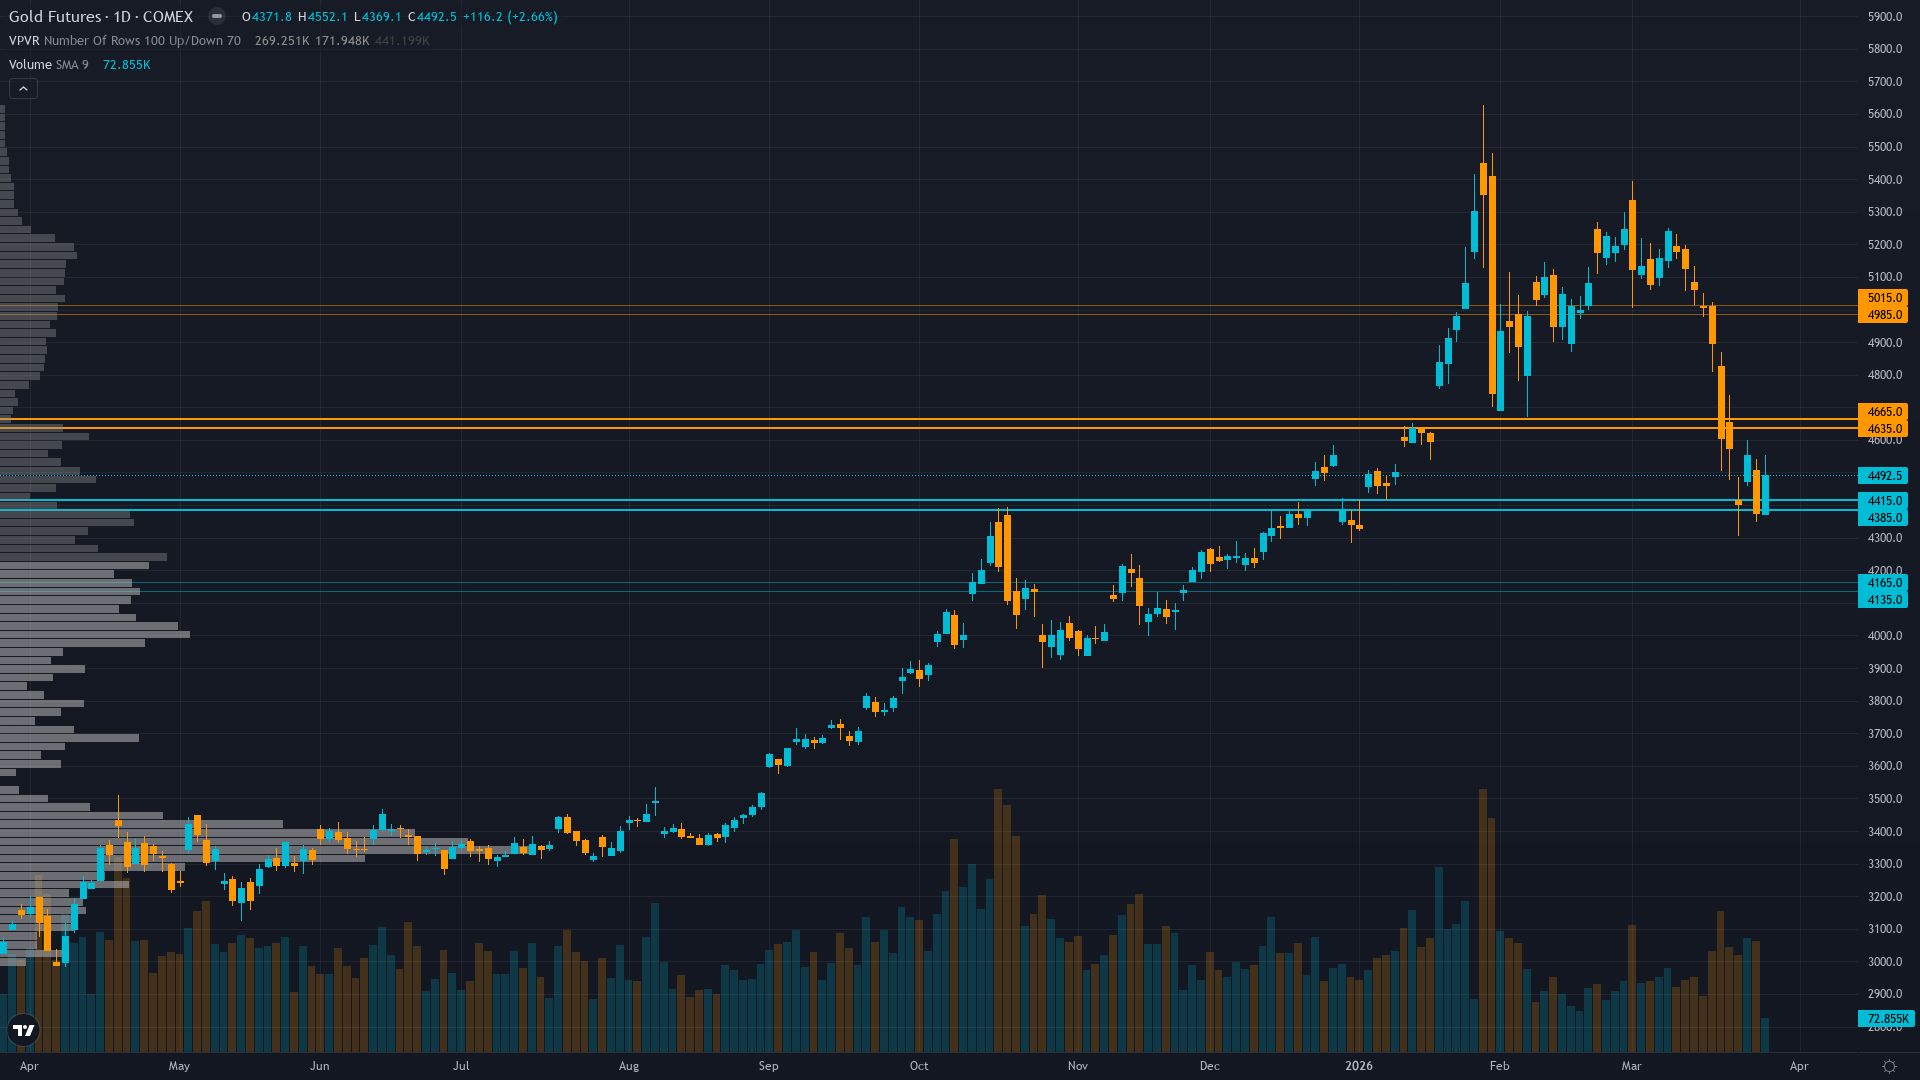
gold pushed to 4492.5 on a 2.66% advance, reflecting sustained demand across the session. The market in gold futures is coiling, with narrowing price ranges suggesting stored energy that will eventually release.
Mixed to bearish short-term with institutional price targets being revised lower following worst weekly decline since 1983 though longer-term forecasts remain constructive at $5000-5400 by mid-2026 assuming Fed eventually resumes easing cycle
Key Drivers This Week
Primary driver: Gold consolidating at $4492 following historic 22% correction from $5603 January peak after March 18-19 FOMC hawkish surprise reduced 2026 rate cut expectations to one from two, creating higher-for-longer real yield environment hostile to non-yielding assets
Secondary factor: Sentiment showing contrarian bullish setup after extreme capitulation event with managed money net long reduced 21.9% in single week to 37,537 contracts while open interest declined 4.3% confirming active liquidation from previously crowded positioning
Additional influence: Technical structure severely damaged with price 20% below January high and trading below broken 50-day MA at $4814, though bounce from March 24 low at $4150 suggests potential stabilization attempt at critical $4300-4500 support zone
Economic backdrop: Fed held March 18-19 at 3.5-3.75% with hawkish dot plot revision to just one 2026 cut from two while Powell emphasized conditional guidance 'If we don't see that progress, then you won't see the rate cut' creating higher-for-longer trajectory as DXY strengthened to 99.86
Fundamental assessment: Moderately undervalued at $4492 versus institutional targets of $5000-5400 but central bank demand collapse to 5 tonnes in January from 27t monthly average removes critical structural bid floor while hawkish Fed hold creates higher real yields hostile to gold
Price Structure
Daily downtrend intact with price at $4492 below 50-day MA at $4814 and 100-day MA near $4477 after breaking $5000 paradigm support mid-March, though 8% bounce from March 24 $4150 low shows potential stabilization attempt within broader bearish structure
Trend strength at 4/10 paints a picture of a market with some direction but lacking strong conviction.
Upside & Downside
Primary risk: Further dollar strength above DXY 100 combined with March CPI printing hot validates Fed higher-for-longer stance driving gold toward $4150 March low or potentially $4000 psychological support representing additional 7-11% downside from current levels (Probability: medium)
Primary opportunity: Mean reversion rally from oversold conditions and extreme sentiment capitulation drives recovery toward $4800-5000 resistance zone as positioning has been flushed and contrarian setup materializes if Fed maintains any dovish optionality or geopolitical tensions resurface (Timeframe: Next 2-4 weeks through April 10 CPI release and into late April as market digests whether March correction represents washout low or continuation of breakdown)
This week's edge: Market may be underestimating severity of central bank demand deterioration (January 5t versus 27t average represents structural regime change not temporary pause) while sentiment-driven contrarian narrative overweights single-week capitulation versus ongoing fundamental headwinds from higher real yields; desk recognizes breakdown is real and timing of bullish counter-trend call after 20% decline into resistance creates unfavorable risk-reward
Volatility Context
At the 88th percentile of its 90-day range, gold price volatility is running hot, creating both opportunity and risk for directional traders. Realised vol is declining steadily, compressing into ranges that tend to snap when a catalyst breaks the equilibrium.
Elevated volatility at 88th percentile requires wider stops with daily ranges potentially 3-6% versus normal 1.5-2%; current bounce from $4150 low suggests GVZ spike may be peaking but until vol normalizes below 70th percentile breakouts remain unreliable and false signals elevated
Week Ahead Outlook
The next major catalyst is March 2026 CPI release critical for validating or refuting inflation persistence concerns that drove Fed hawkish shift, with hot print potentially extending correction while softer data could trigger relief rally on Friday 10 April — a high-impact event that could materially shift the directional picture.
For GC futures, the balance between existing momentum and scheduled risk events sets the stage for the week ahead.
This analysis covers one dimension. Our full weekly report combines six specialist agents into a single actionable briefing with directional bias, key levels, and risk-opportunity matrix.
Start Free — Get the Market of the WeekFree weekly report · No credit card · Upgrade anytime


