Gold COT & Institutional Positioning — Smart Money Analysis
Gold institutional positioning: COT data, sentiment analysis and smart money flow assessment.

Smart Money Positioning
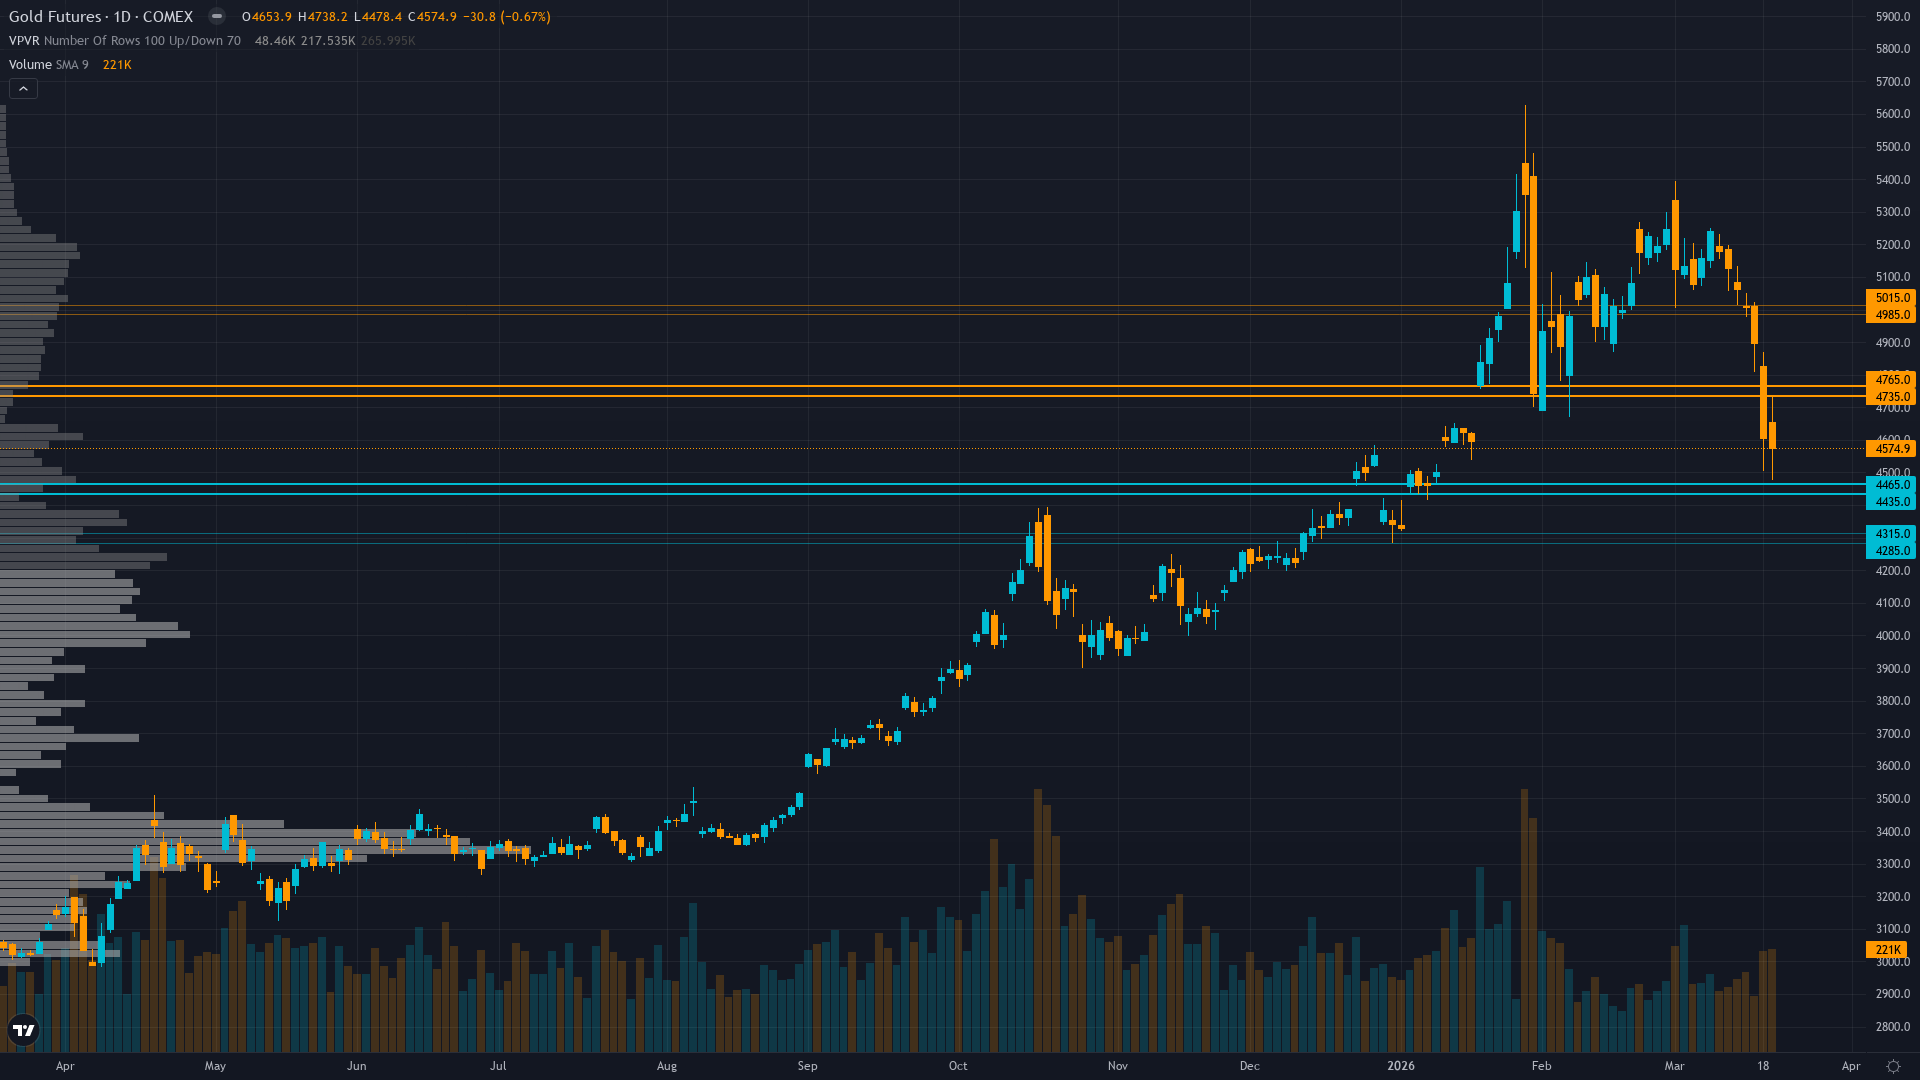
Trading at 4574.9 with a 0.67% dip, gold is giving back ground gradually.
Managed money net long ~93k contracts being liquidated in forced selling cascade while central bank demand collapse to 5t in January versus 27t monthly average removes structural bid floor creating institutional exodus
Consensus Check
Market consensus: Mixed to bearish with institutional targets being rapidly revised lower following worst weekly decline since 1983 and FOMC hawkish surprise creating near-term directional uncertainty
Primary driver: Historic selloff accelerating with gold suffering worst weekly decline since 1983 following March 18-19 FOMC hawkish hold reducing 2026 rate cut expectations from two cuts to just one while Middle East war drives oil-induced inflation fears
Divergence Assessment
Desk calls BEARISH after historic 20% decline while retail positioning shows 83% long bias creating moderate divergence but timing after major move limits contrarian value
Market Sentiment
The sentiment picture for gold futures is evenly split, providing no contrarian signal in either direction. The next move will likely be event-driven.
What Options Markets Show
GVZ volatility at 31.23 elevated but declining from January 48.68 spike indicating fear premium compression while options market shows no clear directional bias reflecting uncertainty in post-breakdown environment
Positioning Summary
Putting the positioning picture together for COMEX gold: sentiment is extreme fear, trend strength registers just 3/10, which typically corresponds to choppy, directionless price action. The net assessment from institutional data, crowd positioning, and derivatives activity points to a market where the balance of forces tilts in a discernible direction.
This analysis covers one dimension. Our full weekly report combines six specialist agents into a single actionable briefing with directional bias, key levels, and risk-opportunity matrix.
Start Free — Get the Market of the WeekFree weekly report · No credit card · Upgrade anytime


