Copper Forecast This Week — Outlook, Drivers & Key Levels
This week's Copper outlook: key drivers, volatility context, risk-opportunity assessment and the week ahead.

This Week's Starting Point
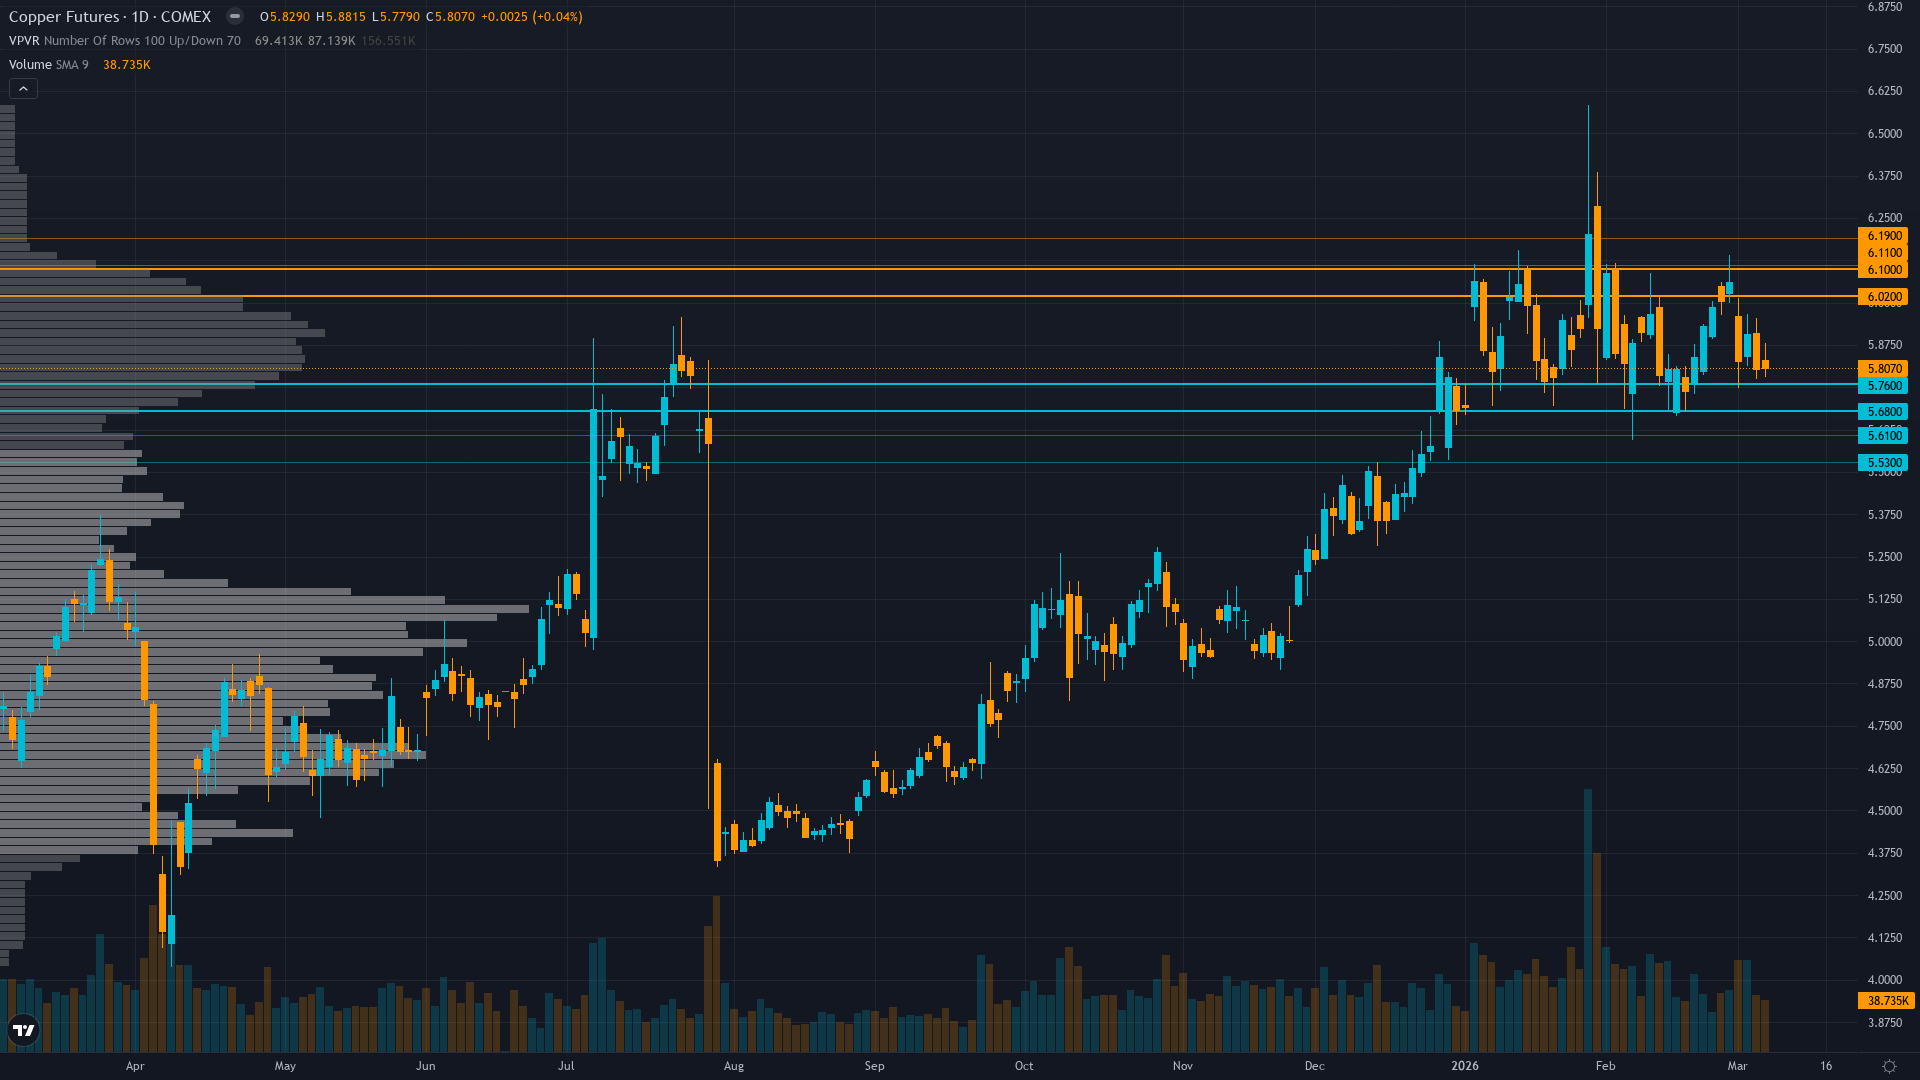
copper sits at 5.81 after a 0.04% gain — a quiet move higher without aggressive momentum. Price action in copper futures has compressed into a consolidation pattern, typically a precursor to a directional breakout.
Copper rallied to record highs on supply concerns with elevated prices expected into 2026 but near-term consolidation likely as market digests extraordinary gains, rising LME inventories, China Q4 demand declining 8% YoY, and tariff policy uncertainty
Forces in Play
Primary driver: Consecutive MISSED call on March 3 triggering mandatory conviction reduction after 9-week bullish streak—supply fundamentals unchanged but price action failing to confirm thesis
Secondary factor: Tariff uncertainty creating volatility with Trump copper policy shifting from proposed 50% on semi-finished products to potential exclusion of refined copper generating confusion
Additional influence: LME inventories at 249,650 tons (up from 189,100 in Feb) signaling reduced physical tightness while China demand remains mixed with Q4 -8% YoY consumption
Economic backdrop: Dollar at DXY 97-99 range down 9-10% YoY removing commodity headwind, but tariff policy uncertainty from Trump administration creating execution risk
Fundamental assessment: Grasberg mine offline through Q2 2026 removing 525-600k tons—structural deficit intact but demand side deteriorating with China Q4 -8% consumption and rising LME stocks
Technical Landscape
Nine-week consolidation range $5.72-$6.15 after January 14 record high at $6.15/lb, holding above 200-day MA but lacking directional conviction
Trend strength registers at 6/10, suggesting meaningful but not extreme directional bias.
Risk-Reward Assessment
Primary risk: China February industrial data confirming Q4 demand destruction narrative triggering sell-off from elevated levels while tariff uncertainty prevents fresh positioning (Probability: medium)
Primary opportunity: March seasonal strength (80% historical success rate) plus Grasberg supply shock reasserting dominance if China data validates resilient manufacturing demand floor (Timeframe: 2-4 weeks as March-April seasonality materializes and Q1 restocking emerges)
This week's edge: Market may be overweighting nine-week consolidation and China Q4 demand decline while underweighting March-April 80% seasonal success rate and Grasberg remaining offline through Q2 2026—however, after nine consecutive BULLISH calls with last week MISSED, thesis health is degraded and risk-reward no longer asymmetric at current levels
Risk Environment
With vol at the 65th percentile over 90 days, copper price is in a measured regime that doesn't require unusual adjustments. Volatility is stable, with realised vol holding steady across timeframes. This equilibrium can persist but eventually resolves into expansion or contraction.
Current volatility suggests daily ranges of 2-3% versus normal 1.5-2%, but nine-week consolidation with tightening ranges indicates market awaiting catalyst rather than building directional momentum—breakout or breakdown likely within 2 weeks of March 17 China data
Seasonal Context
Historically, March 2026 has favoured the upside for COMEX copper (62% win rate). Spring construction and manufacturing ramp-up.
Week Ahead Outlook
The next major catalyst is China February industrial production and copper consumption data release on Tuesday 17 March — a high-impact event that could materially shift the directional picture.
For copper, the balance between existing momentum and scheduled risk events sets the stage for the week ahead.
This analysis covers one dimension. Our full weekly report combines six specialist agents into a single actionable briefing with directional bias, key levels, and risk-opportunity matrix.
Start Free — Get the Market of the WeekFree weekly report · No credit card · Upgrade anytime


