30-Year Treasury Key Levels This Week — Support, Resistance & Confluence Zones
30-Year Treasury key levels breakdown: support zones, resistance zones, confluence and price structure.

Current Price Structure
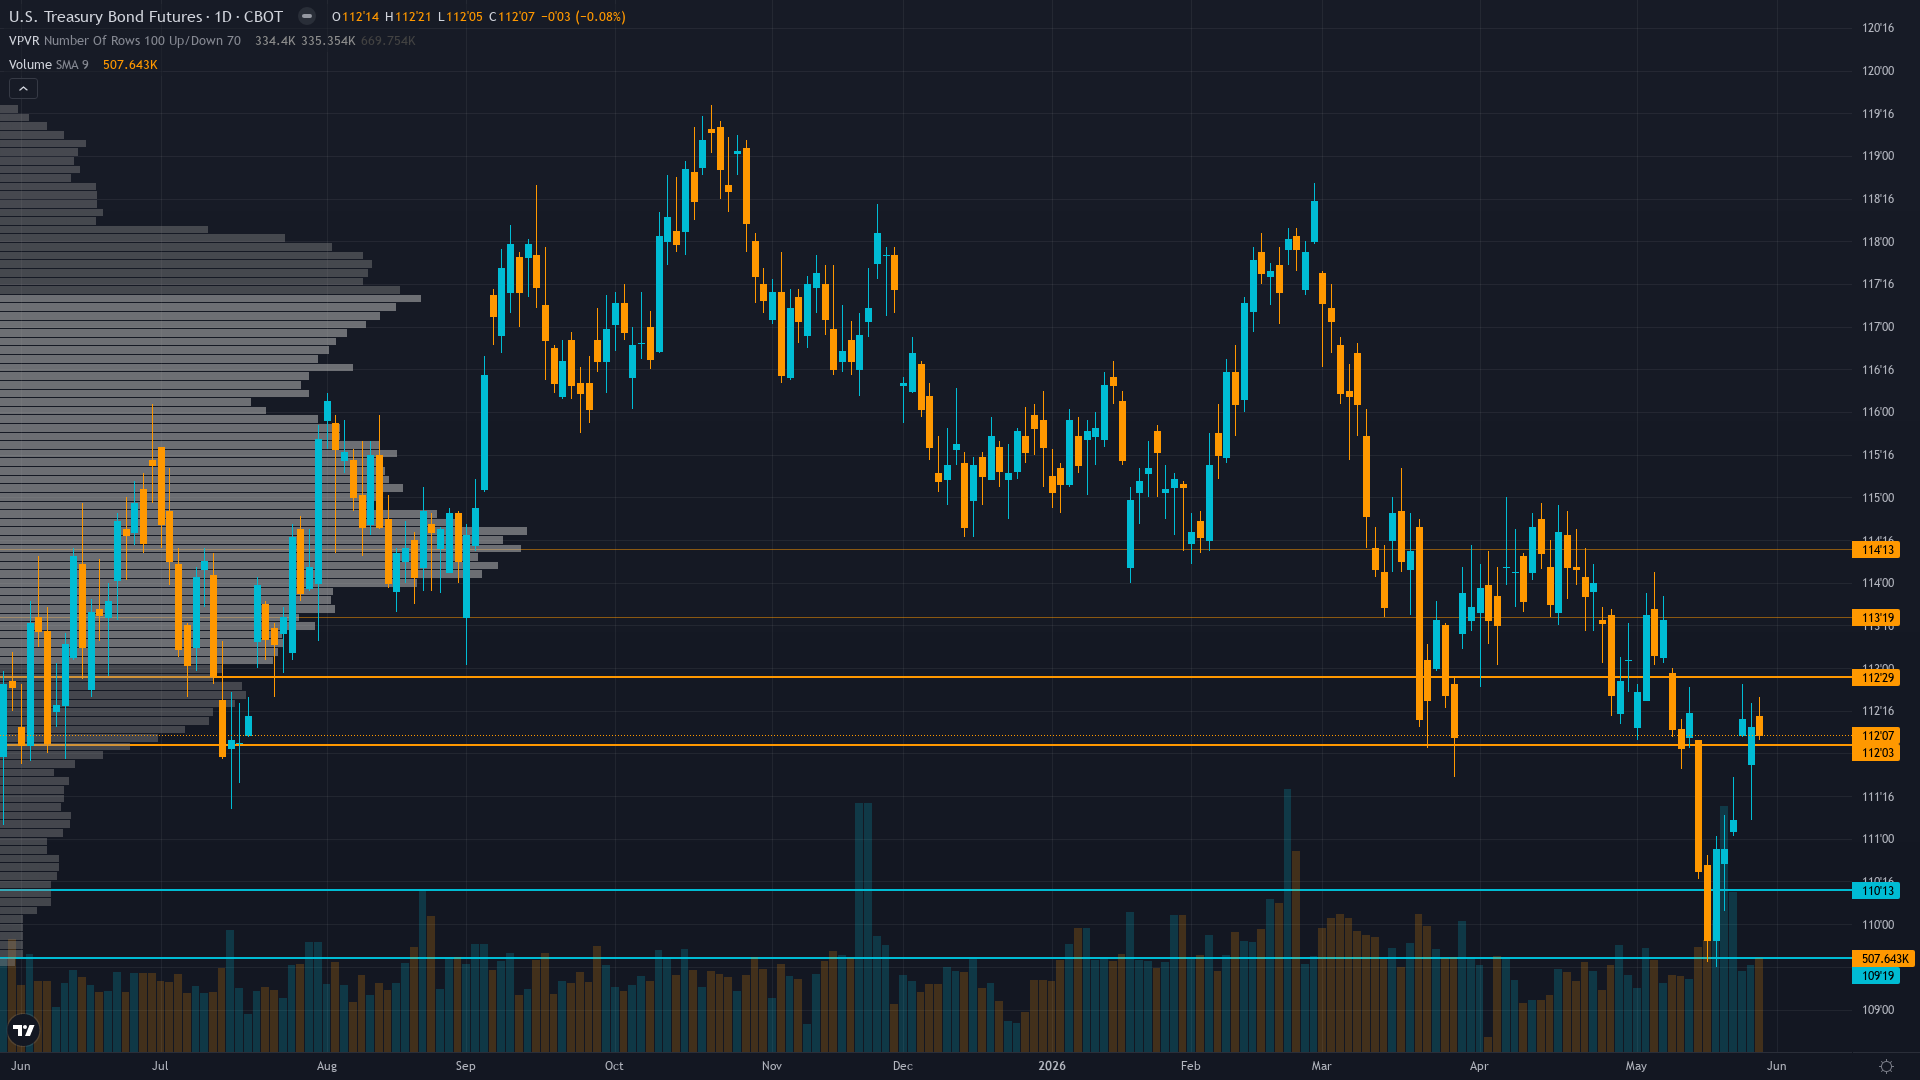
30-year Treasury pushed to 110.875 on a 1.02% advance, reflecting sustained demand across the session. Treasury bond futures is in a consolidating after recovery rally market state, requiring careful assessment of current conditions.
Downtrend since April 7 peak at 114.75 with lower highs and lower lows; current 110.875 sits below 50-day MA ~113.00 and 200-day MA ~115.50; recent bounce from 112.34 low to 110'28 shows short-term counter-trend strength without breaking bearish structure; declining open interest at 1.73M suggests participant deleveraging
With trend strength at only 3/10, any directional bias is thin and easily disrupted.
Support Zone Context
Below the current level, ZB futures has structural support where demand has historically stepped in. The reliability of these zones depends on the volume profile and the number of prior interactions.
In the current TRANSITIONAL - VIX at 16.33 below 20 signals contained equity volatility creating risk-on undertone yet bonds consolidating after Iran-driven rally showing neither clear risk-on nor risk-off dominance; regime reflects low-information vacuum between catalysts with Fed on hold and no major data until June 10 CPI creating maximum tactical uncertainty environment, support zones carry standard probability of reaction.
Ceilings & Supply Zones
Above current price, Treasury bond futures faces resistance zones where selling pressure has historically intensified. These levels represent previous supply zones, profit-taking areas, or structural barriers that price needs to overcome for continuation.
How firmly these zones hold depends on the confluence of volume, prior reactions, and the current market regime.
Where Disciplines Converge
For ZB futures, the levels that matter most are those confirmed by independent analytical approaches. When six different disciplines identify the same zone, the signal-to-noise ratio improves dramatically.
Volatility compression creating moderating environment; daily ranges compressing from 1.0-1.5 handles during May breakdown toward current 0.5-0.75 handles as MOVE holds 70.22 plateau; current 110.875 price in middle of 110-112.5 consolidation with June 5 employment and June 10 CPI creating binary catalysts for breakout
How Macro Agent Desk Identifies Key Levels
Macro Agent Desk identifies key levels through a six-agent process. Each analytical discipline contributes independently — technical for structure, institutional for smart money interest, options for hedging activity, fundamentals for fair value context, sentiment for crowd positioning, and economics for catalyst timing.
What this means in practice: every key level in the full weekly report has been stress-tested across multiple independent analytical frameworks before it reaches the page.
Our paid reports include specific support and resistance levels identified by six specialist agents — technical structure, institutional positioning, options flow, fundamentals, sentiment, and economic analysis. Not just lines on a chart, but zones validated by multi-discipline confluence.
Start Free — Get the Market of the WeekFree weekly report · No credit card · Upgrade anytime