30-Year Treasury Key Levels This Week — Support, Resistance & Confluence Zones
30-Year Treasury key levels breakdown: support zones, resistance zones, confluence and price structure.

Current Price Structure
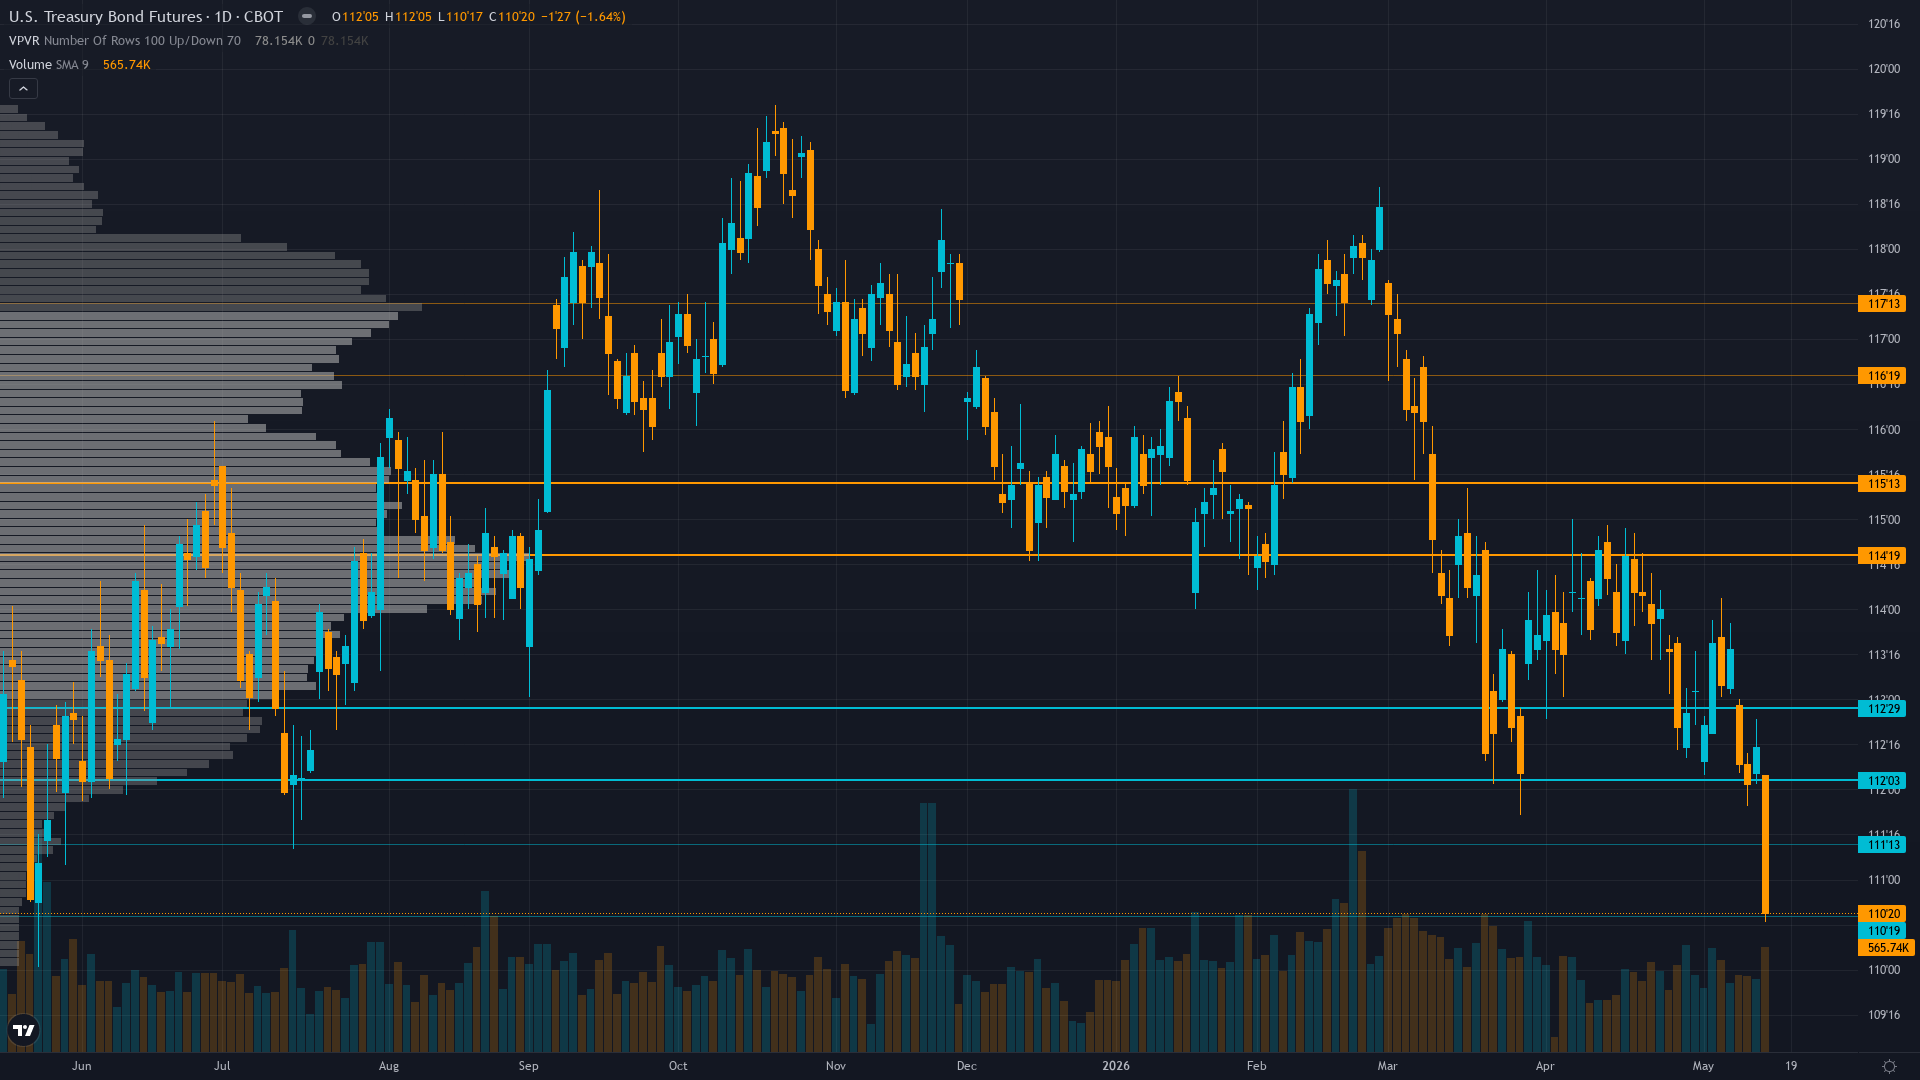
At 112.31, 30-year Treasury is unchanged — a pause that suggests the market is waiting for fresh direction. Treasury bond futures is in a breaking down after inflation shock market state, requiring careful assessment of current conditions.
Breakdown structure accelerating with price at 112.31 violating 113.5 support after May 6-7 rejection at 114.00; TradingView Strong Sell technical rating with declining open interest at 1.83M suggesting participant deleveraging as former resistance zones collapse
With trend strength at only 2/10, any directional bias is thin and easily disrupted.
Support Zone Context
Below the current level, ZB futures has structural support where demand has historically stepped in. The reliability of these zones depends on the volume profile and the number of prior interactions.
In the current DIVERGENT regime - VIX below 20 at 18.43 signals contained equity volatility with risk-on undertone yet bonds selling violently creating safe-haven paradox as yesterday's CPI inflation shock at 0.6% MoM removes Fed accommodation urgency despite traditionally defensive calm conditions exposing profound market skepticism about duration environment, support zones carry standard probability of reaction.
Ceilings & Supply Zones
Above current price, Treasury bond futures faces resistance zones where selling pressure has historically intensified. These levels represent previous supply zones, profit-taking areas, or structural barriers that price needs to overcome for continuation.
How firmly these zones hold depends on the confluence of volume, prior reactions, and the current market regime.
Where Disciplines Converge
For ZB futures, the levels that matter most are those confirmed by independent analytical approaches. When six different disciplines identify the same zone, the signal-to-noise ratio improves dramatically.
Volatility compression creating false calm environment; daily ranges compressing from 1.0-1.5 handles toward 0.5-0.75 handles as MOVE declines to 79.87 yet yesterday's breakdown on CPI with 30Y yields at 5.02% suggests potential for violent expansion creating 1.5-2.0 handle daily swings if inflation narrative persists; current 112.31 price near bottom of consolidation with June FOMC 31 days away creating near-term binary catalyst void
How Macro Agent Desk Identifies Key Levels
Macro Agent Desk identifies key levels through a six-agent process. Each analytical discipline contributes independently — technical for structure, institutional for smart money interest, options for hedging activity, fundamentals for fair value context, sentiment for crowd positioning, and economics for catalyst timing.
What this means in practice: every key level in the full weekly report has been stress-tested across multiple independent analytical frameworks before it reaches the page.
Our paid reports include specific support and resistance levels identified by six specialist agents — technical structure, institutional positioning, options flow, fundamentals, sentiment, and economic analysis. Not just lines on a chart, but zones validated by multi-discipline confluence.
Start Free — Get the Market of the WeekFree weekly report · No credit card · Upgrade anytime