30-Year Treasury Forecast This Week — Outlook, Drivers & Key Levels
This week's 30-Year Treasury outlook: key drivers, volatility context, risk-opportunity assessment and the week ahead.

Market Overview
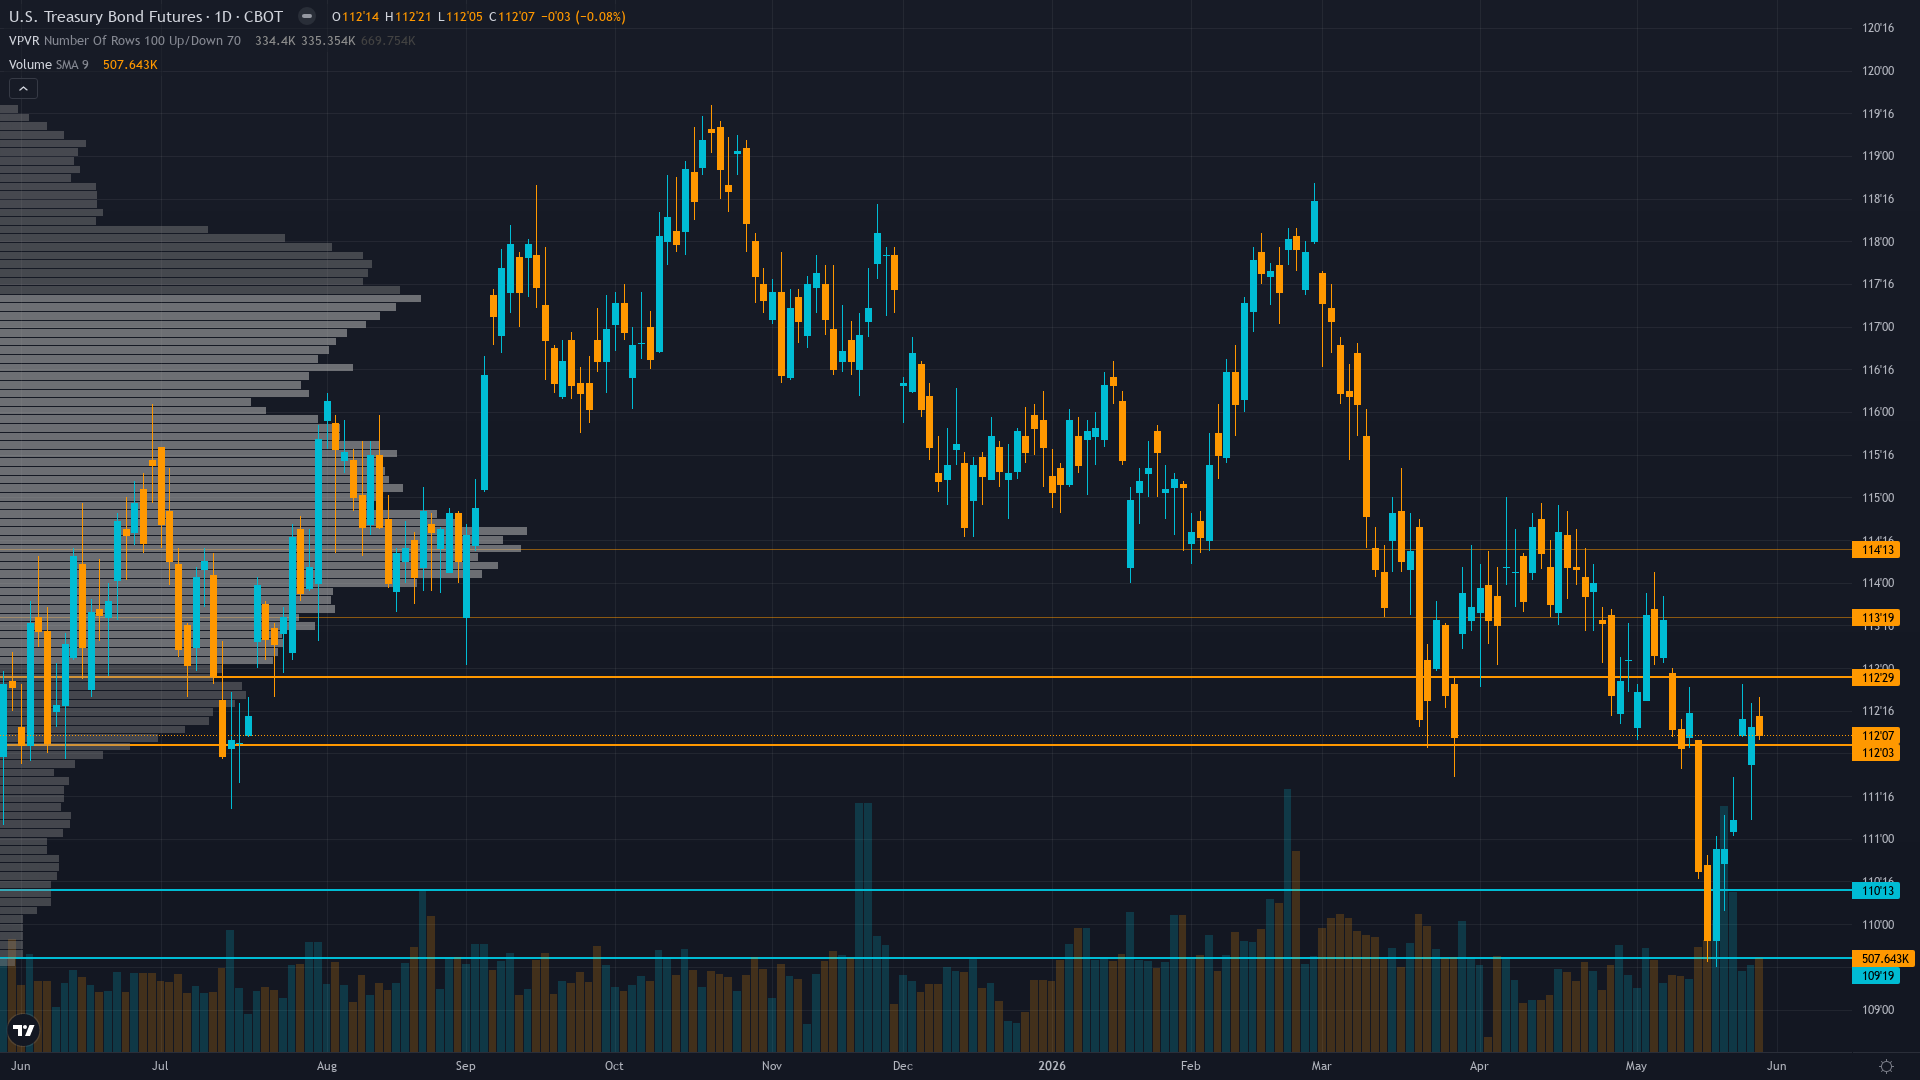
30-year Treasury stands at 110.875, having rallied 1.02% as bulls press their advantage. Treasury bond futures is in a consolidating after recovery rally market state, requiring careful assessment of current conditions.
Market pricing Fed on hold at June 16-17 FOMC with 64% probability maintaining 3.50-3.75% range; bonds consolidating 110-114 awaiting June 10 CPI clarity on whether inflation persists or moderates with Iran peace deal removing geopolitical premium
This Week's Catalysts & Drivers
Primary driver: Signal strength below Min Signal threshold of 1.1 mandating NO CALL per Rule 2 as probable weekly move at 0.6% sits at noise threshold with no catalyst before June 10 CPI creating low-information environment where directional call carries insufficient conviction
Secondary factor: Iran peace deal reports drove sharp rally invalidating last week BEARISH call with +1.44% gain placing miss streak at 1 while current bias streak at 4 consecutive BEARISH weeks approaches 5-week review threshold requiring thesis reassessment
Additional influence: MOVE volatility collapsed to 70.22 down 11.91% weekly from elevated regime signaling reduced panic yet cross-discipline conflict exists with 4 bearish agents versus 1 bullish creating 4v1 split insufficient to overcome noise threshold in low-catalyst void until June
Economic backdrop: Fed held April 29 at 3.50-3.75% with unprecedented 8-4 dissent vote signaling deep internal division; no FOMC until June 16-17 creating 17-day void; next catalyst June 10 CPI release critical for validating inflation trajectory with March 3.1% YoY spike requiring confirmation; Iran peace deal reports eased geopolitical premium in past 48 hours
Fundamental assessment: Fed at 3.50-3.75% with June 16-17 FOMC showing 64% hold probability versus 36% cut probability; FY2026 deficit at $2.065-2.1T from May Quarterly Refunding maintains structural supply pressure; 10Y yield at 4.45% as of May 29 eased from prior week 4.56% on Iran peace deal optimism creating fair value environment with known supply headwinds priced
Technical Picture
Downtrend since April 7 peak at 114.75 with lower highs and lower lows; current 110.875 sits below 50-day MA ~113.00 and 200-day MA ~115.50; recent bounce from 112.34 low to 110'28 shows short-term counter-trend strength without breaking bearish structure; declining open interest at 1.73M suggests participant deleveraging
At 3/10, trend strength is subdued, suggesting the market lacks a clear directional mandate.
Bull & Bear Case
Primary risk: June 10 CPI shows inflation persistence above 0.3% MoM core validating structural inflation above 2.5% forcing market to reprice Fed terminal rate higher or extend hold period sending ZB below 110 major support toward 108 with cascade potential representing additional 2-3% decline (Probability: medium)
Primary opportunity: May employment June 5 or CPI June 10 data shows material deterioration contradicting recent resilience forcing Fed to acknowledge higher-for-longer stance too restrictive triggering violent short covering rally above 112.5 resistance toward 114-115 zone from current washed-out positioning (Timeframe: Next 2-3 weeks through June 5 employment and June 10 CPI if data deteriorates significantly creating asymmetric upside opportunity from current compressed MOVE at 70.22)
This week's edge: Signal strength below Min Signal threshold—synthesized |signal| at 1.0 falls short of 1.1 Min Signal requirement mandating NO CALL per Rule 2. Low-information vacuum until June 10 CPI (10 days) and June 16-17 FOMC (17 days) limits edge beyond widely-recognized fiscal supply pressure offset by recent Iran peace deal catalyst already priced. Probable weekly move 0.6% marginally above 0.50% Noise Floor insufficient for directional conviction given cross-discipline 4v1 conflict and last week MISS penalty.
Volatility Regime
Volatility for T-bond futures is at the 42th percentile over 90 days — a normal regime that allows for standard position sizing and conventional trade management. The vol trend is down, with contraction across timeframes creating the kind of coiled conditions that historically resolve explosively.
Volatility compression creating moderating environment; daily ranges compressing from 1.0-1.5 handles during May breakdown toward current 0.5-0.75 handles as MOVE holds 70.22 plateau; current 110.875 price in middle of 110-112.5 consolidation with June 5 employment and June 10 CPI creating binary catalysts for breakout
What to Watch
The May CPI release at 8:30 AM ET critical for validating whether April inflation momentum persisting or reverting; if May exceeds 0.3% MoM core would cement Fed hawkish hold through Q3-Q4 2026 pressuring duration; if material deceleration could force Fed pivot acknowledgment triggering rally on Wednesday 10 June stands as the week's primary risk event — high-impact and capable of overriding the existing technical and sentiment setup.
The interplay between consolidating after recovery rally market conditions and upcoming catalysts will define this week's trading landscape for ZB futures.
This analysis covers one dimension. Our full weekly report combines six specialist agents into a single actionable briefing with directional bias, key levels, and risk-opportunity matrix.
Start Free — Get the Market of the WeekFree weekly report · No credit card · Upgrade anytime