30-Year Treasury Forecast This Week — Outlook, Drivers & Key Levels
This week's 30-Year Treasury outlook: key drivers, volatility context, risk-opportunity assessment and the week ahead.

Market Overview
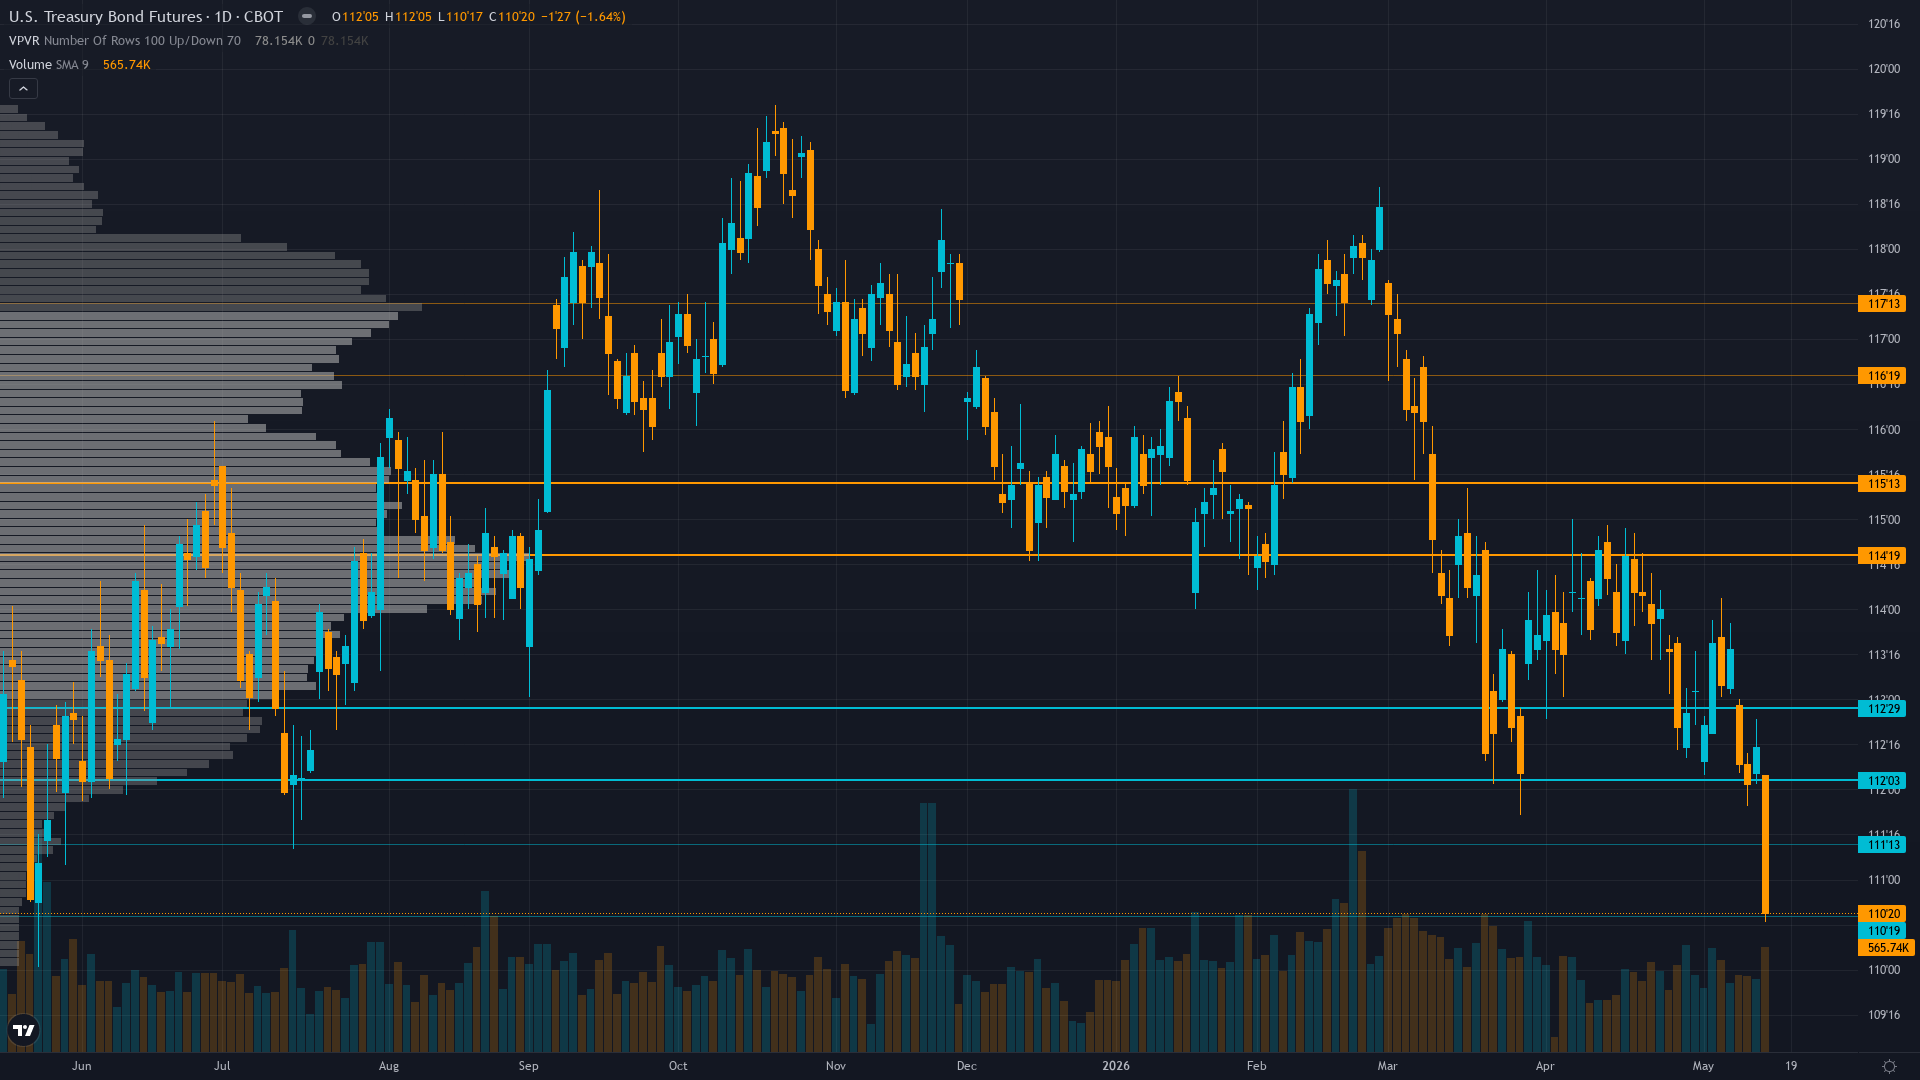
Trading at 112.31 with negligible movement, 30-year Treasury is in wait-and-see mode. Treasury bond futures is in a breaking down after inflation shock market state, requiring careful assessment of current conditions.
Market pricing Fed on extended hold through mid-2026 with terminal rate near 3% after yesterday's April CPI 0.6% MoM inflation shock; bonds consolidating 110-115 range awaiting May employment data and June FOMC clarity on whether energy-driven inflation spike represents trend reversal or transitory outlier
Upside & Downside
Primary risk: Continued breakdown below 111.5 support on sustained inflation persistence forcing market to reprice Fed terminal rate higher or extend hold period through Q3-Q4 2026 sending ZB toward 110 major support with cascade potential representing additional 2-3% decline from current 112.31 levels (Probability: high)
Primary opportunity: May employment or subsequent CPI data shows material deterioration contradicting April inflation outlier forcing Fed to acknowledge that higher-for-longer stance is too restrictive triggering violent short covering rally above 113.5 resistance toward 115-116 zone from current washed-out levels (Timeframe: Next 2-4 weeks through May employment data and June FOMC if economic data deteriorates significantly contradicting yesterday's inflation spike creating asymmetric upside opportunity from current panic-sold positioning)
This week's edge: Market potentially underpricing bond-specific capitulation selling creating contrarian oversold opportunity as Sentiment identifies extreme fear in Treasuries (Reuters headline bracing for pain not seen in decades) while equity greed at 63-66 F&G historically marks sentiment divergence extremes; alternatively market may be underpricing persistence of energy-driven inflation above 2.5% combined with fiscal deficit deterioration to $2.1T creating extended bearish cascade toward 110 support representing additional 2% decline from current 112.31 levels
Key Drivers This Week
Primary driver: April CPI released May 16 showing 0.6% MoM with energy inflation at 17.9% YoY creating hawkish repricing shock that sent 30Y yields to 5.02% and ZB down 1.1% from 113.56 to 112.31 invalidating any Fed easing expectations through mid-2026
Secondary factor: Last week NO CALL MISSED with 0.85% decline from 114.09 to 113.125 placing consecutive miss streak at 1 triggering mandatory Rule 3 conviction penalty of minus 1 point while current breakdown extends bearish momentum
Additional influence: MOVE volatility collapsed to 79.87 down 6.44% monthly from elevated levels creating dangerous complacency as bond market experiences capitulation selling per Reuters May 15 headline bond markets bracing for interest rate pain not seen in decades
Economic backdrop: Post-input development identified: April CPI released yesterday May 16 showed 0.6% MoM with energy costs surging 17.9% YoY steepest since September 2022 validating sticky inflation above Fed 2% target removing easing flexibility; no FOMC until June 2026 creating low-information void
Fundamental assessment: Fed at 3.50-3.75% after April 29 hold maintaining terminal rate guidance near 3% while yesterday's April CPI 0.6% MoM with 17.9% YoY energy inflation spike removes any rate cut urgency through mid-2026 creating structurally toxic duration environment with FY2026 deficit at $2.065-2.1T intensifying supply pressure
Price Structure
Breakdown structure accelerating with price at 112.31 violating 113.5 support after May 6-7 rejection at 114.00; TradingView Strong Sell technical rating with declining open interest at 1.83M suggesting participant deleveraging as former resistance zones collapse
Trend strength registers just 2/10, which typically corresponds to choppy, directionless price action.
Volatility Regime
Volatility for T-bond futures is at the 35th percentile over 90 days — a compressed regime where breakout potential builds beneath the surface. The vol trend is down, with contraction across timeframes creating the kind of coiled conditions that historically resolve explosively.
Volatility compression creating false calm environment; daily ranges compressing from 1.0-1.5 handles toward 0.5-0.75 handles as MOVE declines to 79.87 yet yesterday's breakdown on CPI with 30Y yields at 5.02% suggests potential for violent expansion creating 1.5-2.0 handle daily swings if inflation narrative persists; current 112.31 price near bottom of consolidation with June FOMC 31 days away creating near-term binary catalyst void
What to Watch
The FOMC policy decision June 17-18 2026 with statement and Powell press conference; market pricing near-zero cut probability but forward guidance critical given yesterday's inflation shock potentially forcing extended hawkish hold rhetoric cementing bearish duration outlook on Wednesday 17 June stands as the week's primary risk event — high-impact and capable of overriding the existing technical and sentiment setup.
The interplay between breaking down after inflation shock market conditions and upcoming catalysts will define this week's trading landscape for ZB futures.
This analysis covers one dimension. Our full weekly report combines six specialist agents into a single actionable briefing with directional bias, key levels, and risk-opportunity matrix.
Start Free — Get the Market of the WeekFree weekly report · No credit card · Upgrade anytime