30-Year Treasury Forecast This Week — Outlook, Drivers & Key Levels
This week's 30-Year Treasury outlook: key drivers, volatility context, risk-opportunity assessment and the week ahead.

Current Market Picture
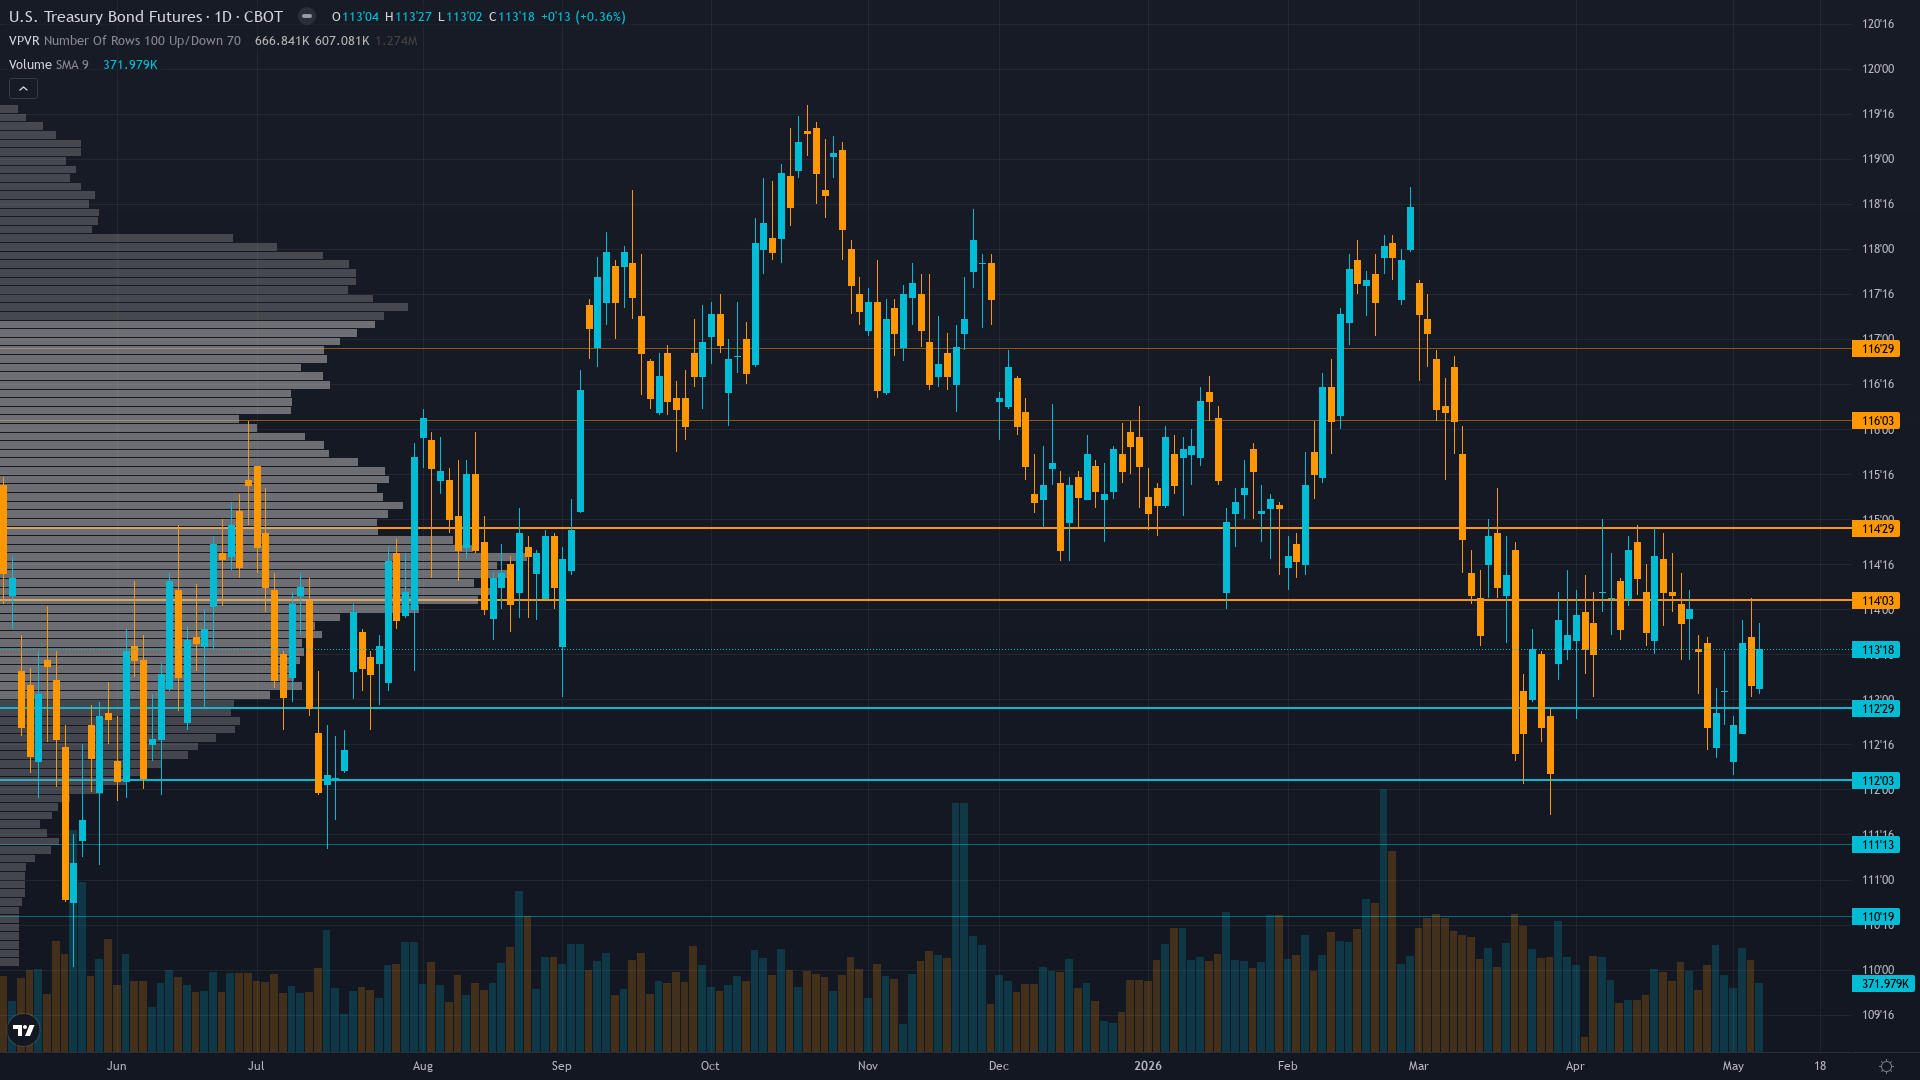
30-year Treasury is trading at 113.56, up a modest 0.36% as the market edges higher. Treasury bond futures is in a consolidating post-FOMC within narrow range market state, requiring careful assessment of current conditions.
Market pricing Fed on hold through mid-2026 with shallow easing trajectory maintaining 3.50-3.75% range per iShares; bonds consolidating 111-117 awaiting May 12 April CPI clarity on whether March 3.1% spike represents trend reversal or anomaly
Key Drivers This Week
Primary driver: Fundamental deterioration from May 6 Quarterly Refunding showing FY2026 deficit projected at $2.065-2.1 trillion exceeding prior $1.853T estimate representing $212-247B worsening with Treasury evaluating further auction size increases maintaining structural supply pressure
Secondary factor: Last week NO CALL MISSED with -0.85% decline from 114.09 to 113.125 placing consecutive miss streak at 1 triggering mandatory Rule 3 conviction penalty of -1 point reducing directional confidence
Additional influence: MOVE volatility declining to 67.25 down 6.68% weekly and 19.11% monthly from elevated levels signaling reduced panic creating false calm yet probable weekly move 0.5-0.65% sits marginally above 0.50% Noise Floor producing weak directional signal at threshold
Economic backdrop: Fed held rates April 29 at 3.50-3.75% maintaining shallow easing trajectory; next catalyst April CPI May 12 critical for validating whether disinflation stalling with March reading 3.1% YoY sticky above Fed 2% target; no major data releases this week creating low-information void
Fundamental assessment: Fed at 3.50-3.75% with June FOMC 99.4% hold probability maintaining terminal rate guidance near 3%; FY2026 deficit worsened to $2.065-2.1T from $1.853T baseline creating structural supply pressure despite stable foreign demand at $184.5B February TIC inflows
Price Structure
Range-bound 112.5-115 consolidation with price at 113.56 below 114.5 pivot showing compression; TradingView technical rating SELL with declining open interest at 1.83M suggesting participant deleveraging
Trend strength registers just 3/10, which typically corresponds to choppy, directionless price action.
Upside & Downside
Primary risk: April CPI on May 12 surprises hot above 0.3% MoM core validating persistent inflation above 2.5% forcing market to reprice Fed terminal rate higher or extend hold period sending ZB below 112.5 support toward 111 major support with cascade potential representing additional 2-3% decline (Probability: medium)
Primary opportunity: April CPI shows material deceleration below consensus contradicting March 3.1% YoY outlier forcing Fed to acknowledge disinflation trajectory resuming triggering short covering rally above 115 resistance toward 117-118 zone from current compressed MOVE levels at 67.25 (Timeframe: Next 1-3 weeks through May 12 CPI release and subsequent data if inflation deteriorates significantly below consensus creating 15-20% MOVE expansion from current 67.25 to 80-85 range)
This week's edge: Market potentially underpricing magnitude of fiscal deterioration with FY2026 deficit worsening by $212-247B to $2.065-2.1T from baseline within past 4 days per May 6-8 Quarterly Refunding creating unprecedented supply pressure; also underpricing volatility mean reversion risk with MOVE at 67.25 compressed 19% monthly despite deficit shock creating false stability before May 12 CPI binary catalyst
Volatility Context
At the 32th percentile, T-bond futures volatility is unusually subdued, creating conditions that historically precede sharp directional moves. Realised vol is declining steadily, compressing into ranges that tend to snap when a catalyst breaks the equilibrium.
Volatility compression creating moderating environment; daily ranges compressing from 1.0-1.5 handles toward 0.5-0.75 handles as MOVE declines to 67.25; current 113.56 price in middle of 112.5-115 consolidation with May 12 CPI creating near-term binary catalyst that could force breakout in either direction
Week Ahead Outlook
The next major catalyst is April CPI release at 8:30 AM critical for validating whether inflation momentum stalling with March 1.1% MoM spike creating hawkish pressure; if April exceeds 0.3% MoM core would push rate cut expectations to Q4 2026 or beyond pressuring duration on Tuesday 12 May — a high-impact event that could materially shift the directional picture.
For long bond, the balance between existing momentum and scheduled risk events sets the stage for the week ahead.
This analysis covers one dimension. Our full weekly report combines six specialist agents into a single actionable briefing with directional bias, key levels, and risk-opportunity matrix.
Start Free — Get the Market of the WeekFree weekly report · No credit card · Upgrade anytime