30-Year Treasury Forecast This Week — Outlook, Drivers & Key Levels
This week's 30-Year Treasury outlook: key drivers, volatility context, risk-opportunity assessment and the week ahead.

Market Overview
Trading at 114 with a 0.14% dip, 30-year Treasury is giving back ground gradually. Treasury bond futures is in a consolidating within multi-week bearish structure market state, requiring careful assessment of current conditions.
Market pricing Fed on hold through May with shallow easing trajectory through 2026-27; bonds consolidating 112-118 range awaiting clarity on whether March CPI spike was Iran-driven anomaly or structural inflation resurgence
This Week's Catalysts & Drivers
Primary driver: March CPI shock to 3.3% from 2.4% creating hawkish repricing environment with Fed May 6-7 FOMC priced at 85% hold probability while structural deficit pressure persists at $1.2T H1 FY2026
Secondary factor: MOVE volatility compression to 72.15 down 20% weekly from elevated levels signals reduced panic but artificial calm ahead of May FOMC creating binary setup
Additional influence: Four consecutive BEARISH weeks all graded CORRECT totaling -2.61% cumulative decline placing asset at 5-week Bias Review After threshold requiring fresh first-principles justification
Economic backdrop: March CPI 3.3% YoY spike from 2.4% prior driven by Iran war energy inflation removes Fed easing urgency; March NFP +178k vs 60k consensus shows labor resilience; Fed on extended hold through May with terminal rate near 3% creating toxic duration environment
Fundamental assessment: Fed at 3.50-3.75% with May 6-7 meeting 85% hold probability; March CPI spike to 3.3% removes rate cut urgency despite labor market softness; FY2026 deficit $1.2T H1 maintains structural supply pressure at elevated yield levels
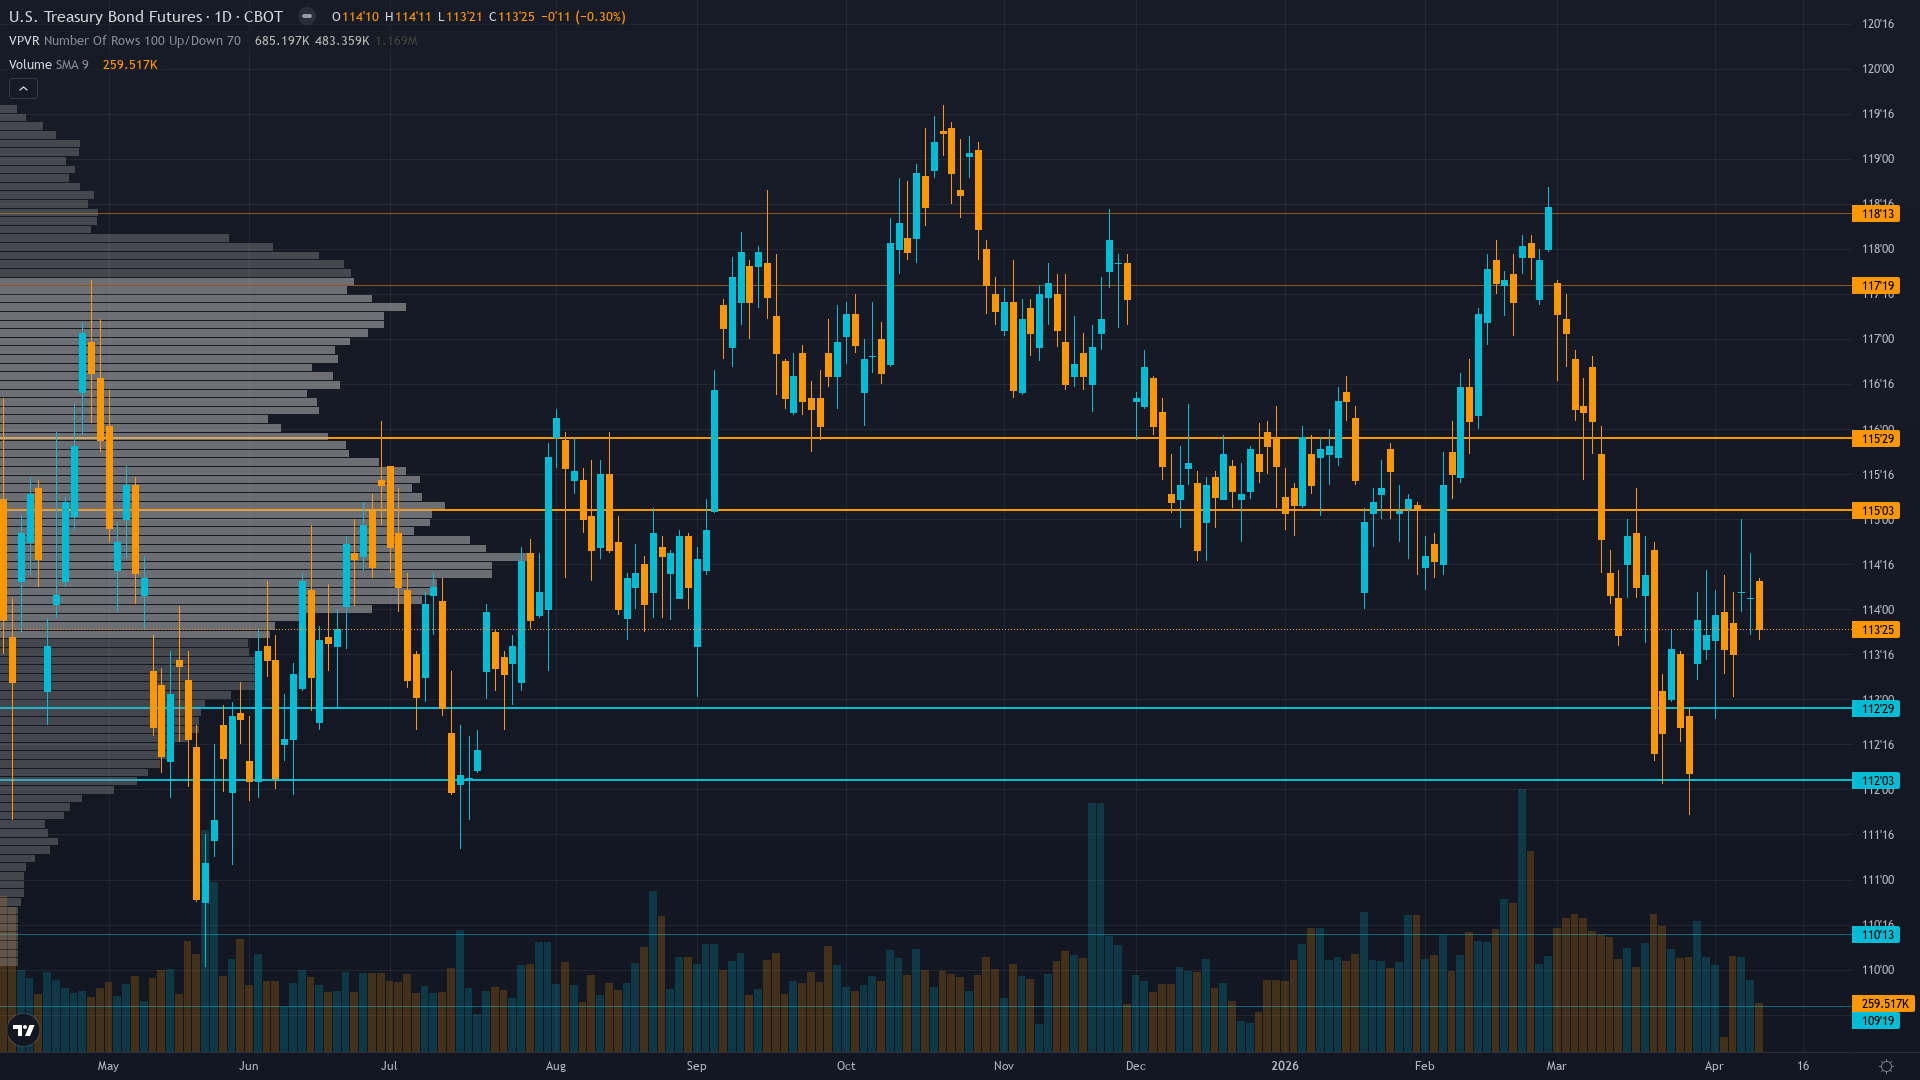
Technical Picture
Range-bound 111'15-122'11 with price at 114'00 below 116'20 midpoint; former 116.5 support now resistance; declining open interest at 1.85M suggests participant deleveraging
At 3/10, trend strength is subdued, suggesting the market lacks a clear directional mandate.
Bull & Bear Case
Primary risk: May FOMC delivers hawkish hold with Powell rhetoric emphasizing inflation persistence forcing market to reprice terminal rate higher or extend hold period sending ZB below 112.5 support toward 110 with cascade potential representing additional 2-4% decline (Probability: medium)
Primary opportunity: April employment or CPI data shows material deterioration contradicting March NFP outlier and CPI spike forcing Fed pivot acknowledgment triggering violent short covering rally above 115.5 resistance toward 118-120 zone from current compressed levels (Timeframe: Next 2-4 weeks through April data releases and May 6-7 FOMC if economic deterioration emerges)
This week's edge: Market potentially underpricing probability that March NFP +178k and CPI 3.3% represent statistical outliers rather than trend reversal with April data reverting to weakness creating asymmetric upside opportunity from compressed MOVE at 72.15 and current price near bottom of consolidation range; alternatively market may be underpricing persistence of Iran war inflation combined with labor market resilience creating extended hawkish hold scenario sending yields higher and bond prices toward 112 support
Volatility Regime
Volatility for T-bond futures is at the 38th percentile over 90 days — a compressed regime where breakout potential builds beneath the surface. The vol trend is down, with contraction across timeframes creating the kind of coiled conditions that historically resolve explosively.
Volatility compression creating moderating environment; daily ranges compressing from 1.0-1.5 handles toward 0.5-0.75 handles as MOVE declines; current 114.00 price in middle of 112.5-115.5 consolidation with May 6-7 FOMC creating near-term binary catalyst that could force breakout in either direction
What to Watch
The FOMC policy decision May 6-7 with statement at 2:00 PM May 7 and Powell press conference at 2:30 PM; 85% probability of hold at 3.50-3.75% with no SEP/dot plot but forward guidance critical given March CPI shock on Thursday 7 May stands as the week's primary risk event — high-impact and capable of overriding the existing technical and sentiment setup.
The interplay between consolidating within multi-week bearish structure market conditions and upcoming catalysts will define this week's trading landscape for ZB futures.
This analysis covers one dimension. Our full weekly report combines six specialist agents into a single actionable briefing with directional bias, key levels, and risk-opportunity matrix.
Start Free — Get the Market of the WeekFree weekly report · No credit card · Upgrade anytime


