30-Year Treasury Forecast This Week — Outlook, Drivers & Key Levels
This week's 30-Year Treasury outlook: key drivers, volatility context, risk-opportunity assessment and the week ahead.

Market Overview
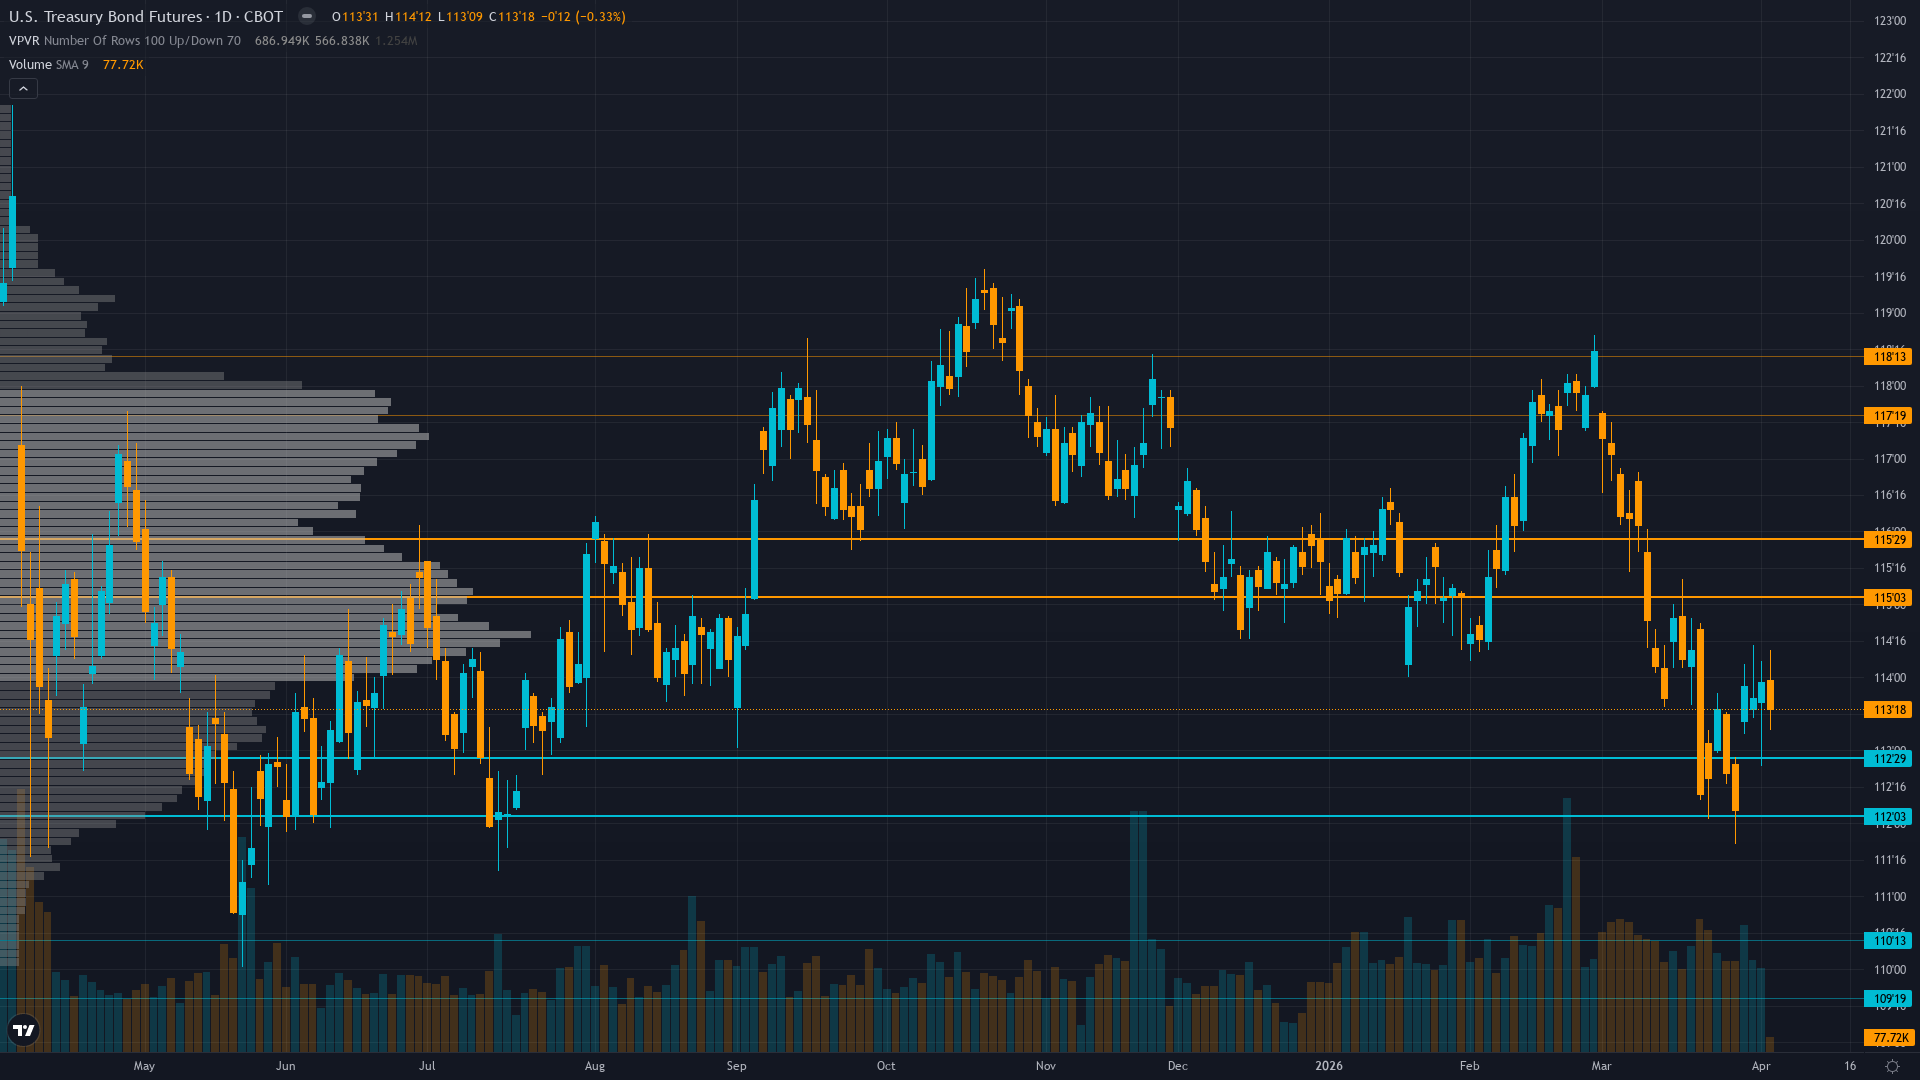
30-year Treasury sits at 114 after slipping 0.14% — a shallow pullback rather than a decisive move. Treasury bond futures is in a consolidating within multi-week breakdown structure market state, requiring careful assessment of current conditions.
Market pricing Fed on hold through May with shallow easing trajectory through 2026-27; bonds consolidating 112-118 range awaiting April economic data clarity on whether March NFP was outlier or trend confirmation
This Week's Catalysts & Drivers
Primary driver: March NFP blowout surprise at +178k vs 59k consensus removing urgency for Fed easing with no FOMC until May creating low-information vacuum while MOVE volatility compression to 84.41 from 111.95 weekly high signals abrupt fear reduction yet structural fiscal pressure from $1.9T deficit persists
Secondary factor: Inflation persistence at 2.4-2.8% YoY maintaining Fed's higher-for-longer stance with 30-year Treasury auction April 9 testing demand at elevated yield levels near 4.88%
Additional influence: ZB at 4-week consecutive BEARISH streak approaching 5-week Bias Review After threshold with recent price action confirming bearish thesis through 4 consecutive CORRECT calls totaling -3.45% cumulative decline validating structural repricing environment
Economic backdrop: March NFP +178k massive upside surprise vs 59k removes rate cut urgency; core inflation 2.5% YoY sticky above Fed's 2% target; no FOMC until May 6-7 creating 31-day information void with April CPI release April 10-11 as next catalyst
Fundamental assessment: Fed held at 3.50-3.75% with terminal rate guidance near 3% creating structurally bearish environment; FY2026 deficit at $1.9T with heavy April-May issuance maintaining supply pressure despite modestly favorable valuation at current yield levels
Technical Picture
Range-bound 111'15-122'11 consolidation with price at 114'00 below 116'20 midpoint showing compression; mixed momentum with long-term stochastic buy conflicting with short-term exit signal and declining open interest at 1.85M suggesting participant deleveraging
At 3/10, trend strength is subdued, suggesting the market lacks a clear directional mandate.
Risk Environment
With vol compressed to the 38th percentile, T-bond futures is in the kind of quiet period that tends to end abruptly when a catalyst arrives. Volatility is contracting, with realised vol declining across timeframes. Compressed volatility often precedes sharp directional moves as energy builds.
Volatility compression creating moderating environment; daily ranges compressing from 1.0-1.5 handles toward 0.5-0.75 handles as MOVE declines; current 114.00 price in middle of 112.5-115.5 consolidation with April 9 auction and April 10-11 CPI creating near-term binary catalysts that could force breakout in either direction
Risk-Reward Assessment
Primary risk: Continued strong economic data through April showing labor market resilience and inflation persistence forcing market to reprice Fed terminal rate higher with extended hawkish hold sending bonds below 112 support toward 108-110 levels representing additional 3-5% decline (Probability: medium)
Primary opportunity: Economic data deterioration materializing through April employment or CPI releases forcing Fed to acknowledge growth slowing despite March NFP surprise triggering short covering rally above 115.5 resistance toward 118-120 zone from current compressed levels (Timeframe: Next 2-4 weeks through April 10-11 CPI release and April employment data if deterioration emerges contradicting March NFP outlier)
This week's edge: Market potentially underpricing probability that March NFP +178k was statistical outlier rather than trend reversal with April data reverting to weakness creating asymmetric upside opportunity from compressed MOVE at 84.41 and current price near bottom of consolidation range; alternatively market may be underpricing persistence of labor market strength combined with sticky inflation creating extended hawkish hold scenario sending yields higher and bond prices toward 112 support
What to Watch
30-year Treasury bond auction testing demand at elevated yield levels near 4.88% with FY2026 deficit supply pressure remaining key fundamental headwind (Thursday 9 April) sits in the medium-impact category — unlikely to single-handedly shift the picture, but capable of adding directional fuel.
The interplay between consolidating within multi-week breakdown structure market conditions and upcoming catalysts will define this week's trading landscape for ZB futures.
This analysis covers one dimension. Our full weekly report combines six specialist agents into a single actionable briefing with directional bias, key levels, and risk-opportunity matrix.
Start Free — Get the Market of the WeekFree weekly report · No credit card · Upgrade anytime


