30-Year Treasury Forecast This Week — Outlook, Drivers & Key Levels
This week's 30-Year Treasury outlook: key drivers, volatility context, risk-opportunity assessment and the week ahead.

Current Market Picture
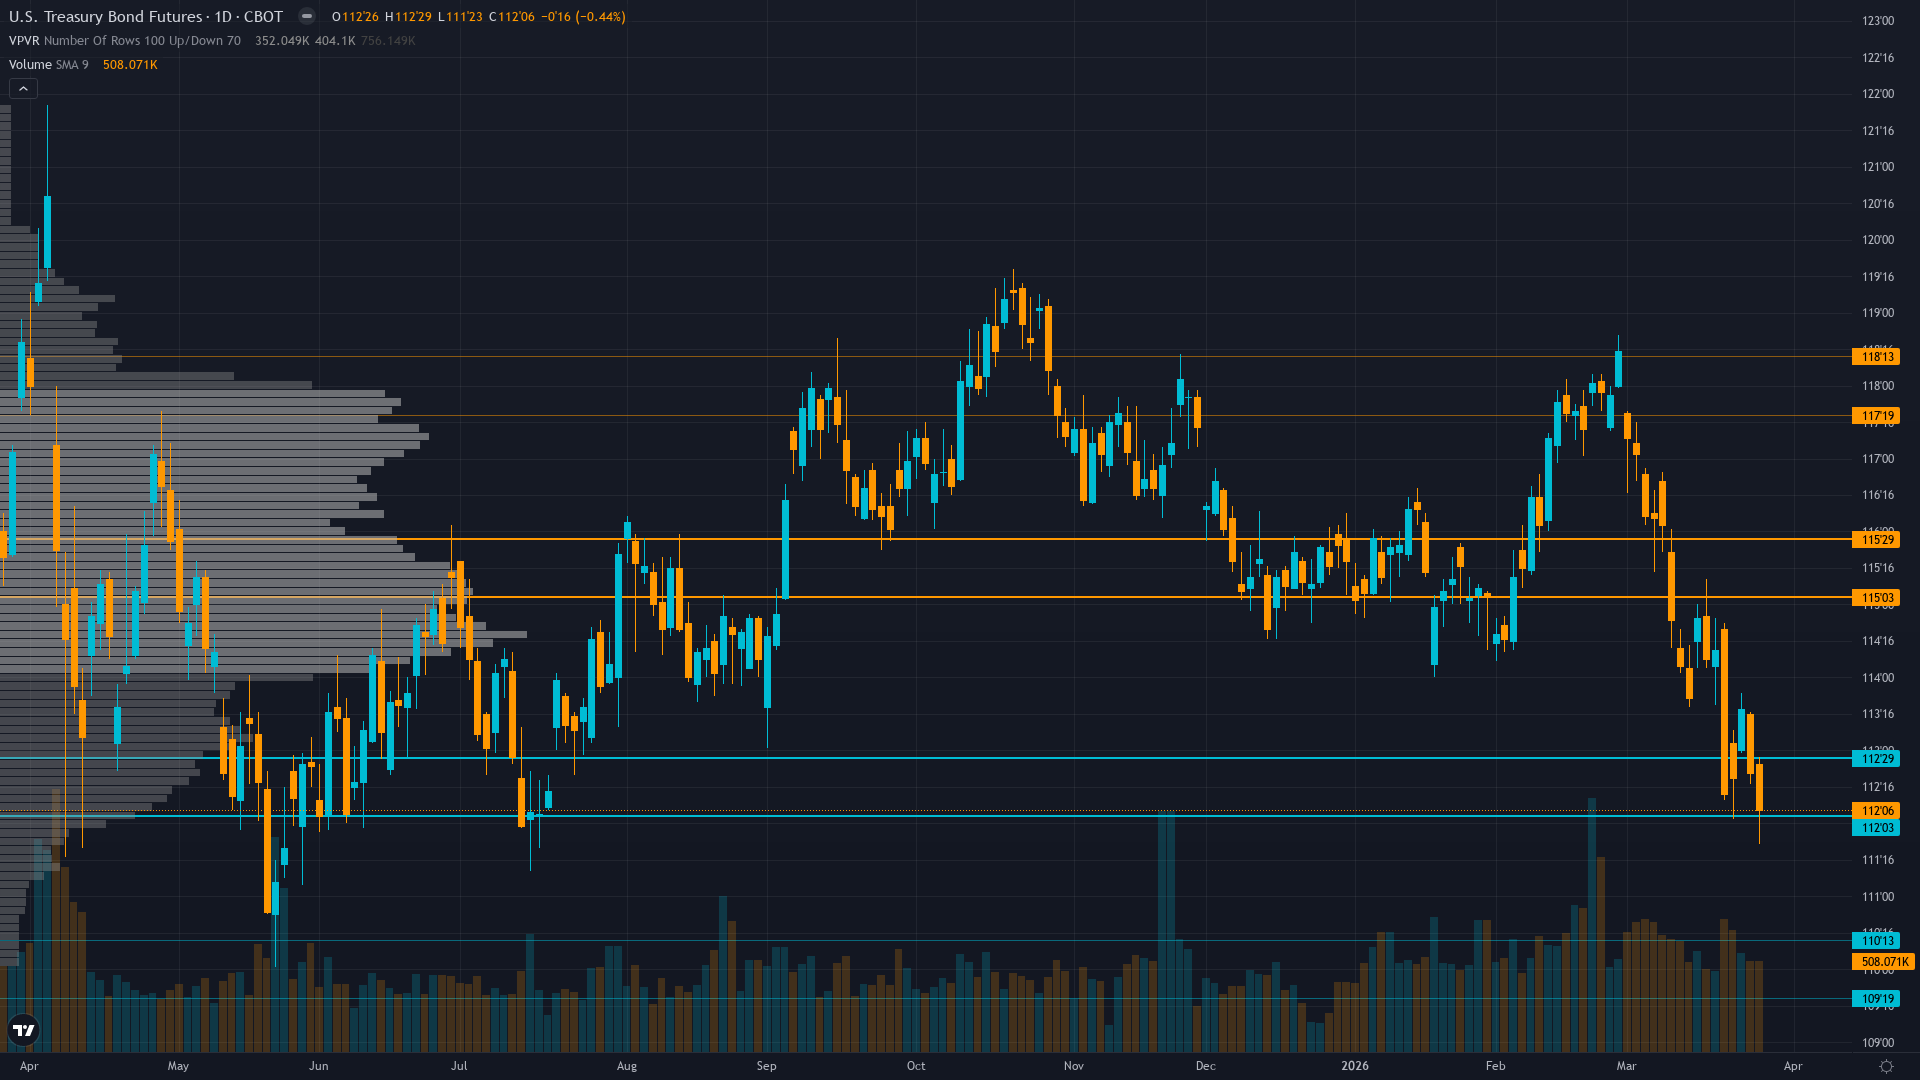
30-year Treasury holds at 114.03, up a marginal 0.05% as the market grinds forward. Treasury bond futures is in a consolidating within multi-week breakdown structure market state, requiring careful assessment of current conditions.
Market pricing Fed on hold through May with shallow easing through 2027; bonds consolidating 110-118 range awaiting Iran war resolution and April economic data clarity on labor-inflation tradeoff
Key Drivers This Week
Primary driver: Iran war creating maximum policy uncertainty with Fed held March 18 at 3.50-3.75% paralyzed by conflicting mandates - labor softening (Feb NFP -92k) argues for cuts but core inflation at 2.5% YoY and geopolitical energy shock preventing accommodation creating toxic environment for duration
Secondary factor: MOVE volatility index spiking to 111.95 up 41.56% weekly and 69.06% monthly from artificially compressed regime confirming violent mean reversion creating explosive two-way risk environment with daily ranges expanding from 0.5 to 1.5-2.0 handle swings
Additional influence: Fresh fundamental deterioration via March 28 Fortune report showing weak Treasury auction demand as Pentagon seeks $200B Iran war funding with $10T debt rollover required in 2026 intensifying structural supply pressure despite elevated yields
Economic backdrop: Fed DOVISH HOLD March 18 acknowledged softening labor and Iran uncertainty but constrained by sticky core inflation 2.5% YoY; Feb NFP -92k with -911k benchmark revision; geopolitical shock creating maximum monetary policy uncertainty heading into May when Powell's term ends
Fundamental assessment: Fed at 3.50-3.75% facing stagflation risk - labor deteriorating (NFP -92k) yet inflation sticky at 2.5%; Iran war forcing Pentagon to seek $200B adding to FY2026 $1.9T deficit creating relentless supply pressure at worst possible time
Price Structure
Range-bound 112.5-115.5 consolidation within broader breakdown structure from 118+ levels; former 116.5 support now resistance; TradingView Strong Sell technical rating with momentum deteriorating
Trend strength registers just 3/10, which typically corresponds to choppy, directionless price action.
Upside & Downside
Primary risk: Iran war escalation driving oil shock above $100 forcing Fed into extended hawkish hold or rate hike consideration despite weak labor market creating severe bearish repricing for duration with breakdown below 112 major support toward 108-110 levels representing additional 3-4% decline (Probability: medium)
Primary opportunity: De-escalation of Iran conflict removing energy-driven inflation premium triggering violent short covering rally above 115.5 resistance toward 118-120 zone as safe-haven demand reasserts from deeply oversold positioning and Fed easing expectations revive (Timeframe: Next 2-4 weeks dependent on geopolitical developments and April economic data releases (March NFP April 4, March CPI mid-April) forcing resolution of current policy paralysis)
This week's edge: Market potentially underpricing war-driven fiscal deterioration with Pentagon seeking $200B supplemental appropriation on top of $1.9T baseline deficit creating unprecedented supply pressure; also underpricing volatility expansion risk with MOVE at 111.95 still below historical stress levels of 120-140 suggesting further upside despite 69% rally from lows
Volatility Context
At the 68th percentile, T-bond futures volatility sits in a normal range, neither compressed enough to signal a breakout nor elevated enough to demand caution. Realised vol is trending higher across the curve, which tends to accompany transitional periods where the market is repricing risk.
Volatility expansion creating elevated environment with daily ranges expanding from 0.5 handles to 1.0-1.5 handles; current 114.03 price at mid-range between 112.5-115.5 consolidation creates maximum binary risk with potential for violent breakouts in either direction as Iran war and April data force resolution
Week Ahead Outlook
The next major catalyst is March employment report (NFP) release - critical for confirming whether February's -92k represents trend deterioration or anomaly forcing Fed to choose between mandates on Saturday 4 April — a high-impact event that could materially shift the directional picture.
For long bond, the balance between existing momentum and scheduled risk events sets the stage for the week ahead.
This analysis covers one dimension. Our full weekly report combines six specialist agents into a single actionable briefing with directional bias, key levels, and risk-opportunity matrix.
Start Free — Get the Market of the WeekFree weekly report · No credit card · Upgrade anytime


