30-Year Treasury Forecast This Week — Outlook, Drivers & Key Levels
This week's 30-Year Treasury outlook: key drivers, volatility context, risk-opportunity assessment and the week ahead.

Market Overview
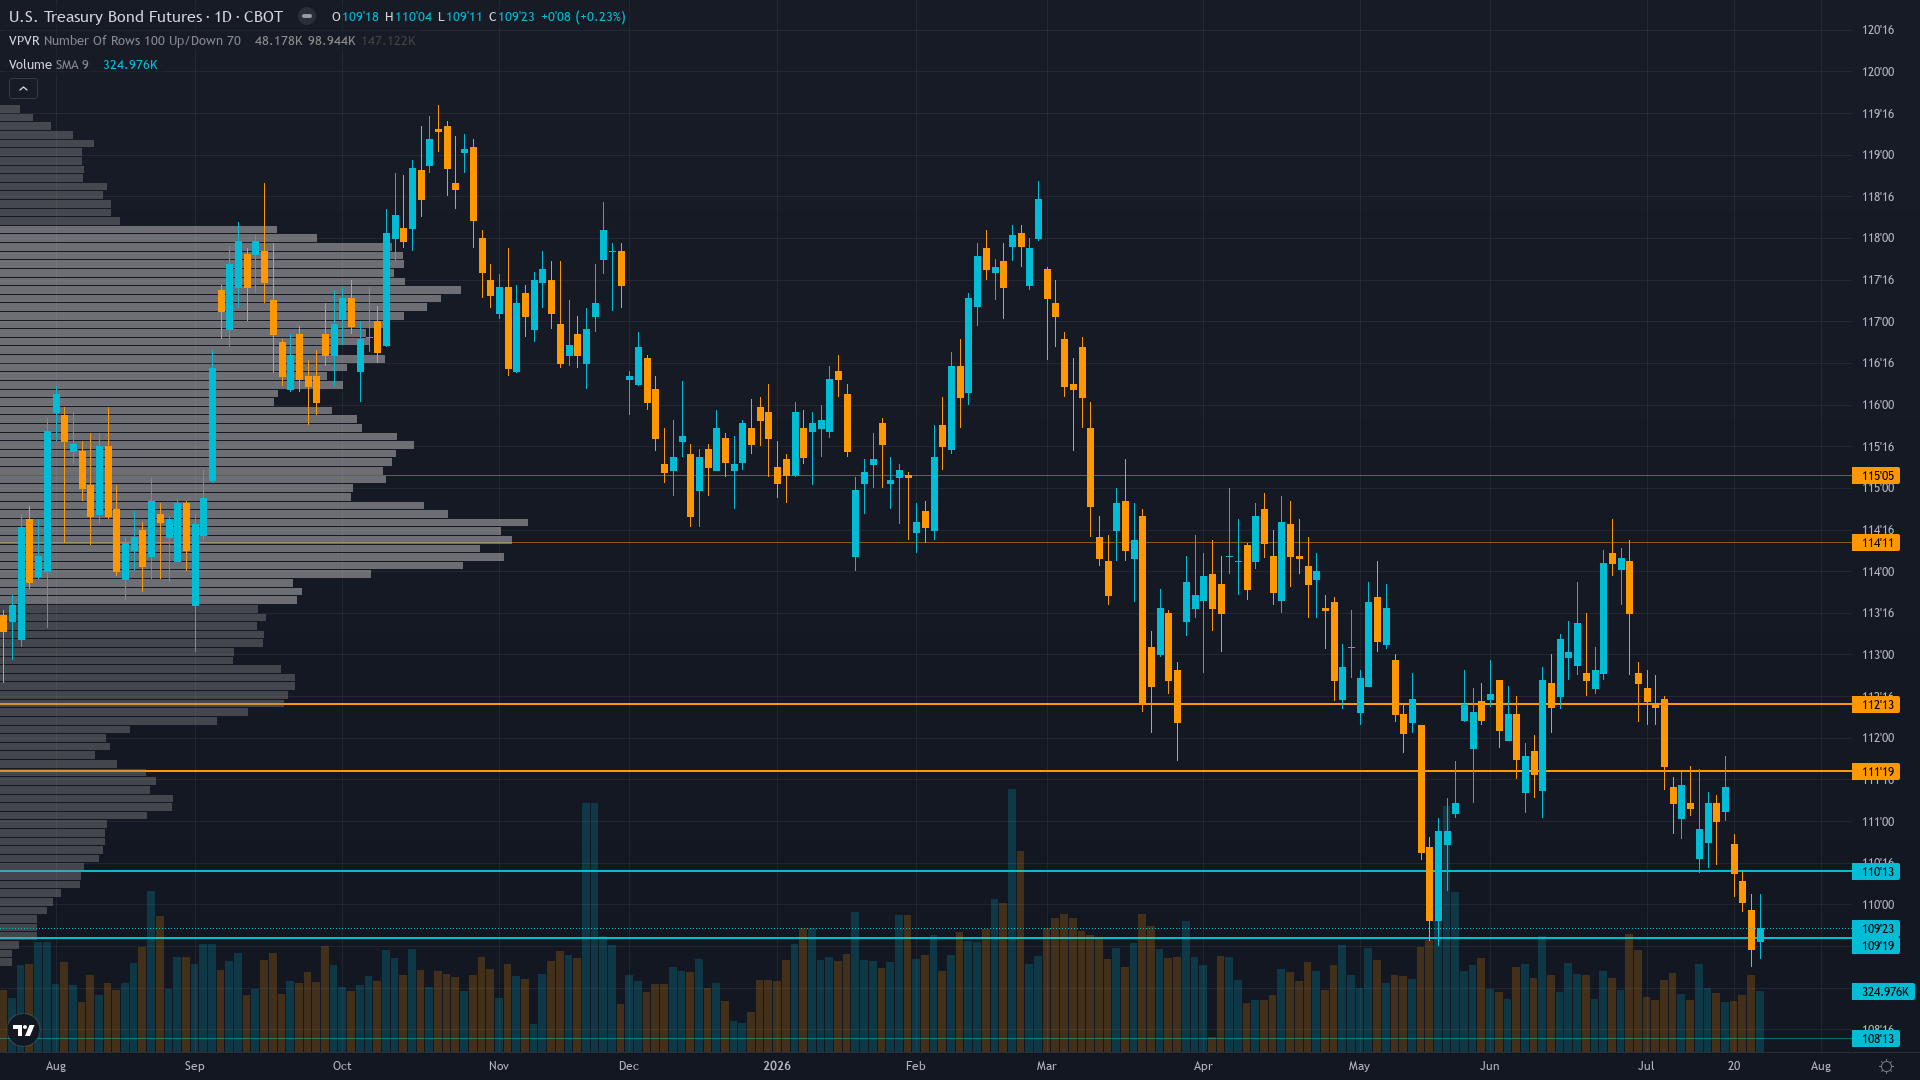
30-year Treasury sits at 114.09 after a 0.05% gain — a quiet move higher without aggressive momentum. Treasury bond futures is in a consolidating within breakdown structure market state, requiring careful assessment of current conditions.
Market pricing Fed on hold through May with only shallow additional easing through 2027; bonds consolidating 112-118 range awaiting Iran war resolution and April economic data clarity on labor-inflation tradeoff
This Week's Catalysts & Drivers
Primary driver: Iran war creating maximum policy uncertainty with Fed held March 18 at 3.50-3.75% unable to ease despite weak labor (Feb NFP -92k) due to sticky inflation (core 2.5% YoY) and geopolitical energy-driven inflation risk pushing yields higher
Secondary factor: MOVE volatility index spiking to 108.84 up 28% in 24 hours and 58% from lows confirming violent mean reversion from compressed regime creating explosive two-way risk environment with daily ranges expanding from 0.5 to 1.5-2.0 handles
Additional influence: Structural fiscal deterioration with CBO March 9 report showing $1.9T FY2026 deficit and $1T borrowed in first 5 months maintaining relentless Treasury supply pressure despite safe-haven demand from elevated VIX at 26.78
Economic backdrop: Fed DOVISH HOLD March 18 acknowledged softening labor and Iran uncertainty but constrained by sticky inflation; core CPI 2.5% YoY; Feb NFP -92k; geopolitical shock creating maximum monetary policy uncertainty into May
Fundamental assessment: Fed at 3.50-3.75% paralyzed by conflicting mandates - labor softening (NFP -92k) argues for cuts but core inflation at 2.5% and Iran war energy shock preventing accommodation; FY2026 deficit $1.9T creating structural supply pressure
Technical Picture
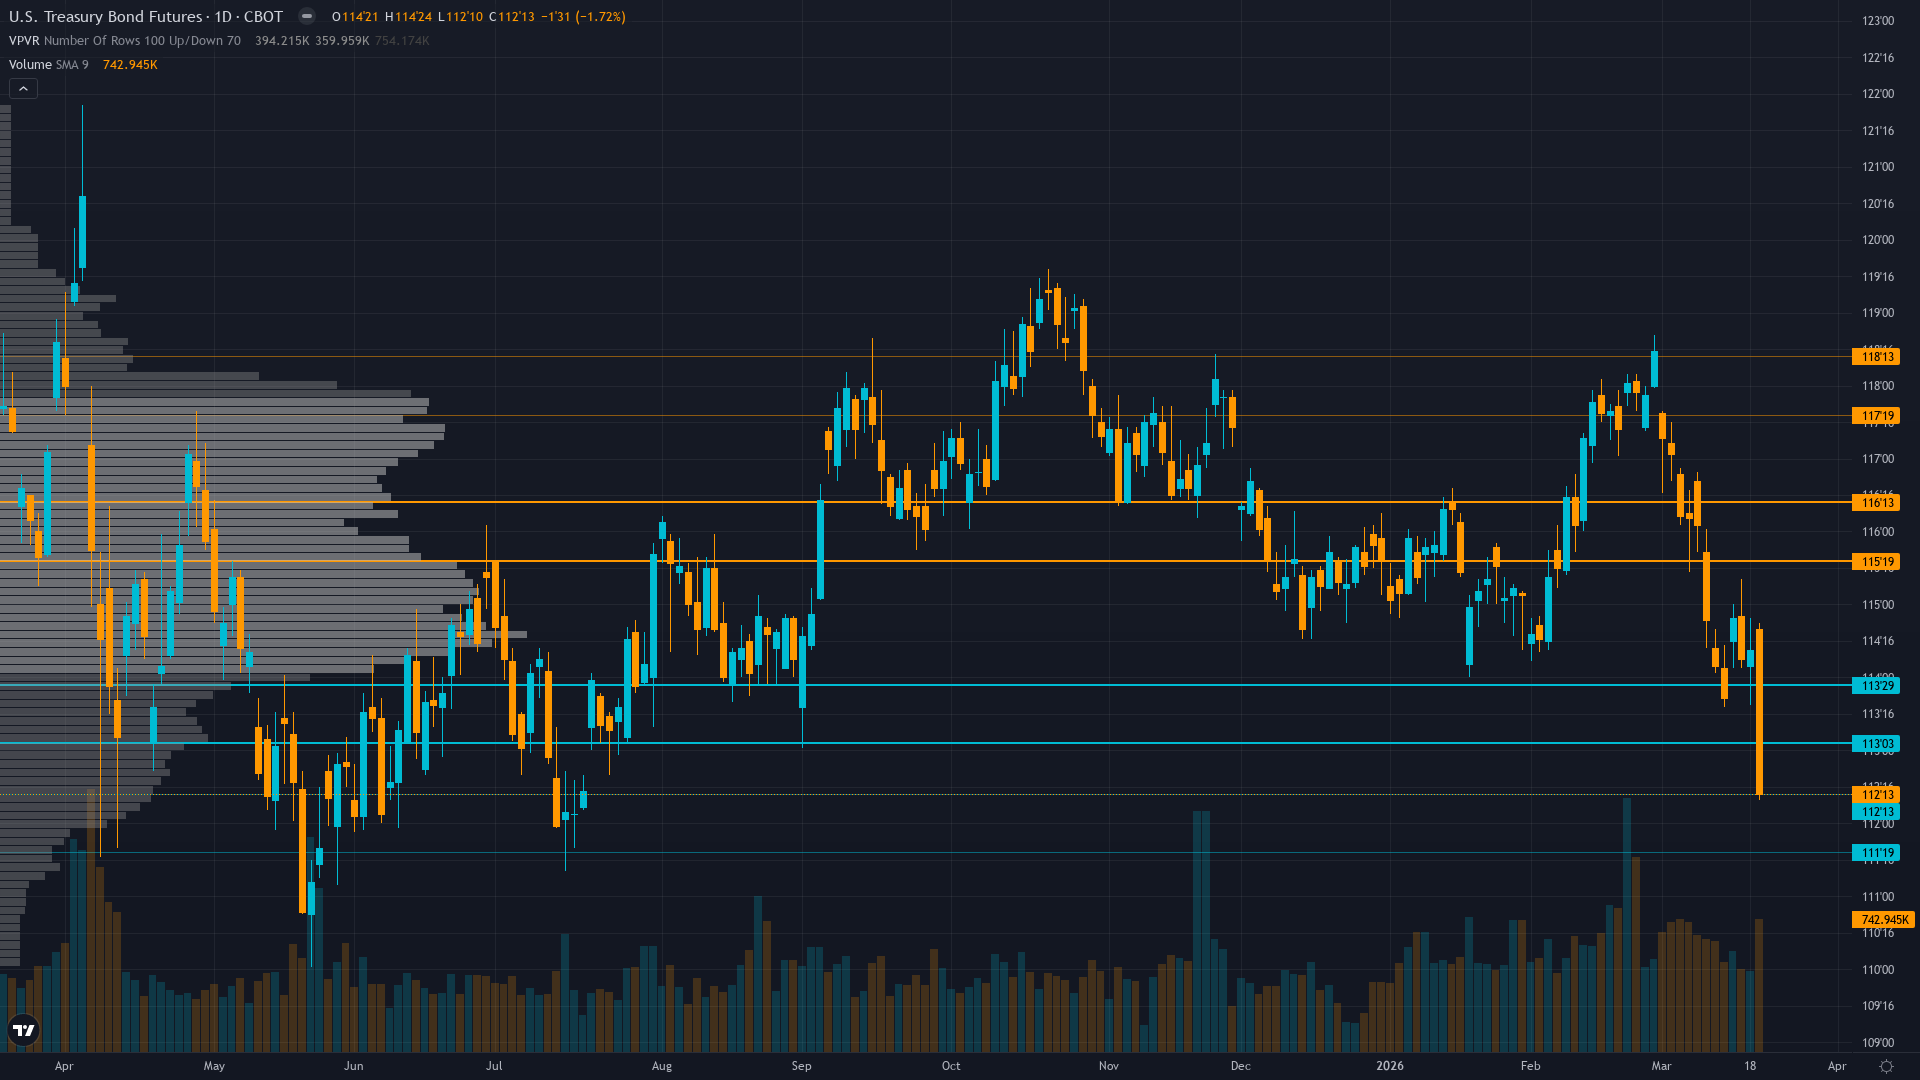
Range-bound 113.5-116 consolidation after violent breakdown from 118+ levels; Strong Sell technical rating with former 116.5 support now resistance; testing mid-range equilibrium
At 3/10, trend strength is subdued, suggesting the market lacks a clear directional mandate.
Risk Environment
With vol at the 62th percentile over 90 days, T-bond futures is in a measured regime that doesn't require unusual adjustments. Volatility is expanding, with realised vol rising across timeframes. This typically signals increasing uncertainty and wider daily ranges ahead.
Volatility expansion creating elevated environment with daily ranges expanding from 0.5 handles to 1.0-1.5 handles; current 114.09 price at mid-range between 113.5-116 consolidation creates maximum binary risk with potential for violent breakouts in either direction as Iran war and April data force resolution; expect 1.5-2.0 handle daily swings versus historical 0.75 handle average
Risk-Reward Assessment
Primary risk: Iran war escalation driving oil shock above $100 forcing Fed into extended hold or rate hike consideration despite weak labor market creating severe bearish repricing for duration with potential breakdown below 112 major support toward 108-110 levels (Probability: medium)
Primary opportunity: De-escalation of Iran conflict removing energy-driven inflation premium triggering violent short covering rally above 116 resistance toward 118-120 zone as safe-haven demand reasserts from deeply oversold positioning (Timeframe: Next 2-4 weeks dependent on geopolitical developments and April economic data releases (March NFP April 4, March CPI mid-April))
This week's edge: Market significantly underpricing volatility expansion risk with MOVE at 108.84 still below historical stress levels of 120-140 suggesting further upside despite 58% rally from lows; also potential underpricing of quarter-end rebalancing demand in 9 days creating tactical squeeze opportunity above 116 resistance if institutional duration extension materializes
What to Watch
Quarter-end rebalancing flows as pension funds mechanically adjust duration exposure creating potential temporary demand for long Treasuries (Tuesday 31 March) sits in the medium-impact category — unlikely to single-handedly shift the picture, but capable of adding directional fuel.
The interplay between consolidating within breakdown structure market conditions and upcoming catalysts will define this week's trading landscape for ZB futures.
This analysis covers one dimension. Our full weekly report combines six specialist agents into a single actionable briefing with directional bias, key levels, and risk-opportunity matrix.
Start Free — Get the Market of the WeekFree weekly report · No credit card · Upgrade anytime