30-Year Treasury COT & Institutional Positioning — Smart Money Analysis
30-Year Treasury institutional positioning: COT data, sentiment analysis and smart money flow assessment.

The Institutional Landscape
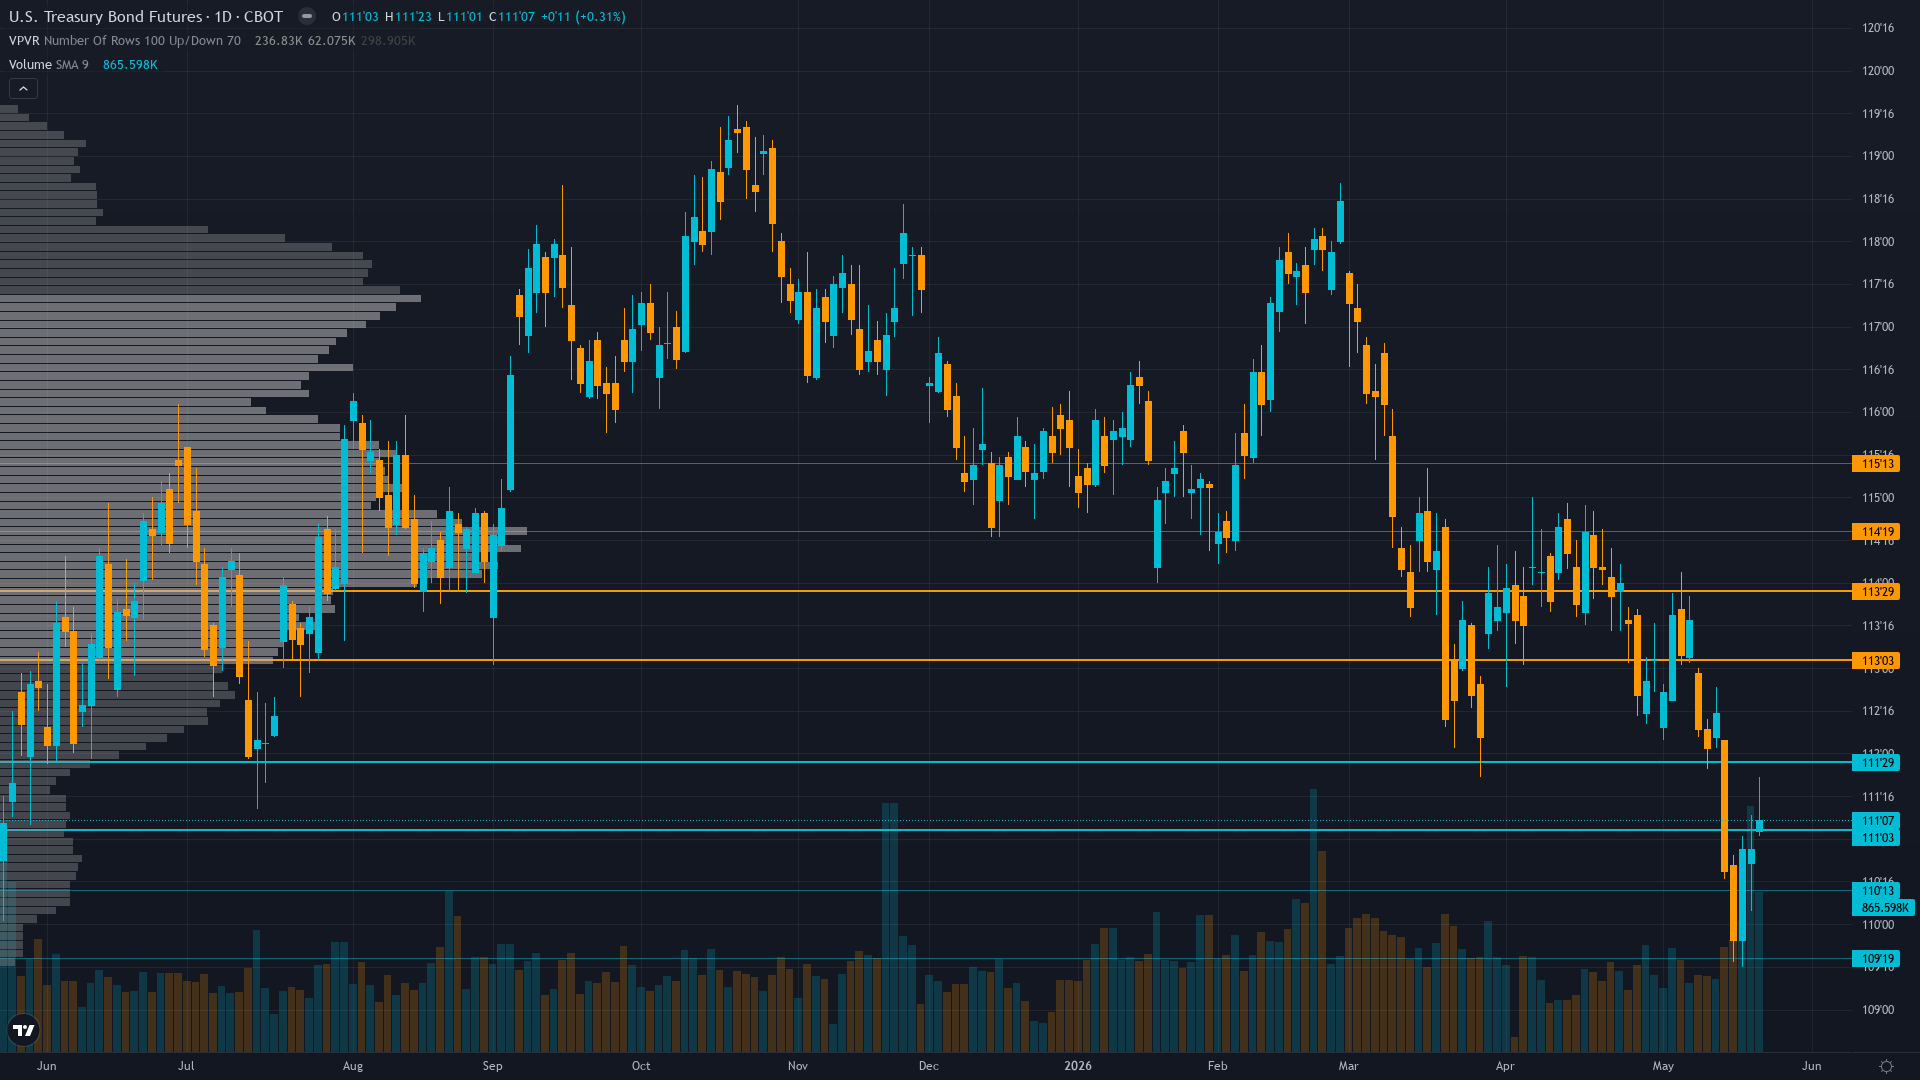
Trading at 110.875 after a 1.02% move higher, 30-year Treasury continues to attract buying interest.
Speculative positioning showing modest net short unwinding per May 19 COT with leveraged funds reducing long exposure; Treasury auction demand deteriorated with bid-to-cover declining from 2.45 March to 2.13 May 2026 signaling weakening institutional appetite at lower price levels; TIC February data showing $184.5B inflows provides baseline foreign support offset by persistent fiscal pressure
Market Consensus vs Our Analysis
Market consensus: Market pricing Fed on hold through mid-2026 with 40% probability of rate hike by December per Trading Economics; bonds consolidating 110-114 range awaiting June employment and CPI clarity on whether April inflation spike represents trend reversal or transitory energy-driven outlier
Primary driver: Downtrend consolidation at 110-112 range after violent May 15-22 breakdown from 113.56 to 111.53 validated bearish repricing thesis with no fresh catalyst this week creating low-information environment where MOVE volatility at 78.43 remains elevated yet stable suggesting continued structural pressure from FY2026 deficit at $2.0-2.1T maintaining supply headwind
Contrarian Assessment
Desk bearish lean aligns with market structural bearish positioning from Fed terminal rate near 3% and recent -0.69% weekly decline; directional divergence minimal as consensus broadly defensive matches desk assessment; conviction proportional to uncertainty with low-information void until June catalysts limiting edge beyond widely-recognized fiscal supply pressure and April CPI shock already priced
Sentiment & Positioning
Sentiment around Treasury bond futures is neutral, with no extreme positioning on either side. This balanced state often resolves when a catalyst breaks the equilibrium.
Options Market Signal
MOVE Index at 78.43 down 2.23% in 24 hours but up 13.50% weekly and 17.40% monthly from compressed regime signals elevated volatility that has stabilized at moderately elevated levels; current reading above historical median creates modest mean reversion setup yet insufficient for directional conviction given stabilization pattern
Putting It Together
In summary, the positioning picture for 30-year Treasury reflects neutral conviction levels set against a consolidating within downtrend structure market backdrop. Trend strength registers just 3/10, which typically corresponds to choppy, directionless price action. The interplay between smart money activity, retail sentiment, and options market signals will shape how this positioning resolves.
This analysis covers one dimension. Our full weekly report combines six specialist agents into a single actionable briefing with directional bias, key levels, and risk-opportunity matrix.
Start Free — Get the Market of the WeekFree weekly report · No credit card · Upgrade anytime