30-Year Treasury COT & Institutional Positioning — Smart Money Analysis
30-Year Treasury institutional positioning: COT data, sentiment analysis and smart money flow assessment.

Smart Money Positioning
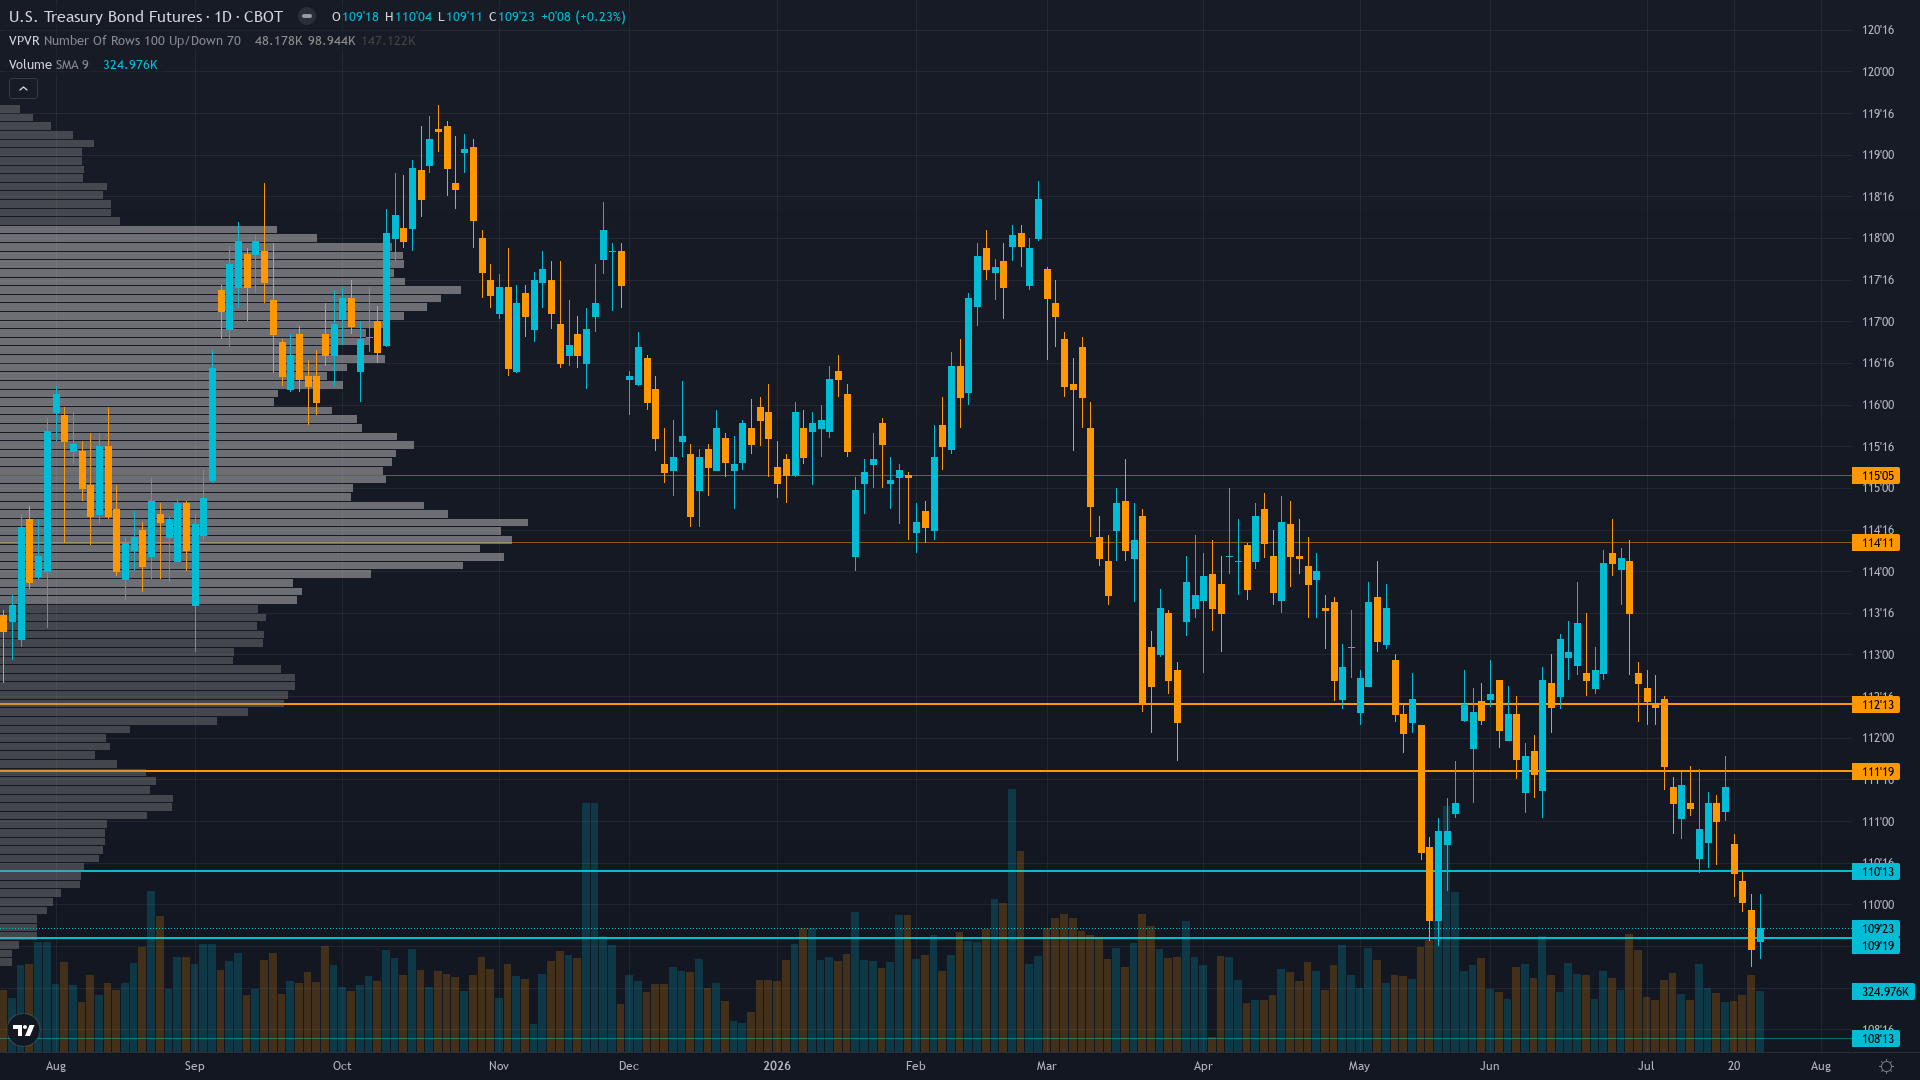
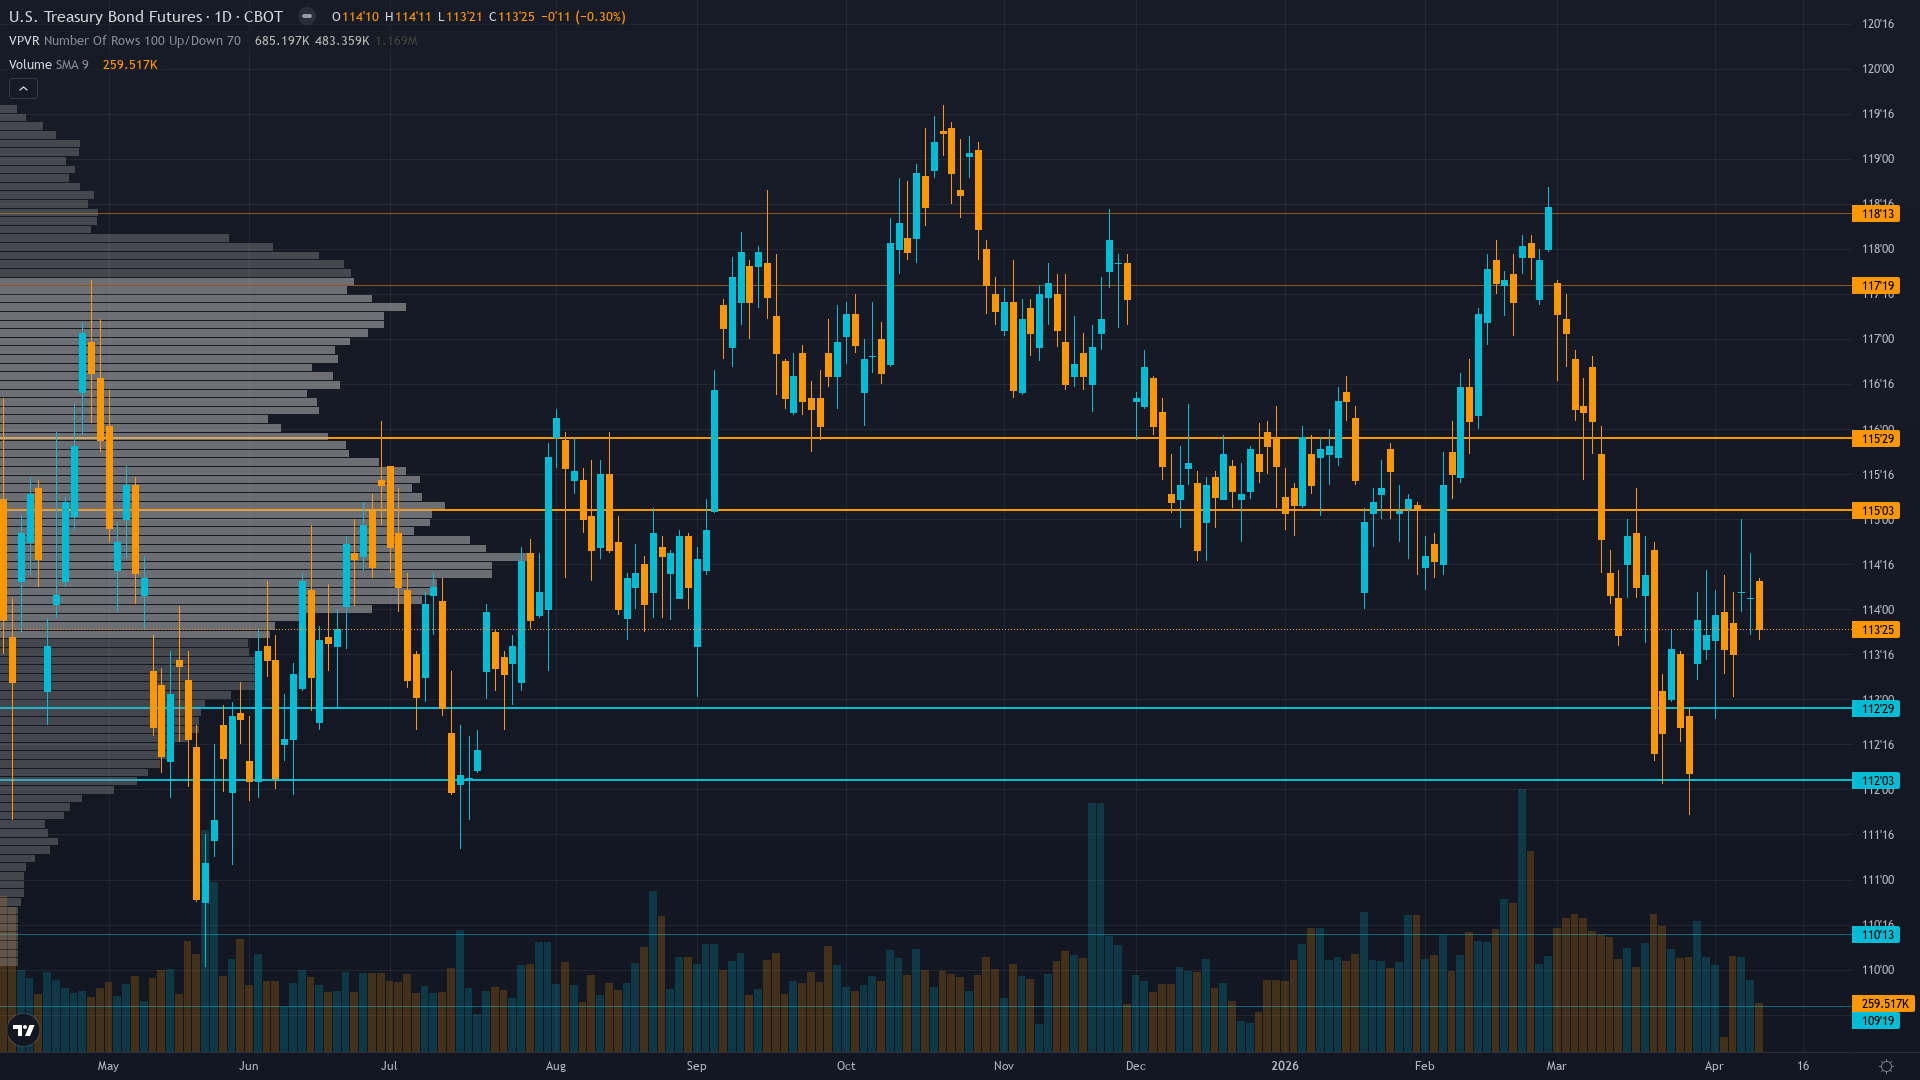
30-year Treasury sits at 114 after slipping 0.14% — a shallow pullback rather than a decisive move.
Limited current visibility with stale March 31 COT data; defensive positioning evident from recent rotation signals though magnitude unclear
Consensus Check
Market consensus: Market pricing Fed on hold through May with shallow easing trajectory through 2026-27; bonds consolidating 112-118 range awaiting clarity on whether March CPI spike was Iran-driven anomaly or structural inflation resurgence
Primary driver: March CPI shock to 3.3% from 2.4% creating hawkish repricing environment with Fed May 6-7 FOMC priced at 85% hold probability while structural deficit pressure persists at $1.2T H1 FY2026
Divergence Assessment
Desk maintains moderate bearish lean consistent with recent price action and consensus structural view from Fed terminal rate near 3%; directional divergence low as market positioning broadly defensive matches desk assessment; conviction proportional to uncertainty with low-information void until May FOMC limiting edge beyond widely-recognized fiscal supply pressure and March data ambiguity
Market Sentiment
The sentiment picture for Treasury bond futures is evenly split, providing no contrarian signal in either direction. The next move will likely be event-driven.
What Options Markets Show
MOVE at 72.15 down 20% weekly represents sharp volatility compression from 90+ levels creating potential mean reversion setup though current calm suggests reduced hedging demand into May FOMC
Positioning Summary
Putting the positioning picture together for ZB futures: sentiment is neutral transitioning from fear, trend strength registers just 3/10, which typically corresponds to choppy, directionless price action. The net assessment from institutional data, crowd positioning, and derivatives activity points to a market where the balance of forces tilts in a discernible direction.
This analysis covers one dimension. Our full weekly report combines six specialist agents into a single actionable briefing with directional bias, key levels, and risk-opportunity matrix.
Start Free — Get the Market of the WeekFree weekly report · No credit card · Upgrade anytime