30-Year Treasury COT & Institutional Positioning — Smart Money Analysis
30-Year Treasury institutional positioning: COT data, sentiment analysis and smart money flow assessment.

The Institutional Landscape
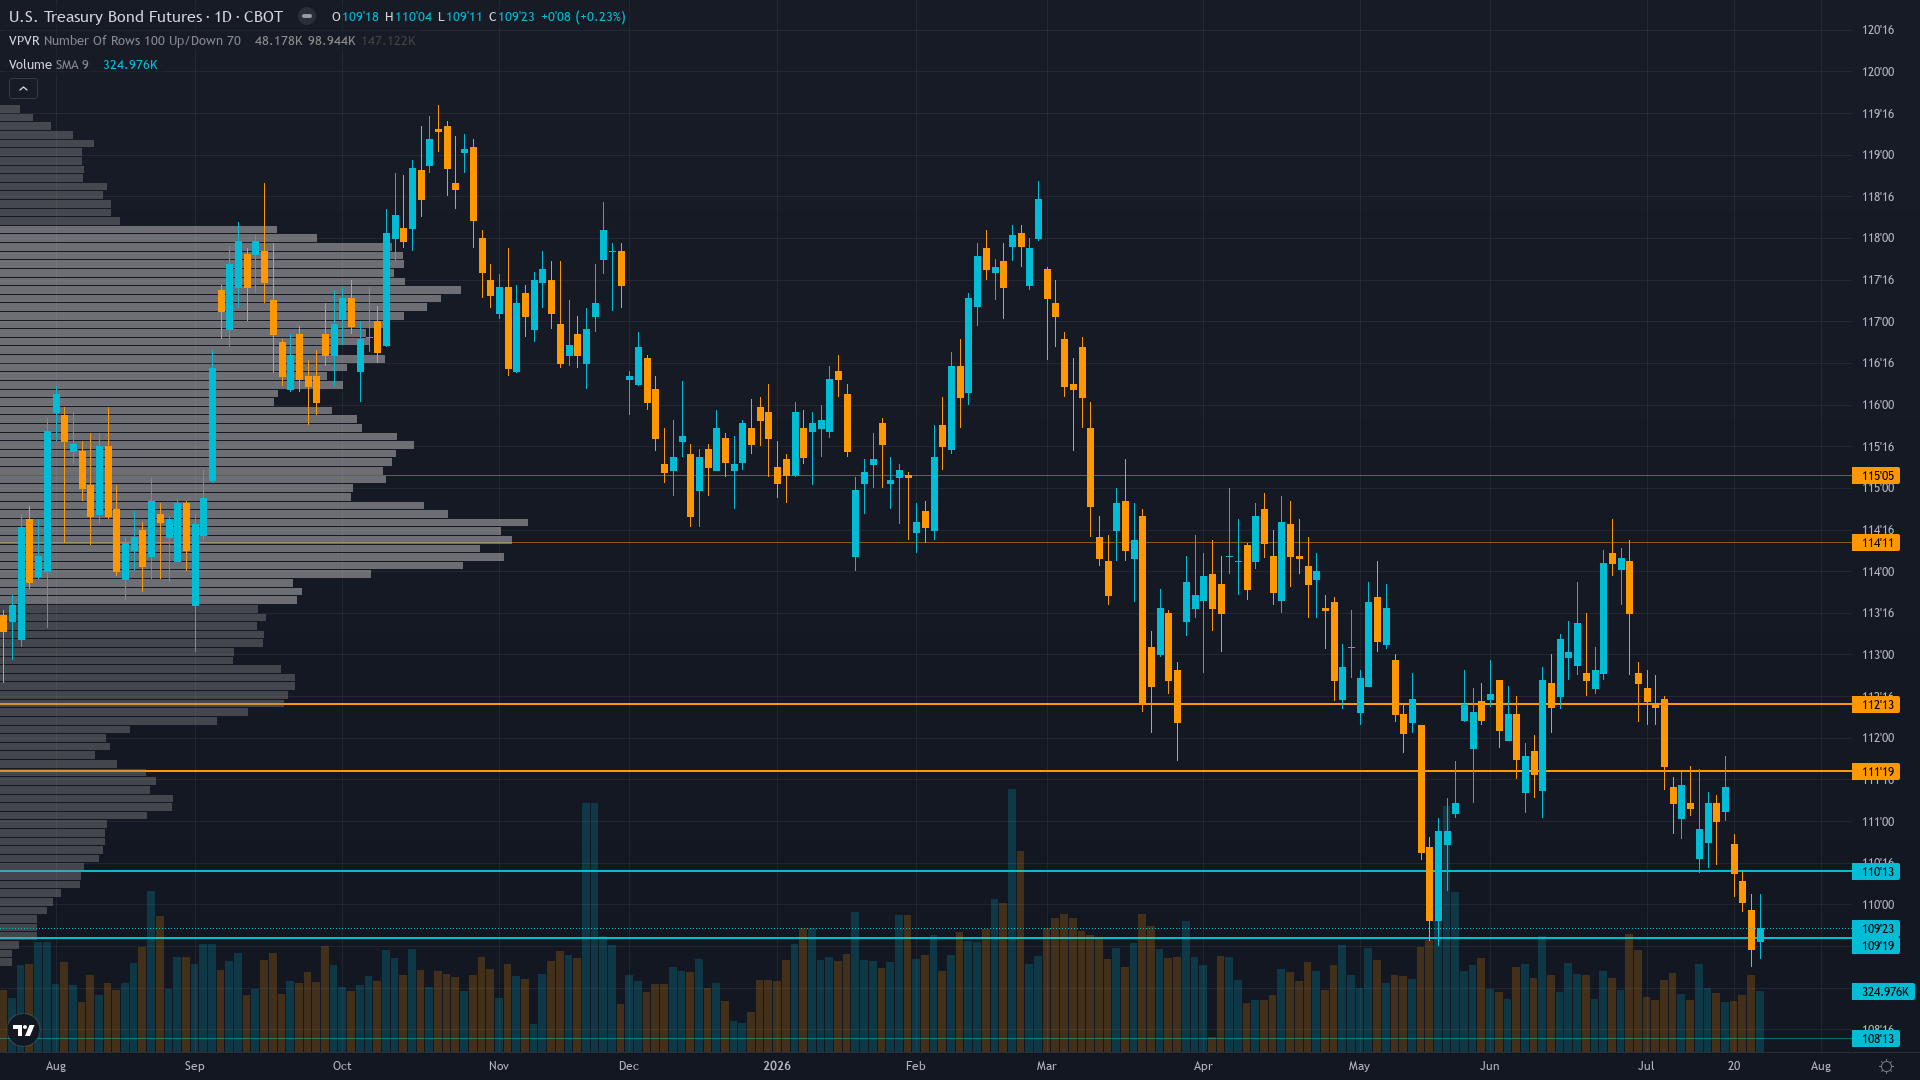
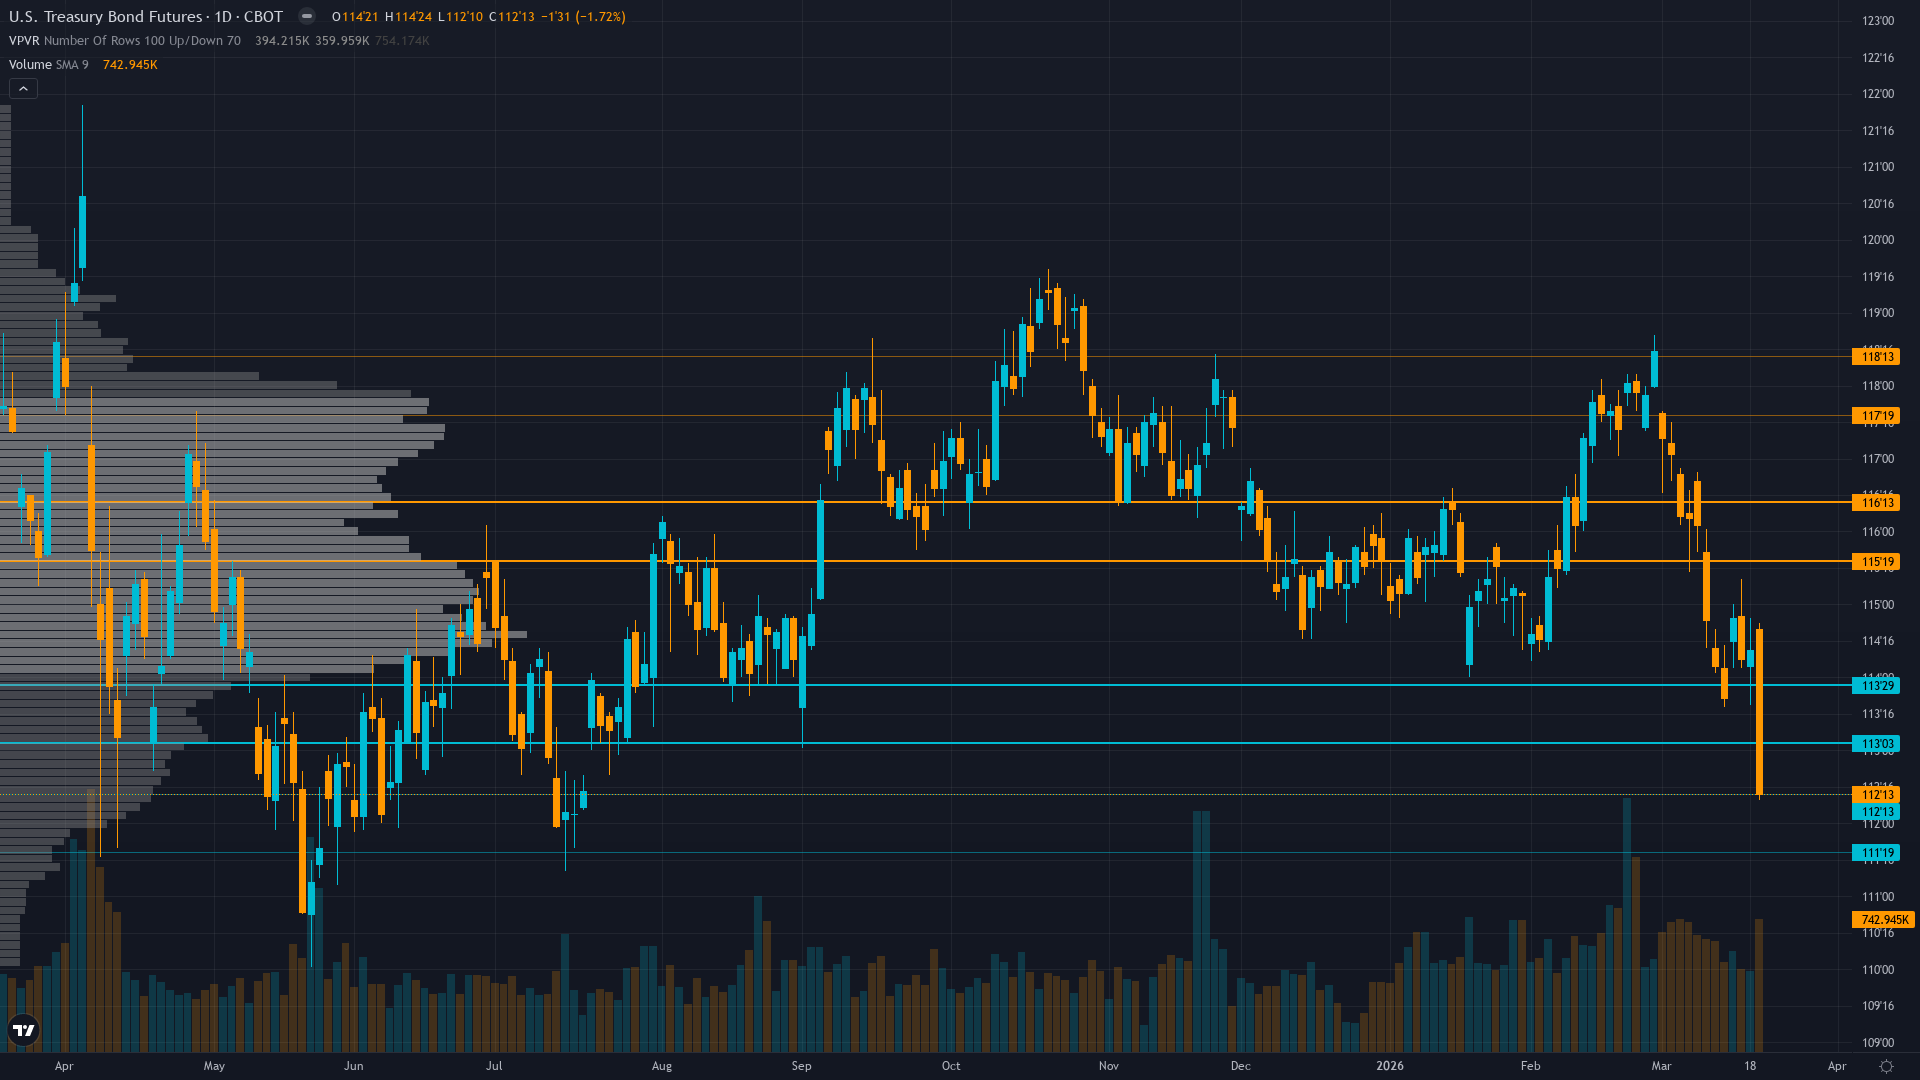
Trading at 114.09 with a 0.05% uptick, 30-year Treasury is drifting higher without strong conviction.
Defensive deleveraging with modest net short COT positioning mid-range; Fed shifting reinvestment to T-bills March 18 removes structural bid from long duration; quarter-end rebalancing 9 days away
Market Consensus vs Our Analysis
Market consensus: Market pricing Fed on hold through May with only shallow additional easing through 2027; bonds consolidating 112-118 range awaiting Iran war resolution and April economic data clarity on labor-inflation tradeoff
Primary driver: Iran war creating maximum policy uncertainty with Fed held March 18 at 3.50-3.75% unable to ease despite weak labor (Feb NFP -92k) due to sticky inflation (core 2.5% YoY) and geopolitical energy-driven inflation risk pushing yields higher
Contrarian Assessment
Desk bearish lean aligns with consensus structural view and recent price action; directional divergence low as market pricing Fed on hold matches desk assessment; conviction asymmetry minimal as desk at 5/10 reflects proportional uncertainty to consensus caution; blindspot identification moderate as MOVE expansion and quarter-end rebalancing factors now widely recognized post-March 18 FOMC
Sentiment & Positioning
Sentiment around Treasury bond futures is neutral, with no extreme positioning on either side. This balanced state often resolves when a catalyst breaks the equilibrium.
Options Market Signal
MOVE at 108.84 up 58% from compressed lows signals violent volatility expansion finally arriving; ZB options thin with limited directional signal but MOVE spike confirms binary risk environment ahead
Putting It Together
In summary, the positioning picture for 30-year Treasury reflects fear conviction levels set against a consolidating within breakdown structure market backdrop. Trend strength registers just 3/10, which typically corresponds to choppy, directionless price action. The interplay between smart money activity, retail sentiment, and options market signals will shape how this positioning resolves.
This analysis covers one dimension. Our full weekly report combines six specialist agents into a single actionable briefing with directional bias, key levels, and risk-opportunity matrix.
Start Free — Get the Market of the WeekFree weekly report · No credit card · Upgrade anytime