Copper (HG) — Structural supply crisis from Grasberg mine disaster removing 525,000-600,000…
Copper rallied to record highs on supply concerns with elevated prices expected into 2026 but near-term consolidation likely as market digests extraordinary gains, COMEX inventory surge to 503,000 mt, and China January PMI contraction to 49.3

Copper rallied to record highs on supply concerns with elevated prices expected into 2026 but near-term consolidation likely as market digests extraordinary gains, COMEX inventory surge to 503,000 mt, and China January PMI contraction to 49.3
Structural supply crisis from Grasberg mine disaster removing 525,000-600,000 tons through 2026 creating acute global shortage despite recent volatility from record highs
US dollar weakness at DXY 97.15 down 10% year-over-year removing primary macro headwind that suppressed prices through late 2025
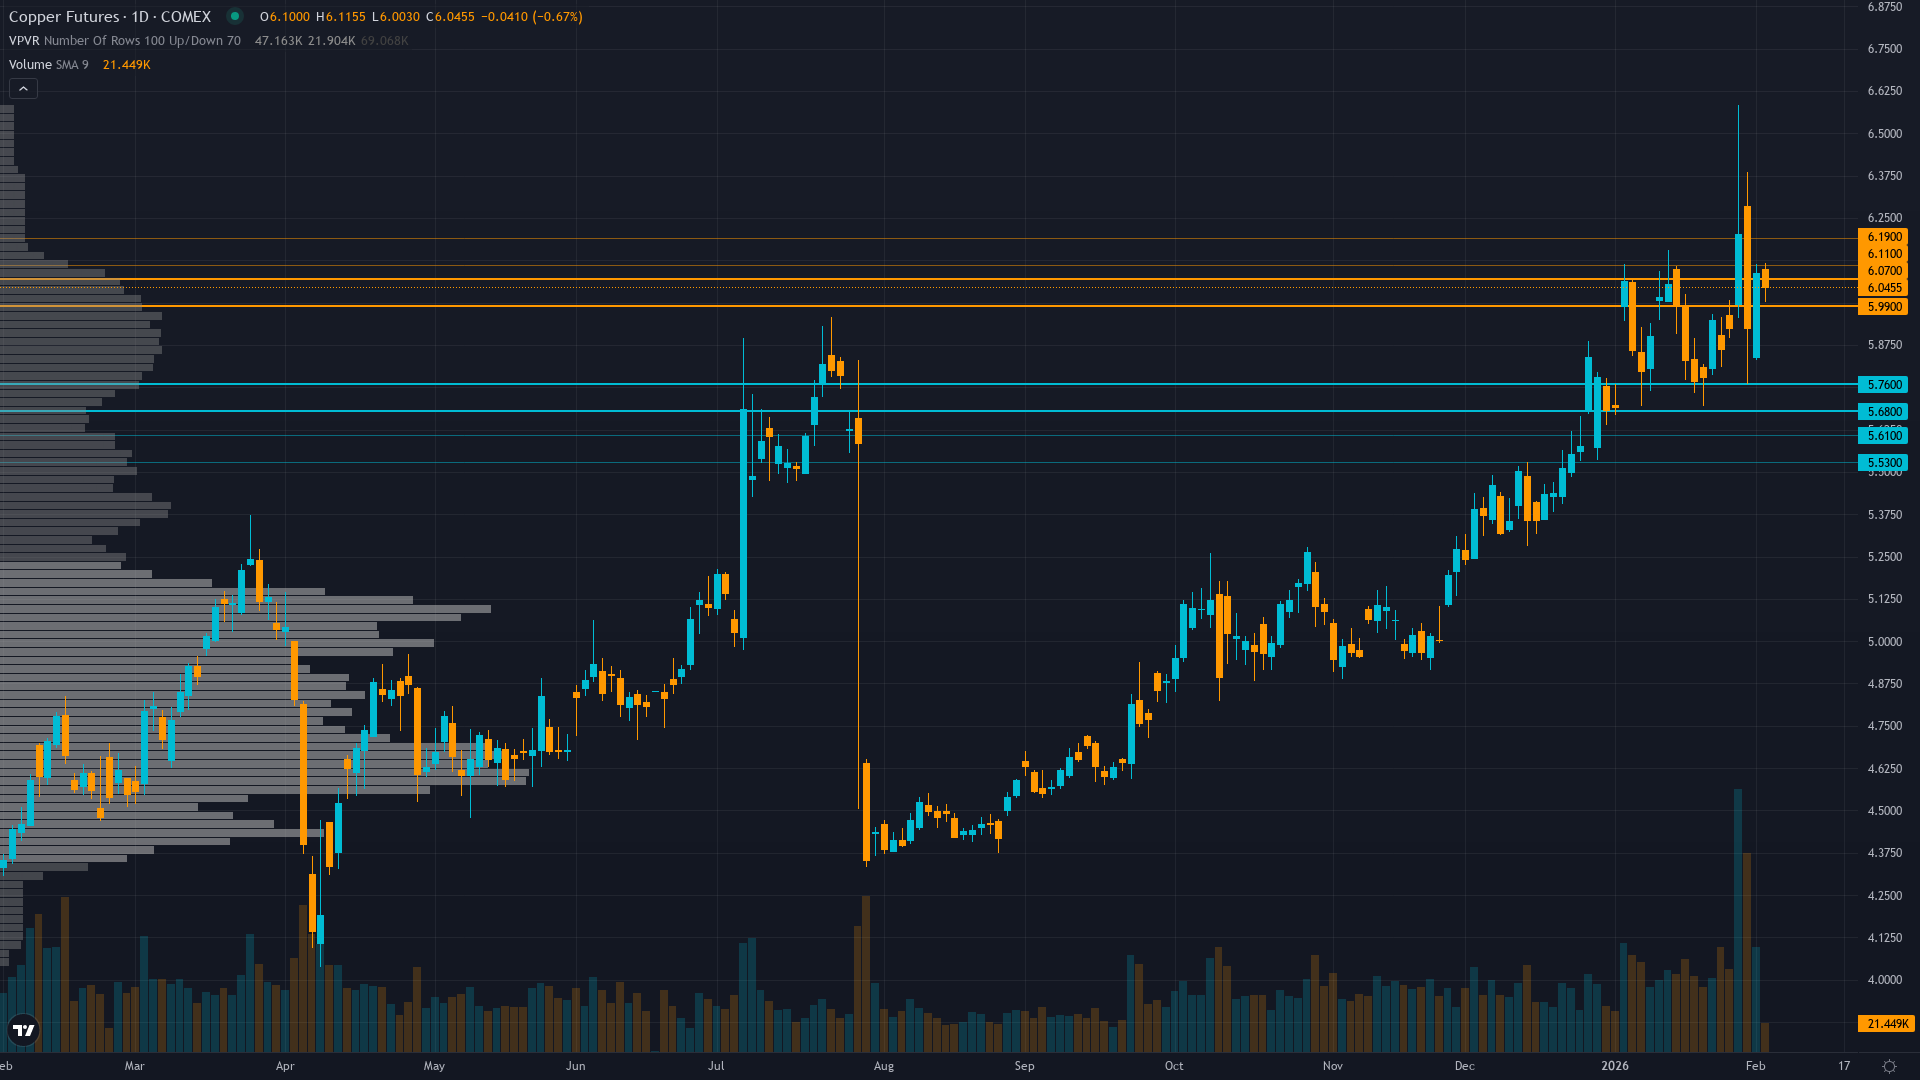
January record high at $6.15/lb on January 14 followed by 5.2% pullback reflecting consolidation within structurally bullish supply crisis as COMEX inventories surge to 503,000 mt from tariff-related stockpiling creates false abundance signal
| ▲ Resistance Zone 2 | 6.070 – 6.230 |
| ▲ Resistance Zone 1 | 5.950 – 6.110 |
| ─ Pivot Area | ~5.830 |
| ▼ Support Zone 1 | 5.640 – 5.800 |
| ▼ Support Zone 2 | 5.490 – 5.650 |
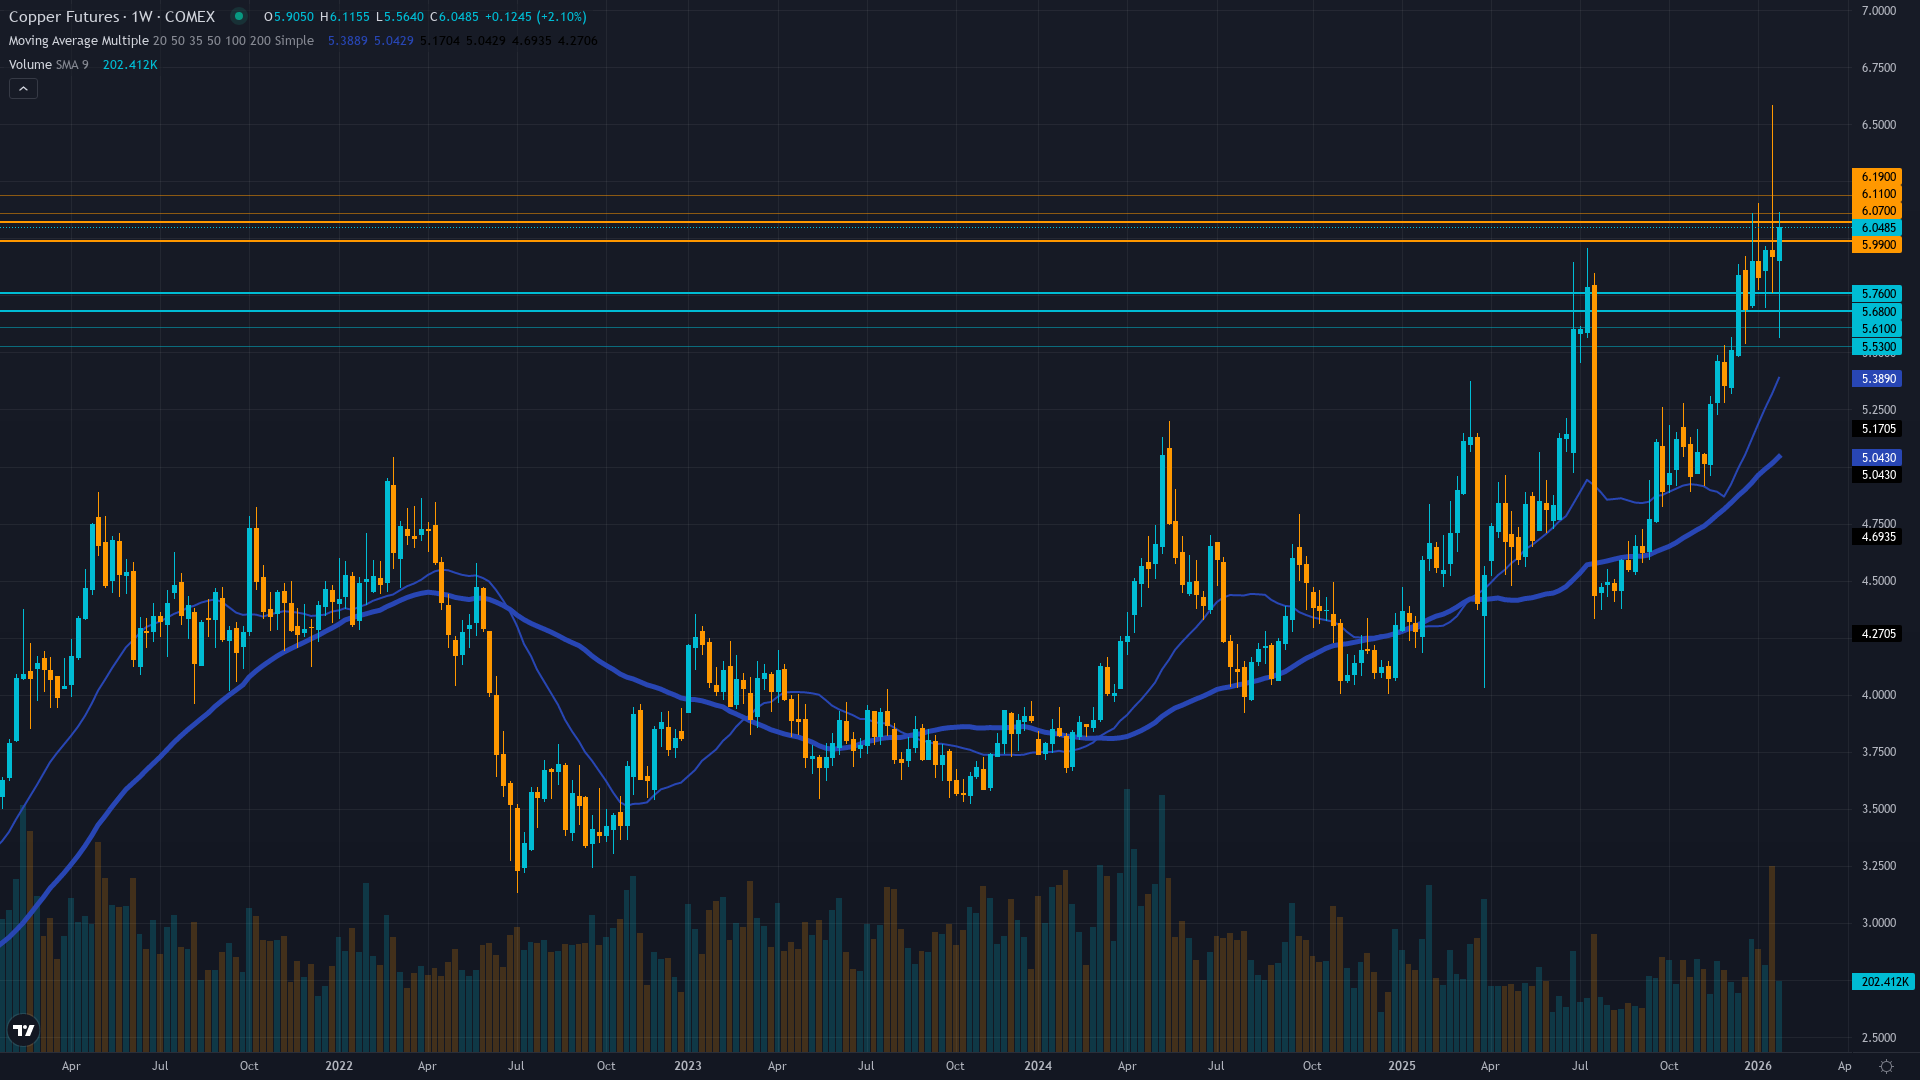
Consolidating from January 14 all-time high of $6.15/lb after 35% year-over-year rally, holding above critical $5.72 support with 52-week range $4.03-$6.15 placing current levels at 84th percentile
Acute structural supply shortage from Grasberg 525,000-600,000 ton loss through Q2 2026, China production -4.5%, China January manufacturing PMI 49.3 contractionary but refined copper production growing 7.5-12% in 2025 creating deficit now not mid-2026
Caught underweight during late 2025 breakout, recent profit-taking from January 14 record highs but remaining structurally light relative to supply fundamentals creating robust support floor
Implied volatility elevated at 60-65th percentile reflecting consolidation near record highs with neutral positioning after January breakout spike, call skew remains constructive on supply narrative
China January manufacturing PMI fell to 49.3 from 50.1 in December showing contraction, but refined copper production expected to grow 7.5-12% in 2025 reaching record highs above 13.64 million tonnes, DXY at 97.15 down 10% YoY removing commodity headwind, Fed on hold after December 2025 hawkish cut
Normal - volatility normalized from January 14 record-high spike to 63rd percentile, suggesting controlled consolidation rather than distribution with term structure flat indicating market acceptance of new regime
When copper consolidates near record highs with normalized volatility at 60-65th percentile, historical data shows 70% continuation rate over following 4-6 weeks with average further appreciation of 8-12% when supply fundamentals remain supportive and seasonal patterns align favorably as currently configured
Volatility normalized from 78th percentile peaks in mid-January to current 63rd percentile, consolidation phase mature and ready for next directional move within 3-7 trading days, particularly around February 15 China catalyst
Current volatility suggests daily ranges of 2-3% versus normal 1.5-2%, record high consolidation showing controlled price action rather than blow-off top characteristics with tightening intraday ranges indicating digestion phase nearing completion ahead of catalyst event, supply-driven rallies historically more sustainable than monetary-driven moves
Normalized volatility at record highs suggests 10-15% move potential from current $5.83 level over next 4-6 weeks versus typical 6-8%, with February-March seasonal strength (80% hit rate historically) and Q1 restocking demand supporting upside bias toward $6.50-7.00 psychological levels representing 12-20% gain, while downside risk to $5.57 major support represents 4.5% decline creating favorable 2.7:1 risk-reward at current levels with supply fundamentals and seasonality providing robust floor entering critical China catalyst window
|
⚠️ Primary Risk
COMEX inventory surge to 503,000 mt from tariff-related stockpiling creating false abundance signal while China January PMI 49.3 contraction triggers extended demand destruction narrative and profit-taking from elevated all-time high levels Probability: MEDIUM
|
✦ Primary Opportunity
Supply crisis fundamentals reassert dominance as Grasberg remains offline through Q2 2026 and February-March seasonal strength historically supporting 80% success rate driving breakout through January 14 record high of $6.15/lb toward $6.50-7.00 as deficit reality forces structural repricing Timeframe: 2-8 weeks as January-February seasonal strength materializes, China data validates demand resilience despite PMI weakness, and Q1 2026 restocking demand emerges
|
Copper stands at a pivotal inflection point on February 1, 2026, trading at $5.83/lb after a spectacular 35% year-over-year rally that saw the metal surge to an all-time record of $6.15/lb on January 14 before consolidating 5.2% over the past 18 days. The market has undergone fundamental repricing as converging supply disruptions materialized 6-12 months ahead of consensus expectations. The September 8, 2025 Grasberg mine mudslide in Indonesia—the world's second-largest copper mine—removed an estimated 525,000-600,000 metric tons from global supply with the underground mine expected to remain closed until Q2 2026.
This catastrophic event compounds China's unprecedented 4.5% September 2025 production decline and 929,000 tonnes lost to global mine disruptions in 2025. Goldman Sachs raised its 2026 deficit forecast from 72,000 tons to 400,000 tons, though this dramatically understates immediate impact. The current consolidation reflects a critical tension between structural supply deficit fundamentals and near-term headwinds. On January 31, 2026 (yesterday), China's January manufacturing PMI fell to 49.3 from 50.1 in December, dropping into contractionary territory and marking the eighth consecutive month below 50.
However, this macro data obscures underlying copper demand resilience: China's refined copper production is expected to grow 7.5-12% in 2025 reaching record highs above 13.64 million tonnes despite feedstock shortages, while industrial output remains supported by EV production and high-tech manufacturing—both copper-intensive sectors. A significant complication has emerged: COMEX inventories surged to over 503,000 mt from less than 100,000 mt a year ago as traders rushed metal into the US ahead of potential 2026 tariff implementation, creating a false abundance signal that analysts warn doesn't reflect true market tightness.
This inventory overhang contrasts sharply with LME stocks which remain critically low. The dollar provides crucial tailwind—at DXY 97.15 on February 1, down 10% year-over-year—removing the primary macro headwind that capped copper through portions of 2025. February-March seasonality strongly favors copper with historical patterns showing this period supports 80% success rate for Q1 rallies driven by construction sector restocking. Volatility has normalized to 60-65th percentile from January record-high spikes, suggesting controlled consolidation rather than distribution.
The 52-week range of $4.03-$6.15 places current levels at the 84th percentile. The critical question: Will COMEX inventory overhang and China PMI contraction override structural supply deficit reality? The supply crisis fundamentals haven't changed—with Grasberg offline through mid-2026, China production constrained, and energy transition demand providing a floor, the market faces acute shortage consensus underestimates. Trading Economics reported on January 30 that copper surged over 10% to a record high of $6.50 per pound before trimming gains, reflecting extreme volatility.
The edge lies in recognizing that recent consolidation represents healthy digestion within a structurally bullish supply crisis, with favorable January-February seasonality, resilient China manufacturing data despite PMI weakness, and persistent supply deficits creating compelling continuation setup establishing 2026 trajectory toward $6.50-7.00 psychological targets.
| Week | Bias | Confidence |
|---|---|---|
| February 1, 2026 | BULLISH | 8/10 |
| January 25, 2026 | BULLISH | 8/10 |
| January 18, 2026 | BULLISH | 8/10 |
| January 11, 2026 | BULLISH | 8/10 |
| January 4, 2026 | BULLISH | 8/10 |
| December 28, 2025 | BULLISH | 9/10 |
| December 21, 2025 | BULLISH | 8/10 |
| December 14, 2025 | BULLISH | 8/10 |
| December 7, 2025 | BULLISH | 8/10 |
| November 30, 2025 | BULLISH | 9/10 |
| November 23, 2025 | BULLISH | 8/10 |
| November 16, 2025 | BULLISH | 8/10 |


