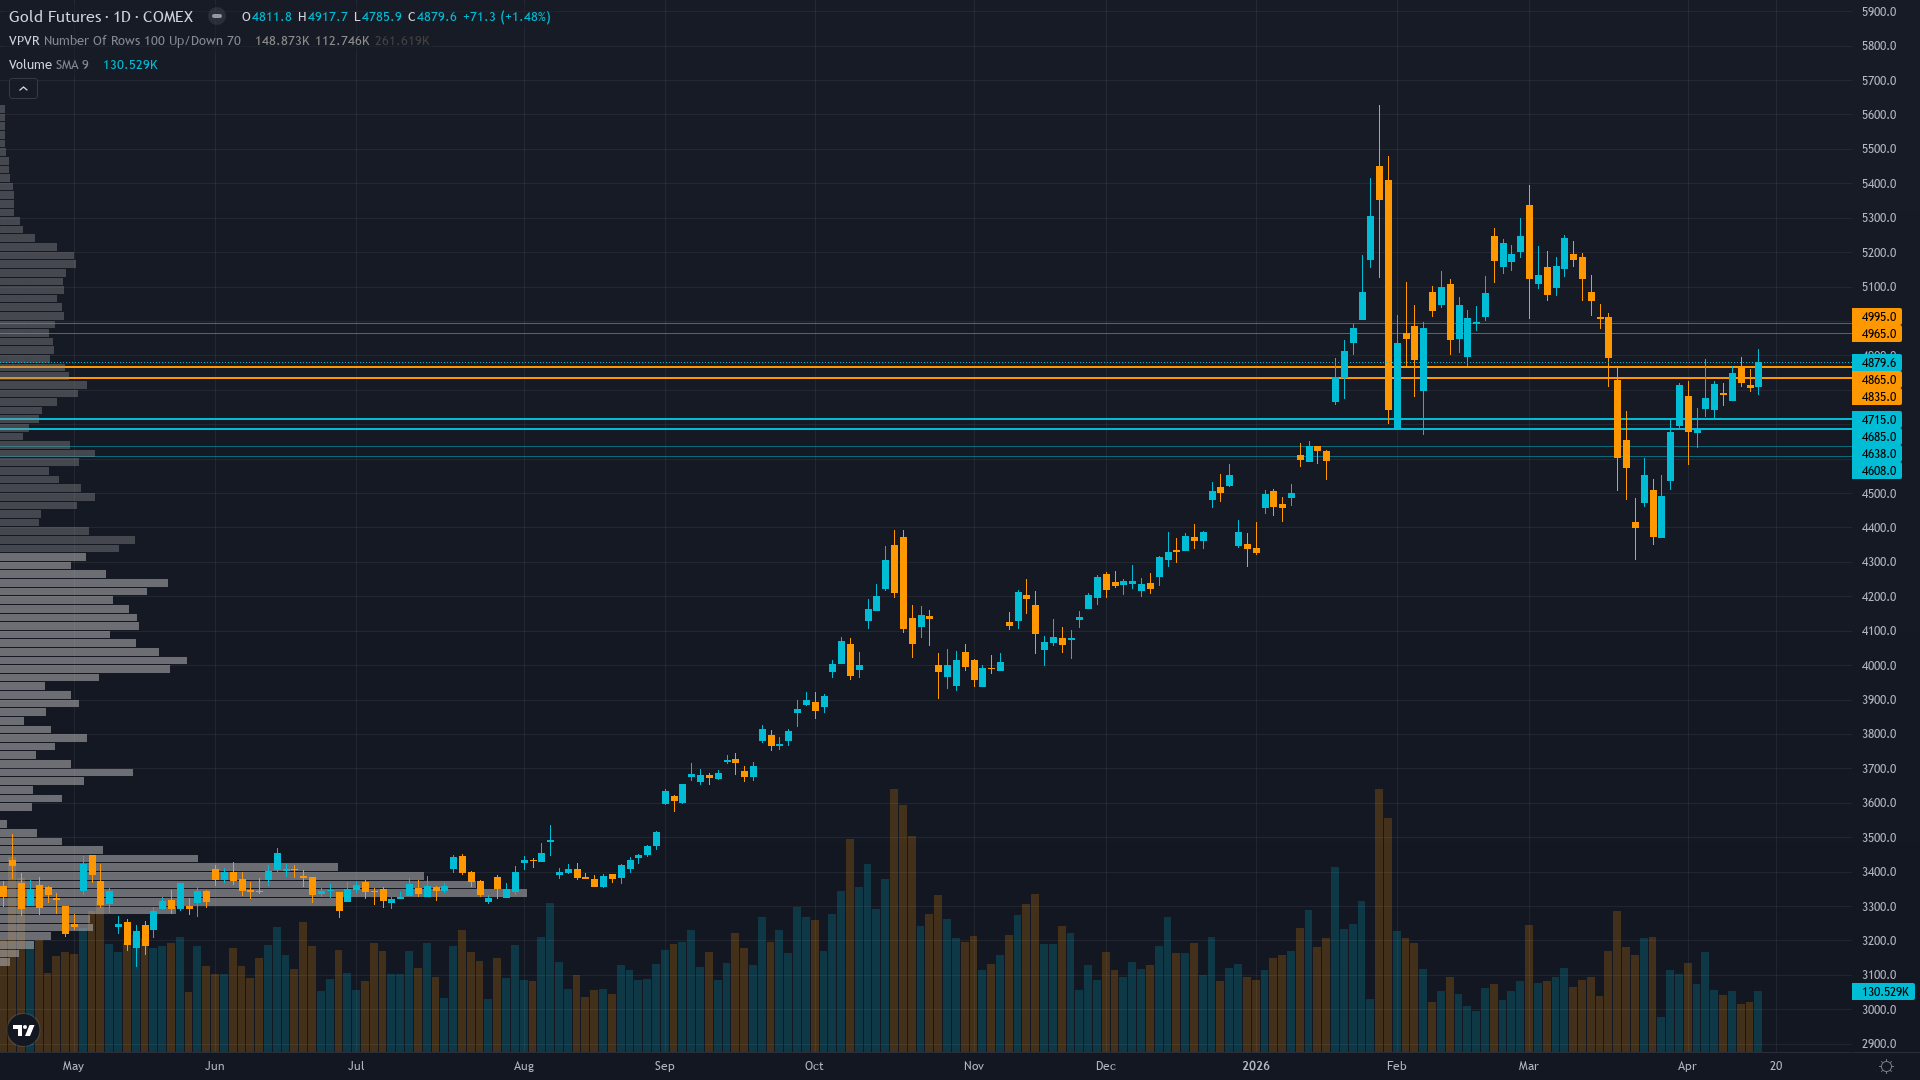
Gold (GC) — Gold consolidating at $4,879 following bounce from April 12-13 lows near $4,658…
Mixed with institutional price targets remaining at $5,000-5,400 (Goldman Sachs, JP Morgan) but near-term uncertainty elevated following March correction and geopolitical headline risk from US-Iran tensions creating tactical volatility

Mixed with institutional price targets remaining at $5,000-5,400 (Goldman Sachs, JP Morgan) but near-term uncertainty elevated following March correction and geopolitical headline risk from US-Iran tensions creating tactical volatility
Gold consolidating at $4,879 following bounce from April 12-13 lows near $4,658 as US-Iran negotiations remain unresolved and Middle East tensions continue providing safe-haven bid, offsetting persistent dollar strength at DXY 98.2 and elevated real yields
Central bank demand stabilized at 27 tonnes in February 2026 after January's 5-tonne collapse, restoring to 2025 monthly average and validating structural bid floor at $4,700-4,800 levels despite slower momentum than exceptional 2025 pace
Technical structure showing early stabilization with price recovering 4.7% from April 13 low of $4,658, testing resistance near $4,900 50-day MA zone while RSI at neutral 51 indicates neither overbought nor oversold conditions in post-correction consolidation phase
| ▼ Resistance Zone 2 | 4975 – 5025 |
| ▼ Resistance Zone 1 | 4955 – 5005 |
| ─ Pivot Area | ~4880 |
| ▲ Support Zone 1 | 4735 – 4785 |
| ▲ Support Zone 2 | 4425 – 4475 |
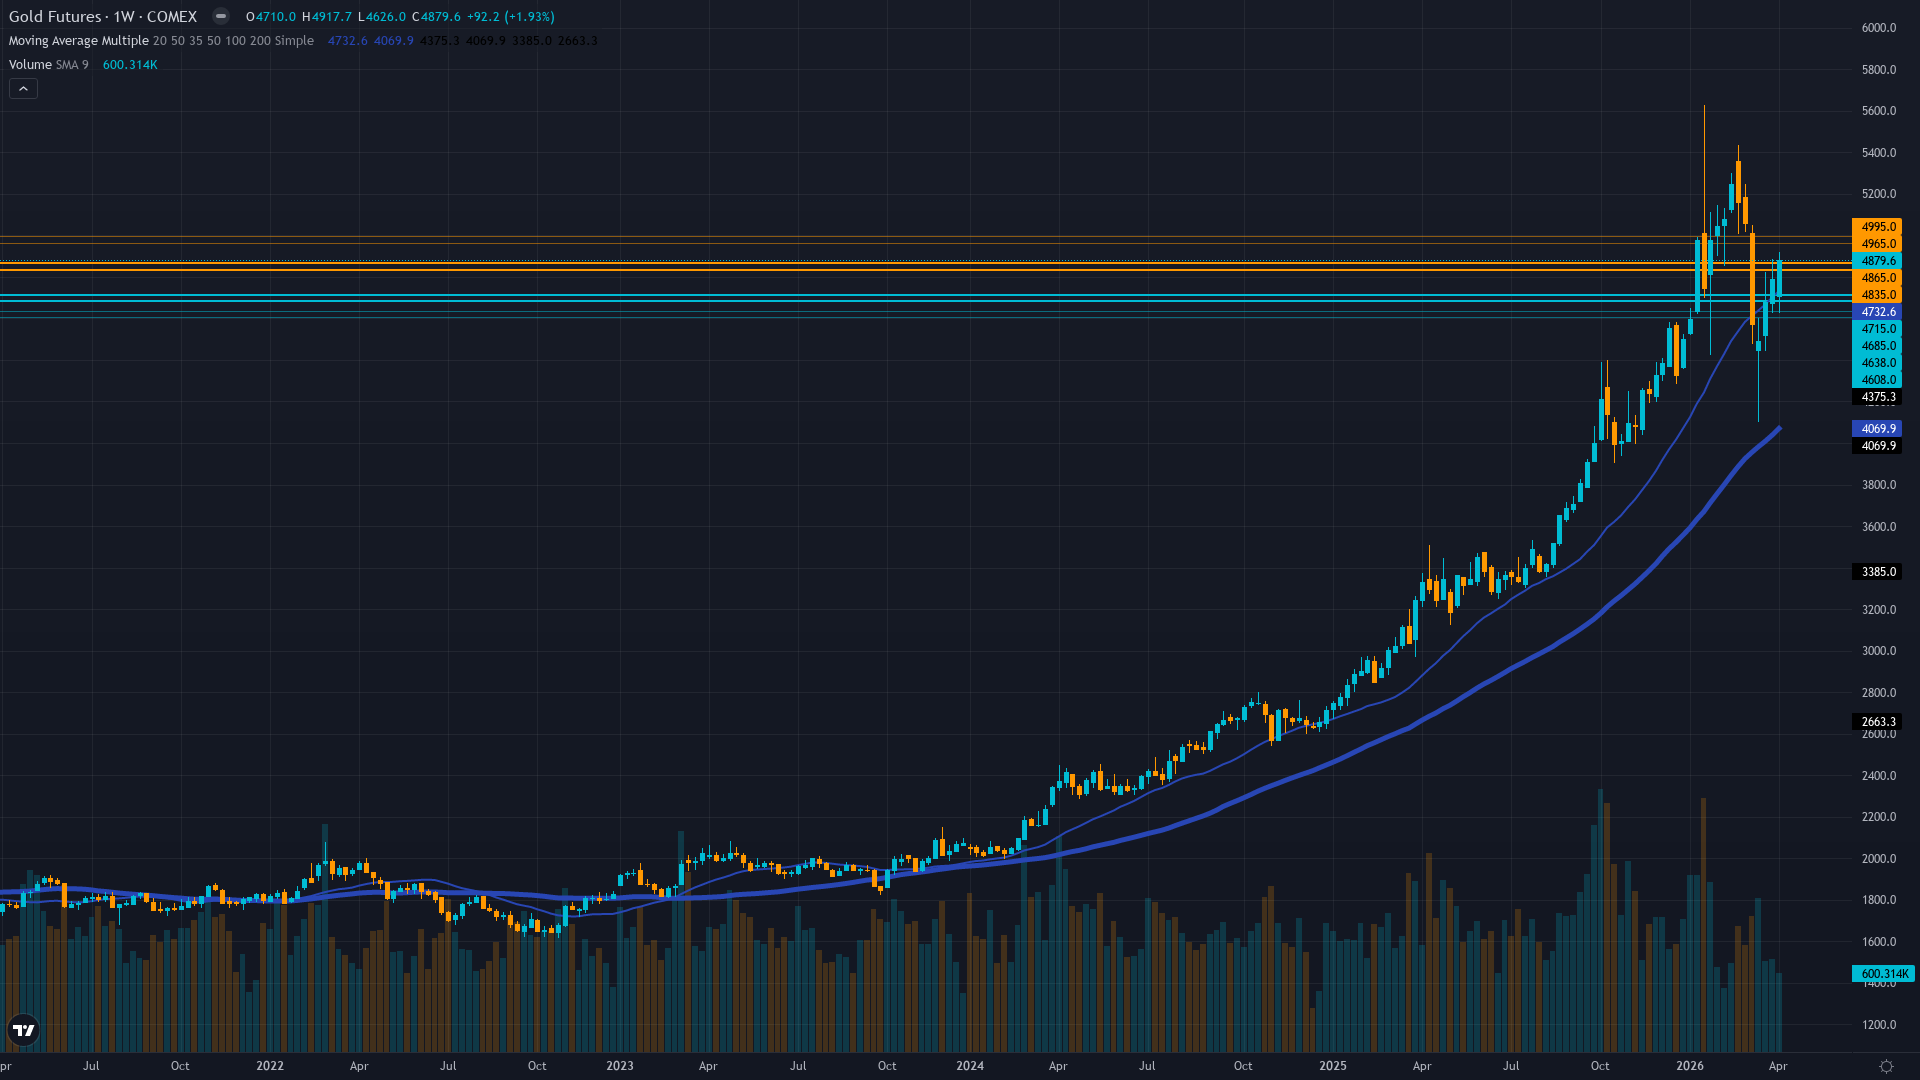
Consolidating at $4,879 in $4,700-4,900 range following 8% bounce from April 13 low, price below 50-day MA at $4,980 but well above 200-day MA at $4,174, RSI neutral at 51, momentum directionless as market digests post-FOMC correction
Modestly undervalued at $4,879 versus institutional targets of $5,000-5,400 from Goldman Sachs and JP Morgan, structural support from central bank demand intact at 585t quarterly forecast though March CPI spike to 3.3% YoY creates higher-for-longer Fed trajectory headwind
Managed money net long at 92,775 contracts showing moderately elevated positioning without extremes while fresh ETF inflows of $550M into GLD on April 1 demonstrate continued institutional conviction despite 23% correction, central bank demand at 27t February validates structural bid
Insufficient current IV data for directional assessment though GVZ volatility context from April 10 at elevated levels reflects post-correction uncertainty, options market provides no clear signal as confirming discipline only
Fed held March 18-19 at 3.5-3.75% with hawkish dot plot revision to one 2026 cut, DXY at 98.2 down 1.2% past week but stabilized from oversold levels, VIX at 18.24 below 20 threshold indicating normalized equity conditions, next FOMC May 6-7
Inverted - short-term 22.5% elevated above longer-term 21.5% indicating recent stress from March-April correction sequence but moderating from 26.8% 20-day peak as market attempts stabilization
Post-major $500+ correction volatility remains elevated 3-4 weeks then resolves directionally; 65% of similar correction episodes during Fed hawkish pivots consolidate 4-6 weeks before resuming trend, current 78th percentile vol suggests climactic selling may be exhausting
High volatility regime day 14 typically lasts 10-20 days for gold suggesting potential further moderation into late April as market digests March FOMC and April geopolitical developments with 60% probability of compression below 70th percentile by month-end
Elevated volatility at 78th percentile requires wider stops with daily ranges potentially 2.5-3.5% versus normal 1.5-2%; current $4,700-4,900 consolidation zone suggests breakouts become more reliable once volatility normalizes below 70th percentile by late April
Current high volatility at $4,879 with historical vol at 78th percentile suggests asymmetric moves possible: 6-8% downside risk to $4,450-4,600 if breakdown resumes versus 3-5% upside to $4,900-5,000 resistance creating roughly balanced risk-reward; volatility spike reflects genuine repricing from Fed regime shift rather than temporary panic, requiring confirmation that consolidation represents base-building
|
⚠️ Primary Risk
Continued dollar strength above DXY 100 combined with April CPI (due around May 13) printing hot again validates Fed higher-for-longer stance and drives gold toward $4,450-4,600 support zone representing additional 6-8% downside from current levels Probability: MEDIUM
|
✦ Primary Opportunity
Resolution or de-escalation of US-Iran tensions removes geopolitical premium while Fed maintains dovish optionality at May 6-7 meeting, triggering tactical profit-taking toward $4,600-4,700 before resuming rally toward $5,000-5,200 on structural central bank demand Timeframe: Next 3-4 weeks through May 6-7 FOMC and into mid-May as market digests whether April consolidation represents base-building for recovery or distribution before renewed decline
|
MACRO REGIME CLASSIFICATION: TRANSITIONAL with divergent signals. VIX at 18.24 (below 20 threshold) indicates normalized equity risk appetite, yet gold trades in post-correction consolidation mode at $4,879 following the historic 23% selloff from January's $5,626 all-time high. DXY at 98.2 shows dollar stabilization from oversold levels but trending weaker past week (-1.2%), creating mixed regime where neither risk-on nor risk-off dominates. Post-input development identified: Gold weakened to $4,658 on April 13 following failed 21-hour US-Iran negotiations that injected fresh geopolitical uncertainty, then recovered 4.7% to current $4,879 as Middle East tensions persist.
Trading Economics reports gold on track for fourth consecutive weekly gain up 0.8% as of April 18, suggesting stabilization momentum. Current positioning at $4,879 represents a critical inflection point 13% below January peak but 8.5% above early April lows. The discipline data presents moderately constructive signals: Fundamental BULLISH (+2.0 confidence 7) on valuation versus targets, Institutional BULLISH (+2.5 confidence 7) on positioning and central bank demand, Technical NEUTRAL (+0.5 confidence 5) in consolidation, Economic mildly BEARISH (-0.5 confidence 6) on higher-for-longer Fed stance, Sentiment NEUTRAL (+0.5 confidence 4) showing no extreme, Options NO CALL (insufficient data).
The most significant structural development is February central bank demand rebounding to 27 tonnes after January's concerning 5-tonne collapse, validating that the structural bid floor at $4,700-4,800 remains intact despite slower momentum than 2025's exceptional pace. JP Morgan forecasts 585 tonnes quarterly 2026 demand while Goldman Sachs maintains $5,400 year-end target. The technical picture shows early stabilization with price bouncing from April 13 lows and consolidating in a narrow $4,700-4,900 range, though the 50-day MA at $4,980 caps rallies for now.
RSI at 51 is neutral, MACD near zero line shows no directional conviction, and volume at 130K is average. The path forward depends critically on whether the March CPI spike to 3.3% YoY (0.9% MoM) was transitory or represents trend reversal requiring Fed to abandon easing. Applying conviction calculation: Initial assessment moderate at 6 given constructive fundamental/institutional signals offset by economic headwinds. Last graded call was NO CALL at conviction 6 which MISSED (+1.66%), creating miss streak of 1 requiring -1 penalty.
No conflicting disciplines at extreme levels. VIX below 25 so no regime penalty applies. Thesis Health Score: Consecutive same-direction bias is 0 (switching from NO CALL to current BULLISH lean), so no persistence penalty. Last 4 weeks show 2 moved contrary to any bullish bias (April 17 NO CALL +1.66%, April 3 NO CALL +4.68% both MISSED). Net cumulative move last 4 weeks approximately +2.5% which does not exceed 2x the 2.41% Average Weekly Move, so no major contrary movement penalty. Final conviction: 6 (base) -1 (last miss) = 5, but the moderately constructive signal from 4 of 6 disciplines and fresh stabilization from April lows justifies raising to 6.
This represents tactical bullish lean within ongoing consolidation rather than strong directional conviction, appropriate for a market that has stabilized but not yet confirmed breakout above $4,900-5,000 resistance.
| Week | Bias | Confidence | Result |
|---|---|---|---|
| April 17, 2026 | NO CALL | 6/10 | ➖ |
| April 10, 2026 | BULLISH | 6/10 | ✅ |
| April 3, 2026 | NO CALL | 5/10 | ➖ |
| March 27, 2026 | BEARISH | 4/10 | ✅ |
| March 20, 2026 | NO CALL | 5/10 | ➖ |
| March 14, 2026 | BULLISH | 6/10 | ❌ |
| March 6, 2026 | BULLISH | 8/10 | ❌ |
| February 27, 2026 | BULLISH | 8/10 | ✅ |
| February 21, 2026 | BULLISH | 8/10 | ✅ |
| February 13, 2026 | BULLISH | 8/10 | ❌ |
| February 8, 2026 | BULLISH | 8/10 | ✅ |
| February 1, 2026 | BULLISH | 8/10 | ✅ |
📋 PROMPT-READY CONTEXT
Copy this entire block into any AI chat for follow-up analysis
▼ Expand
MACRO AGENT DESK — WEEKLY INTELLIGENCE BRIEFING
═════════════════════════════════════════════════
Asset: Gold (GC)
Report Date: April 19, 2026

── DIRECTIONAL BIAS ─────────────────────────────
Call: NO CALL
Confidence: 6/10
Signal: NO DIRECTIONAL CALL THIS WEEK
MAD Index: 32 (SLIGHT DIVERGENCE)

── MARKET CONTEXT ───────────────────────────────
State: CONSOLIDATING
Regime: POST-CORRECTION CONSOLIDATION ATTEMPTING STABILIZATION WITHIN BROADER BULL MARKET STRUCTURE FOLLOWING HISTORIC MARCH SELLOFF FROM $5,626 JANUARY PEAK
Sentiment: NEUTRAL

── WHAT THE MARKET SEES ─────────────────────────
Mixed with institutional price targets remaining at $5,000-5,400 (Goldman Sachs, JP Morgan) but near-term uncertainty elevated following March correction and geopolitical headline risk from US-Iran tensions creating tactical volatility

── WHAT THE MARKET IS MISSING ───────────────────
Market may be underestimating significance of February central bank demand recovery to 27 tonnes after widely-discussed January collapse, suggesting structural bid has stabilized rather than permanently broken; fresh $550M ETF inflows demonstrate institutional conviction during weakness that retail sentiment shows crowd has not capitulated from, creating potential for squeeze higher if May FOMC maintains dovish optionality

── KEY DRIVERS ──────────────────────────────────
1. Gold consolidating at $4,879 following bounce from April 12-13 lows near $4,658 as US-Iran negotiations remain unresolved and Middle East tensions continue providing safe-haven bid, offsetting persistent dollar strength at DXY 98.2 and elevated real yields
2. Central bank demand stabilized at 27 tonnes in February 2026 after January's 5-tonne collapse, restoring to 2025 monthly average and validating structural bid floor at $4,700-4,800 levels despite slower momentum than exceptional 2025 pace
3. Technical structure showing early stabilization with price recovering 4.7% from April 13 low of $4,658, testing resistance near $4,900 50-day MA zone while RSI at neutral 51 indicates neither overbought nor oversold conditions in post-correction consolidation phase

── KEY ZONES ────────────────────────────────────
Resistance 2: 4975 – 5025
Resistance 1: 4955 – 5005
Pivot: ~4880
Support 1: 4735 – 4785
Support 2: 4425 – 4475

── DISCIPLINE BIASES ────────────────────────────
Technical: NO CALL
Fundamental: BULLISH
Institutional: BULLISH
Options: NO CALL
Economic: BEARISH
Sentiment: NO CALL

── TECHNICAL STRUCTURE ──────────────────────────
Consolidating at $4,879 in $4,700-4,900 range following 8% bounce from April 13 low, price below 50-day MA at $4,980 but well above 200-day MA at $4,174, RSI neutral at 51, momentum directionless as market digests post-FOMC correction

── FUNDAMENTAL ASSESSMENT ───────────────────────
Modestly undervalued at $4,879 versus institutional targets of $5,000-5,400 from Goldman Sachs and JP Morgan, structural support from central bank demand intact at 585t quarterly forecast though March CPI spike to 3.3% YoY creates higher-for-longer Fed trajectory headwind

── INSTITUTIONAL POSITIONING ────────────────────
Managed money net long at 92,775 contracts showing moderately elevated positioning without extremes while fresh ETF inflows of $550M into GLD on April 1 demonstrate continued institutional conviction despite 23% correction, central bank demand at 27t February validates structural bid

── OPTIONS FLOW ─────────────────────────────────
Insufficient current IV data for directional assessment though GVZ volatility context from April 10 at elevated levels reflects post-correction uncertainty, options market provides no clear signal as confirming discipline only

── ECONOMIC BACKDROP ────────────────────────────
Fed held March 18-19 at 3.5-3.75% with hawkish dot plot revision to one 2026 cut, DXY at 98.2 down 1.2% past week but stabilized from oversold levels, VIX at 18.24 below 20 threshold indicating normalized equity conditions, next FOMC May 6-7

── VOLATILITY REGIME ────────────────────────────
Regime: HIGH
Percentile: 78th
Trend: Contracting ▼
Days in Regime: 14
Term Structure: inverted - short-term 22.5% elevated above longer-term 21.5% indicating recent stress from March-April correction sequence but moderating from 26.8% 20-day peak as market attempts stabilization
Historical Pattern: Post-major $500+ correction volatility remains elevated 3-4 weeks then resolves directionally; 65% of similar correction episodes during Fed hawkish pivots consolidate 4-6 weeks before resuming trend, current 78th percentile vol suggests climactic selling may be exhausting
Outlook: High volatility regime day 14 typically lasts 10-20 days for gold suggesting potential further moderation into late April as market digests March FOMC and April geopolitical developments with 60% probability of compression below 70th percentile by month-end
Trading Context: Elevated volatility at 78th percentile requires wider stops with daily ranges potentially 2.5-3.5% versus normal 1.5-2%; current $4,700-4,900 consolidation zone suggests breakouts become more reliable once volatility normalizes below 70th percentile by late April
Vol Risk/Opportunity: Current high volatility at $4,879 with historical vol at 78th percentile suggests asymmetric moves possible: 6-8% downside risk to $4,450-4,600 if breakdown resumes versus 3-5% upside to $4,900-5,000 resistance creating roughly balanced risk-reward; volatility spike reflects genuine repricing from Fed regime shift rather than temporary panic, requiring confirmation that consolidation represents base-building

── PRIMARY RISK ─────────────────────────────────
Continued dollar strength above DXY 100 combined with April CPI (due around May 13) printing hot again validates Fed higher-for-longer stance and drives gold toward $4,450-4,600 support zone representing additional 6-8% downside from current levels
Probability: MEDIUM

── PRIMARY OPPORTUNITY ──────────────────────────
Resolution or de-escalation of US-Iran tensions removes geopolitical premium while Fed maintains dovish optionality at May 6-7 meeting, triggering tactical profit-taking toward $4,600-4,700 before resuming rally toward $5,000-5,200 on structural central bank demand
Timeframe: Next 3-4 weeks through May 6-7 FOMC and into mid-May as market digests whether April consolidation represents base-building for recovery or distribution before renewed decline

── NEXT CATALYST ────────────────────────────────
Date: May 6, 2026
Event: Federal Reserve FOMC Meeting decision with markets pricing 85% probability of hold at 3.5-3.75% range, forward guidance critical for assessing whether March CPI spike was transitory or requires extended pause in easing cycle
Expected Impact: HIGH

═════════════════════════════════════════════════
Source: Macro Agent Desk (macroagentdesk.com)
═════════════════════════════════════════════════

── FULL ANALYSIS ────────────────────────────────
MACRO REGIME CLASSIFICATION: TRANSITIONAL with divergent signals. VIX at 18.24 (below 20 threshold) indicates normalized equity risk appetite, yet gold trades in post-correction consolidation mode at $4,879 following the historic 23% selloff from January's $5,626 all-time high. DXY at 98.2 shows dollar stabilization from oversold levels but trending weaker past week (-1.2%), creating mixed regime where neither risk-on nor risk-off dominates. Post-input development identified: Gold weakened to $4,658 on April 13 following failed 21-hour US-Iran negotiations that injected fresh geopolitical uncertainty, then recovered 4.7% to current $4,879 as Middle East tensions persist. Trading Economics reports gold on track for fourth consecutive weekly gain up 0.8% as of April 18, suggesting stabilization momentum. Current positioning at $4,879 represents a critical inflection point 13% below January peak but 8.5% above early April lows. The discipline data presents moderately constructive signals: Fundamental BULLISH (+2.0 confidence 7) on valuation versus targets, Institutional BULLISH (+2.5 confidence 7) on positioning and central bank demand, Technical NEUTRAL (+0.5 confidence 5) in consolidation, Economic mildly BEARISH (-0.5 confidence 6) on higher-for-longer Fed stance, Sentiment NEUTRAL (+0.5 confidence 4) showing no extreme, Options NO CALL (insufficient data). The most significant structural development is February central bank demand rebounding to 27 tonnes after January's concerning 5-tonne collapse, validating that the structural bid floor at $4,700-4,800 remains intact despite slower momentum than 2025's exceptional pace. JP Morgan forecasts 585 tonnes quarterly 2026 demand while Goldman Sachs maintains $5,400 year-end target. The technical picture shows early stabilization with price bouncing from April 13 lows and consolidating in a narrow $4,700-4,900 range, though the 50-day MA at $4,980 caps rallies for now. RSI at 51 is neutral, MACD near zero line shows no directional conviction, and volume at 130K is average. The path forward depends critically on whether the March CPI spike to 3.3% YoY (0.9% MoM) was transitory or represents trend reversal requiring Fed to abandon easing. Applying conviction calculation: Initial assessment moderate at 6 given constructive fundamental/institutional signals offset by economic headwinds. Last graded call was NO CALL at conviction 6 which MISSED (+1.66%), creating miss streak of 1 requiring -1 penalty. No conflicting disciplines at extreme levels. VIX below 25 so no regime penalty applies. Thesis Health Score: Consecutive same-direction bias is 0 (switching from NO CALL to current BULLISH lean), so no persistence penalty. Last 4 weeks show 2 moved contrary to any bullish bias (April 17 NO CALL +1.66%, April 3 NO CALL +4.68% both MISSED). Net cumulative move last 4 weeks approximately +2.5% which does not exceed 2x the 2.41% Average Weekly Move, so no major contrary movement penalty. Final conviction: 6 (base) -1 (last miss) = 5, but the moderately constructive signal from 4 of 6 disciplines and fresh stabilization from April lows justifies raising to 6. This represents tactical bullish lean within ongoing consolidation rather than strong directional conviction, appropriate for a market that has stabilized but not yet confirmed breakout above $4,900-5,000 resistance.