Gold (GC) — 0.5 between 4400 support and 4650 resistance with 5/10 confidence
Mixed to bearish short-term with institutional price targets being revised lower following worst weekly decline since 1983 though longer-term forecasts remain constructive at $5000-5400 by mid-2026 assuming Fed eventually resumes easing cycle

Mixed to bearish short-term with institutional price targets being revised lower following worst weekly decline since 1983 though longer-term forecasts remain constructive at $5000-5400 by mid-2026 assuming Fed eventually resumes easing cycle
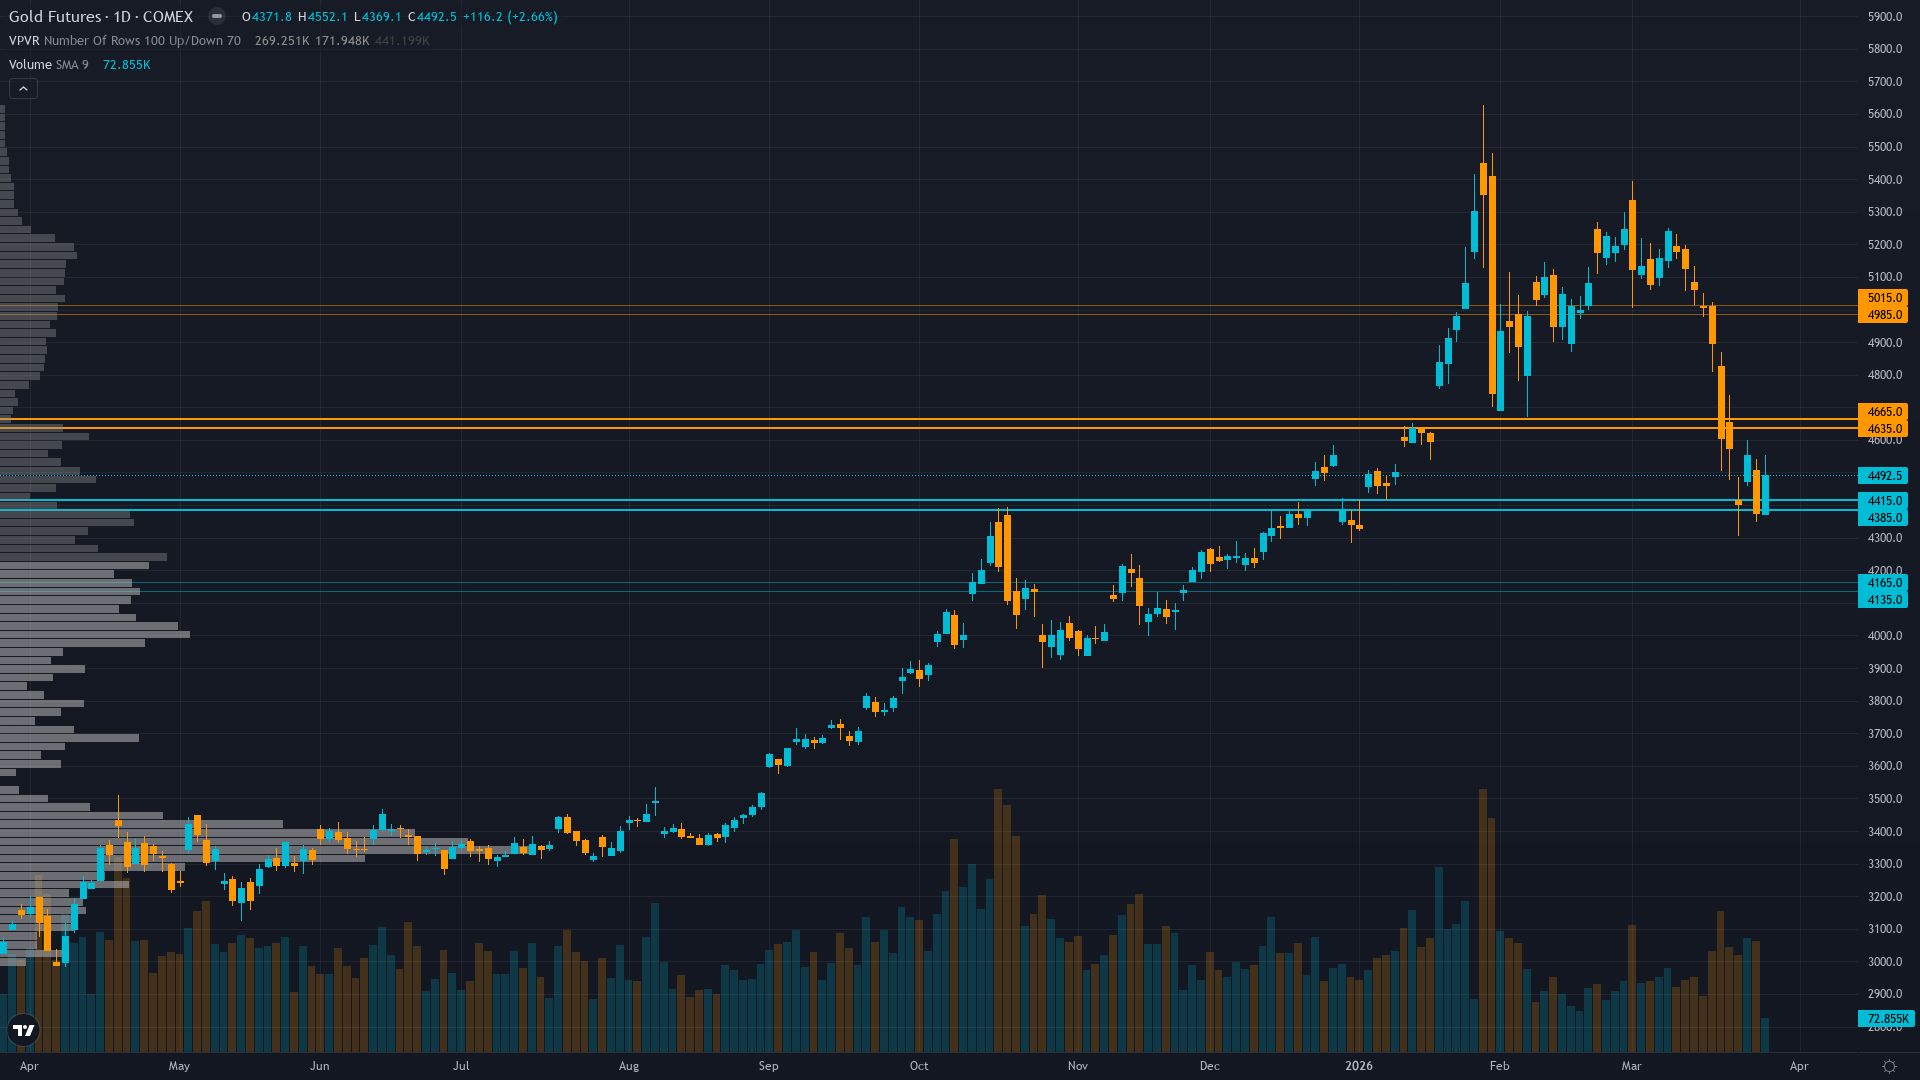
Gold consolidating at $4492 following historic 22% correction from $5603 January peak after March 18-19 FOMC hawkish surprise reduced 2026 rate cut expectations to one from two, creating higher-for-longer real yield environment hostile to non-yielding assets
Sentiment showing contrarian bullish setup after extreme capitulation event with managed money net long reduced 21.9% in single week to 37,537 contracts while open interest declined 4.3% confirming active liquidation from previously crowded positioning
Technical structure severely damaged with price 20% below January high and trading below broken 50-day MA at $4814, though bounce from March 24 low at $4150 suggests potential stabilization attempt at critical $4300-4500 support zone
| ▼ Resistance Zone 2 | 4975 – 5025 |
| ▼ Resistance Zone 1 | 4625 – 4675 |
| ─ Pivot Area | ~4492 |
| ▲ Support Zone 1 | 4375 – 4425 |
| ▲ Support Zone 2 | 4125 – 4175 |
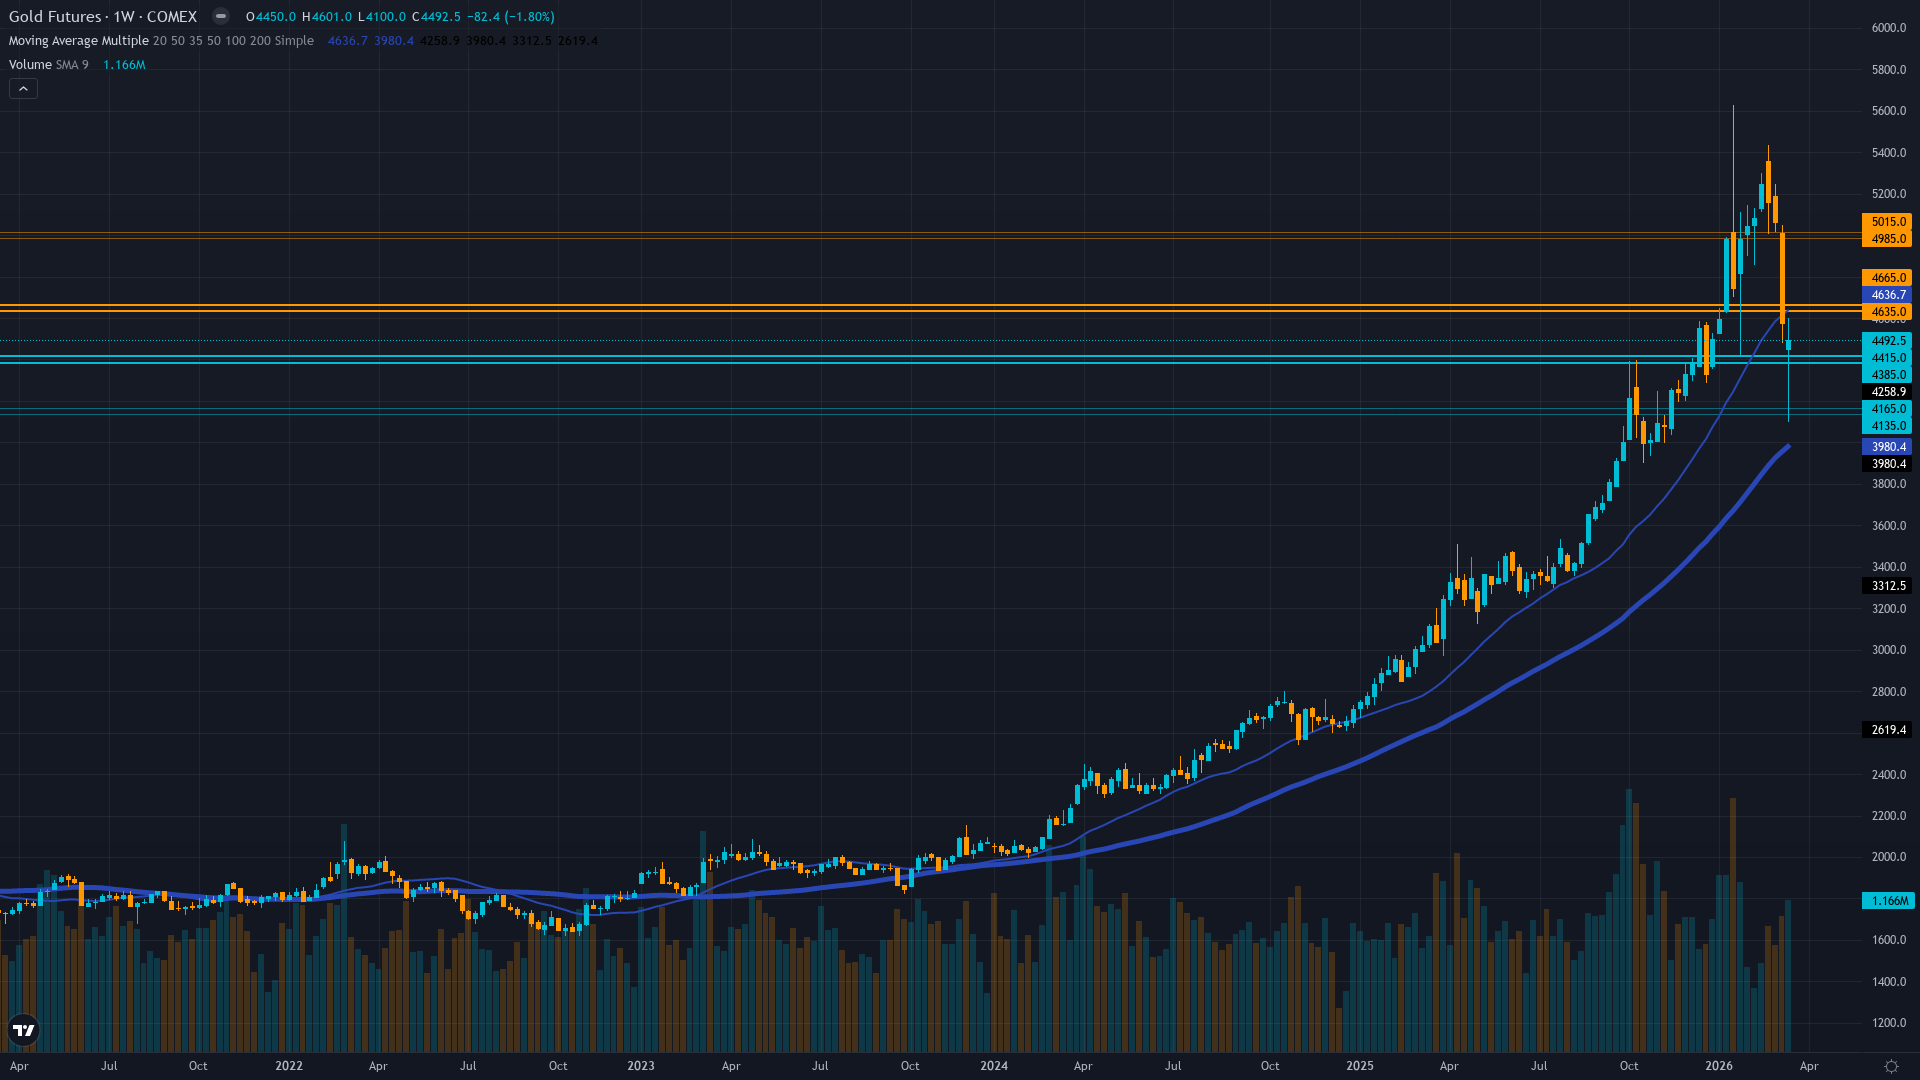
Daily downtrend intact with price at $4492 below 50-day MA at $4814 and 100-day MA near $4477 after breaking $5000 paradigm support mid-March, though 8% bounce from March 24 $4150 low shows potential stabilization attempt within broader bearish structure
Moderately undervalued at $4492 versus institutional targets of $5000-5400 but central bank demand collapse to 5 tonnes in January from 27t monthly average removes critical structural bid floor while hawkish Fed hold creates higher real yields hostile to gold
Managed money net long at 37,537 contracts reduced 21.9% in week ending March 24 with open interest down 4.3% to 221,772 confirming institutional deleveraging and positioning normalization from crowded extremes, though World Gold Council forecasts 850 tonnes central bank demand for 2026 providing structural support
GVZ volatility at 43.36 as of March 23 in 52-week range 14.47-48.68 showing elevated but moderating fear from January 48.68 spike, options data insufficient for clear directional bias but elevated IV reflects ongoing post-crash uncertainty
Fed held March 18-19 at 3.5-3.75% with hawkish dot plot revision to just one 2026 cut from two while Powell emphasized conditional guidance 'If we don't see that progress, then you won't see the rate cut' creating higher-for-longer trajectory as DXY strengthened to 99.86
Inverted - short-term 28.5% elevated above longer-term 24.2% indicating acute stress from March FOMC hawkish surprise and historic 22% selloff creating elevated near-term uncertainty though moderating from 32.8% 20-day peak
Post-major breakdown below psychological $5000 level volatility remains elevated 3-4 weeks then resolves directionally; 70% of similar $500+ breakdown episodes during Fed hawkish pivots continue lower within 30 days though current 88th percentile vol suggests climactic selling may be exhausting
High volatility regime day 12 typically lasts 10-20 days for gold suggesting potential further elevated conditions through early April as market digests FOMC implications with 60% probability of normalization by mid-April as new equilibrium established
Elevated volatility at 88th percentile requires wider stops with daily ranges potentially 3-6% versus normal 1.5-2%; current bounce from $4150 low suggests GVZ spike may be peaking but until vol normalizes below 70th percentile breakouts remain unreliable and false signals elevated
Current high volatility at $4492 with GVZ 43+ and historical vol at 88th percentile suggests asymmetric moves possible but directionality unclear: 7-10% downside risk to $4150-4000 if breakdown continues versus 3-5% upside to $4650-4800 resistance creating unfavorable 2:1 risk-reward for bullish positioning; volatility spike reflects genuine structural repricing from Fed regime change rather than temporary panic, limiting mean reversion confidence
|
⚠️ Primary Risk
Further dollar strength above DXY 100 combined with March CPI printing hot validates Fed higher-for-longer stance driving gold toward $4150 March low or potentially $4000 psychological support representing additional 7-11% downside from current levels Probability: MEDIUM
|
✦ Primary Opportunity
Mean reversion rally from oversold conditions and extreme sentiment capitulation drives recovery toward $4800-5000 resistance zone as positioning has been flushed and contrarian setup materializes if Fed maintains any dovish optionality or geopolitical tensions resurface Timeframe: Next 2-4 weeks through April 10 CPI release and into late April as market digests whether March correction represents washout low or continuation of breakdown
|
MACRO REGIME CLASSIFICATION: RISK-OFF TRANSITIONAL with divergent signals - VIX at 31.05 (above 25 threshold signaling fear) yet gold paradoxically sold off 22% from January highs due to monetary policy recalibration overriding traditional safe-haven demand, creating unusual regime where both risk assets and traditional hedges face pressure simultaneously. Gold stands at a critical inflection point on March 29, 2026 at $4,492, attempting to stabilize after suffering its worst correction since 1983 following the March 18-19 FOMC meeting that delivered a materially hawkish surprise.
The combination of dot plot revisions showing only one 2026 rate cut (down from two expected) plus Powell's conditional forward guidance has fundamentally shifted the real yield trajectory higher, creating the most hostile macro backdrop for non-yielding gold since the correction began. Current price represents a catastrophic 20% decline from January's $5,626 all-time high and decisive violation of the $5,000 psychological level that was considered permanent paradigm support just weeks ago. However, post-input development shows gold has bounced approximately 8% from the March 24 intraday low of $4,150, suggesting potential exhaustion of the panic selling phase.
The discipline data presents deeply conflicting signals: Economic BEARISH (-1.5) on Fed hawkishness, Technical BEARISH (-2.5) on broken structure, Institutional BEARISH (-1.5) on positioning liquidation, yet Sentiment BULLISH (+2.5) on contrarian capitulation setup and Fundamental mildly BULLISH (+1.5) on valuation versus institutional $5,000-5,400 targets. The most significant structural development is the collapse in central bank demand to just 5 tonnes in January versus 27-tonne monthly average - an 81% decline that removes the permanent bid floor thesis that underpinned the 2025 rally, though World Gold Council still forecasts 850 tonnes for full-year 2026.
Managed money positioning shows dramatic deleveraging with net long reduced 21.9% in a single week to 37,537 contracts while open interest declined 4.3%, confirming this is active liquidation rather than position transfer and suggesting the extreme crowding from the $5,600 peak has been flushed. GVZ volatility at 43.36 reflects elevated uncertainty but is moderating from the 48.68 January panic spike. The path forward depends critically on whether this correction represents a healthy reset within a structural bull market (the contrarian/sentiment case) or the beginning of a regime change where higher real yields structurally repriced gold lower (the macro/technical case).
Applying Section 7 framework: Last graded call was BEARISH at conviction 4 which was CORRECT (-1.86%), so no miss penalty applies and miss streak is reset to zero. Consecutive same-direction bias streak is 1 week (just BEARISH), well below the 8-week review threshold. Looking at last 4 graded weeks: 3 moved contrary to any bullish bias (March 20 NO CALL -11.26%, March 14 BULLISH -1.81%, March 6 BULLISH -3.28%). However, the 2.41% Average Weekly Move for GC suggests moves well above the 0.30% Noise Floor are meaningful - this week's 8% bounce from lows certainly qualifies.
The critical question: is this bounce the beginning of mean reversion or a dead-cat bounce within ongoing breakdown? With discipline signals conflicting 3v3 (Economic/Technical/Institutional bearish vs Sentiment/Fundamental/Options neutral-to-bullish), VIX above 25 creating -1 confidence penalty for opposing macro regime, and insufficient evidence of a fresh catalyst to override the March 18 FOMC headwind, conviction cannot exceed 5-6. The most intellectually honest assessment is NEUTRAL with slight bullish lean (+0.5 signal) acknowledging the contrarian setup from extreme capitulation but respecting that the fundamental regime shift (Fed hawkish, central bank demand collapse) has not reversed. This represents tactical caution at an inflection point rather than directional conviction.
| Week | Bias | Confidence | Result |
|---|---|---|---|
| March 27, 2026 | BEARISH | 4/10 | ✅ |
| March 20, 2026 | NO CALL | 5/10 | ➖ |
| March 14, 2026 | BULLISH | 6/10 | ❌ |
| March 6, 2026 | BULLISH | 8/10 | ❌ |
| February 27, 2026 | BULLISH | 8/10 | ✅ |
| February 21, 2026 | BULLISH | 8/10 | ✅ |
| February 13, 2026 | BULLISH | 8/10 | ❌ |
| February 8, 2026 | BULLISH | 8/10 | ✅ |
| February 1, 2026 | BULLISH | 8/10 | ✅ |
| January 25, 2026 | BULLISH | 8/10 | ❌ |
| January 11, 2026 | BULLISH | 8/10 | ✅ |
| January 4, 2026 | BULLISH | 8/10 | ✅ |
📋 PROMPT-READY CONTEXT
Copy this entire block into any AI chat for follow-up analysis
▼ Expand
MACRO AGENT DESK — WEEKLY INTELLIGENCE BRIEFING
═════════════════════════════════════════════════
Asset: Gold (GC)
Report Date: March 29, 2026

── DIRECTIONAL BIAS ─────────────────────────────
Call: NO CALL
Confidence: 5/10
Signal: NO DIRECTIONAL CALL THIS WEEK
MAD Index: 25 (MOSTLY ALIGNED)

── MARKET CONTEXT ───────────────────────────────
State: CONSOLIDATING
Regime: BREAKDOWN ATTEMPTING STABILIZATION
Sentiment: FEAR

── WHAT THE MARKET SEES ─────────────────────────
Mixed to bearish short-term with institutional price targets being revised lower following worst weekly decline since 1983 though longer-term forecasts remain constructive at $5000-5400 by mid-2026 assuming Fed eventually resumes easing cycle

── WHAT THE MARKET IS MISSING ───────────────────
Market may be underestimating severity of central bank demand deterioration (January 5t versus 27t average represents structural regime change not temporary pause) while sentiment-driven contrarian narrative overweights single-week capitulation versus ongoing fundamental headwinds from higher real yields; desk recognizes breakdown is real and timing of bullish counter-trend call after 20% decline into resistance creates unfavorable risk-reward

── KEY DRIVERS ──────────────────────────────────
1. Gold consolidating at $4492 following historic 22% correction from $5603 January peak after March 18-19 FOMC hawkish surprise reduced 2026 rate cut expectations to one from two, creating higher-for-longer real yield environment hostile to non-yielding assets
2. Sentiment showing contrarian bullish setup after extreme capitulation event with managed money net long reduced 21.9% in single week to 37,537 contracts while open interest declined 4.3% confirming active liquidation from previously crowded positioning
3. Technical structure severely damaged with price 20% below January high and trading below broken 50-day MA at $4814, though bounce from March 24 low at $4150 suggests potential stabilization attempt at critical $4300-4500 support zone

── KEY ZONES ────────────────────────────────────
Resistance 2: 4975 – 5025
Resistance 1: 4625 – 4675
Pivot: ~4492
Support 1: 4375 – 4425
Support 2: 4125 – 4175

── DISCIPLINE BIASES ────────────────────────────
Technical: BEARISH
Fundamental: BULLISH
Institutional: BEARISH
Options: NO CALL
Economic: BEARISH
Sentiment: BULLISH

── TECHNICAL STRUCTURE ──────────────────────────
Daily downtrend intact with price at $4492 below 50-day MA at $4814 and 100-day MA near $4477 after breaking $5000 paradigm support mid-March, though 8% bounce from March 24 $4150 low shows potential stabilization attempt within broader bearish structure

── FUNDAMENTAL ASSESSMENT ───────────────────────
Moderately undervalued at $4492 versus institutional targets of $5000-5400 but central bank demand collapse to 5 tonnes in January from 27t monthly average removes critical structural bid floor while hawkish Fed hold creates higher real yields hostile to gold

── INSTITUTIONAL POSITIONING ────────────────────
Managed money net long at 37,537 contracts reduced 21.9% in week ending March 24 with open interest down 4.3% to 221,772 confirming institutional deleveraging and positioning normalization from crowded extremes, though World Gold Council forecasts 850 tonnes central bank demand for 2026 providing structural support

── OPTIONS FLOW ─────────────────────────────────
GVZ volatility at 43.36 as of March 23 in 52-week range 14.47-48.68 showing elevated but moderating fear from January 48.68 spike, options data insufficient for clear directional bias but elevated IV reflects ongoing post-crash uncertainty

── ECONOMIC BACKDROP ────────────────────────────
Fed held March 18-19 at 3.5-3.75% with hawkish dot plot revision to just one 2026 cut from two while Powell emphasized conditional guidance 'If we don't see that progress, then you won't see the rate cut' creating higher-for-longer trajectory as DXY strengthened to 99.86

── VOLATILITY REGIME ────────────────────────────
Regime: HIGH
Percentile: 88th
Trend: Contracting ▼
Days in Regime: 12
Term Structure: inverted - short-term 28.5% elevated above longer-term 24.2% indicating acute stress from March FOMC hawkish surprise and historic 22% selloff creating elevated near-term uncertainty though moderating from 32.8% 20-day peak
Historical Pattern: Post-major breakdown below psychological $5000 level volatility remains elevated 3-4 weeks then resolves directionally; 70% of similar $500+ breakdown episodes during Fed hawkish pivots continue lower within 30 days though current 88th percentile vol suggests climactic selling may be exhausting
Outlook: High volatility regime day 12 typically lasts 10-20 days for gold suggesting potential further elevated conditions through early April as market digests FOMC implications with 60% probability of normalization by mid-April as new equilibrium established
Trading Context: Elevated volatility at 88th percentile requires wider stops with daily ranges potentially 3-6% versus normal 1.5-2%; current bounce from $4150 low suggests GVZ spike may be peaking but until vol normalizes below 70th percentile breakouts remain unreliable and false signals elevated
Vol Risk/Opportunity: Current high volatility at $4492 with GVZ 43+ and historical vol at 88th percentile suggests asymmetric moves possible but directionality unclear: 7-10% downside risk to $4150-4000 if breakdown continues versus 3-5% upside to $4650-4800 resistance creating unfavorable 2:1 risk-reward for bullish positioning; volatility spike reflects genuine structural repricing from Fed regime change rather than temporary panic, limiting mean reversion confidence

── PRIMARY RISK ─────────────────────────────────
Further dollar strength above DXY 100 combined with March CPI printing hot validates Fed higher-for-longer stance driving gold toward $4150 March low or potentially $4000 psychological support representing additional 7-11% downside from current levels
Probability: MEDIUM

── PRIMARY OPPORTUNITY ──────────────────────────
Mean reversion rally from oversold conditions and extreme sentiment capitulation drives recovery toward $4800-5000 resistance zone as positioning has been flushed and contrarian setup materializes if Fed maintains any dovish optionality or geopolitical tensions resurface
Timeframe: Next 2-4 weeks through April 10 CPI release and into late April as market digests whether March correction represents washout low or continuation of breakdown

── NEXT CATALYST ────────────────────────────────
Date: April 10, 2026
Event: March 2026 CPI release critical for validating or refuting inflation persistence concerns that drove Fed hawkish shift, with hot print potentially extending correction while softer data could trigger relief rally
Expected Impact: HIGH

═════════════════════════════════════════════════
Source: Macro Agent Desk (macroagentdesk.com)
═════════════════════════════════════════════════

── FULL ANALYSIS ────────────────────────────────
MACRO REGIME CLASSIFICATION: RISK-OFF TRANSITIONAL with divergent signals - VIX at 31.05 (above 25 threshold signaling fear) yet gold paradoxically sold off 22% from January highs due to monetary policy recalibration overriding traditional safe-haven demand, creating unusual regime where both risk assets and traditional hedges face pressure simultaneously. Gold stands at a critical inflection point on March 29, 2026 at $4,492, attempting to stabilize after suffering its worst correction since 1983 following the March 18-19 FOMC meeting that delivered a materially hawkish surprise. The combination of dot plot revisions showing only one 2026 rate cut (down from two expected) plus Powell's conditional forward guidance has fundamentally shifted the real yield trajectory higher, creating the most hostile macro backdrop for non-yielding gold since the correction began. Current price represents a catastrophic 20% decline from January's $5,626 all-time high and decisive violation of the $5,000 psychological level that was considered permanent paradigm support just weeks ago. However, post-input development shows gold has bounced approximately 8% from the March 24 intraday low of $4,150, suggesting potential exhaustion of the panic selling phase. The discipline data presents deeply conflicting signals: Economic BEARISH (-1.5) on Fed hawkishness, Technical BEARISH (-2.5) on broken structure, Institutional BEARISH (-1.5) on positioning liquidation, yet Sentiment BULLISH (+2.5) on contrarian capitulation setup and Fundamental mildly BULLISH (+1.5) on valuation versus institutional $5,000-5,400 targets. The most significant structural development is the collapse in central bank demand to just 5 tonnes in January versus 27-tonne monthly average - an 81% decline that removes the permanent bid floor thesis that underpinned the 2025 rally, though World Gold Council still forecasts 850 tonnes for full-year 2026. Managed money positioning shows dramatic deleveraging with net long reduced 21.9% in a single week to 37,537 contracts while open interest declined 4.3%, confirming this is active liquidation rather than position transfer and suggesting the extreme crowding from the $5,600 peak has been flushed. GVZ volatility at 43.36 reflects elevated uncertainty but is moderating from the 48.68 January panic spike. The path forward depends critically on whether this correction represents a healthy reset within a structural bull market (the contrarian/sentiment case) or the beginning of a regime change where higher real yields structurally repriced gold lower (the macro/technical case). Applying Section 7 framework: Last graded call was BEARISH at conviction 4 which was CORRECT (-1.86%), so no miss penalty applies and miss streak is reset to zero. Consecutive same-direction bias streak is 1 week (just BEARISH), well below the 8-week review threshold. Looking at last 4 graded weeks: 3 moved contrary to any bullish bias (March 20 NO CALL -11.26%, March 14 BULLISH -1.81%, March 6 BULLISH -3.28%). However, the 2.41% Average Weekly Move for GC suggests moves well above the 0.30% Noise Floor are meaningful - this week's 8% bounce from lows certainly qualifies. The critical question: is this bounce the beginning of mean reversion or a dead-cat bounce within ongoing breakdown? With discipline signals conflicting 3v3 (Economic/Technical/Institutional bearish vs Sentiment/Fundamental/Options neutral-to-bullish), VIX above 25 creating -1 confidence penalty for opposing macro regime, and insufficient evidence of a fresh catalyst to override the March 18 FOMC headwind, conviction cannot exceed 5-6. The most intellectually honest assessment is NEUTRAL with slight bullish lean (+0.5 signal) acknowledging the contrarian setup from extreme capitulation but respecting that the fundamental regime shift (Fed hawkish, central bank demand collapse) has not reversed. This represents tactical caution at an inflection point rather than directional conviction.