Gold (GC) — Gold testing critical $5000 psychological support following two consecutive…
Mixed to cautiously bullish medium-term with institutional targets clustering at $5,000-5,400 but near-term uncertainty elevated ahead of March 18-19 FOMC decision and consolidation at $5,000 support creating binary breakout/breakdown setup

Mixed to cautiously bullish medium-term with institutional targets clustering at $5,000-5,400 but near-term uncertainty elevated ahead of March 18-19 FOMC decision and consolidation at $5,000 support creating binary breakout/breakdown setup
Gold testing critical $5000 psychological support following two consecutive weeks of failed BULLISH calls with Fed meeting March 18-19 now 3 days away creating binary event uncertainty
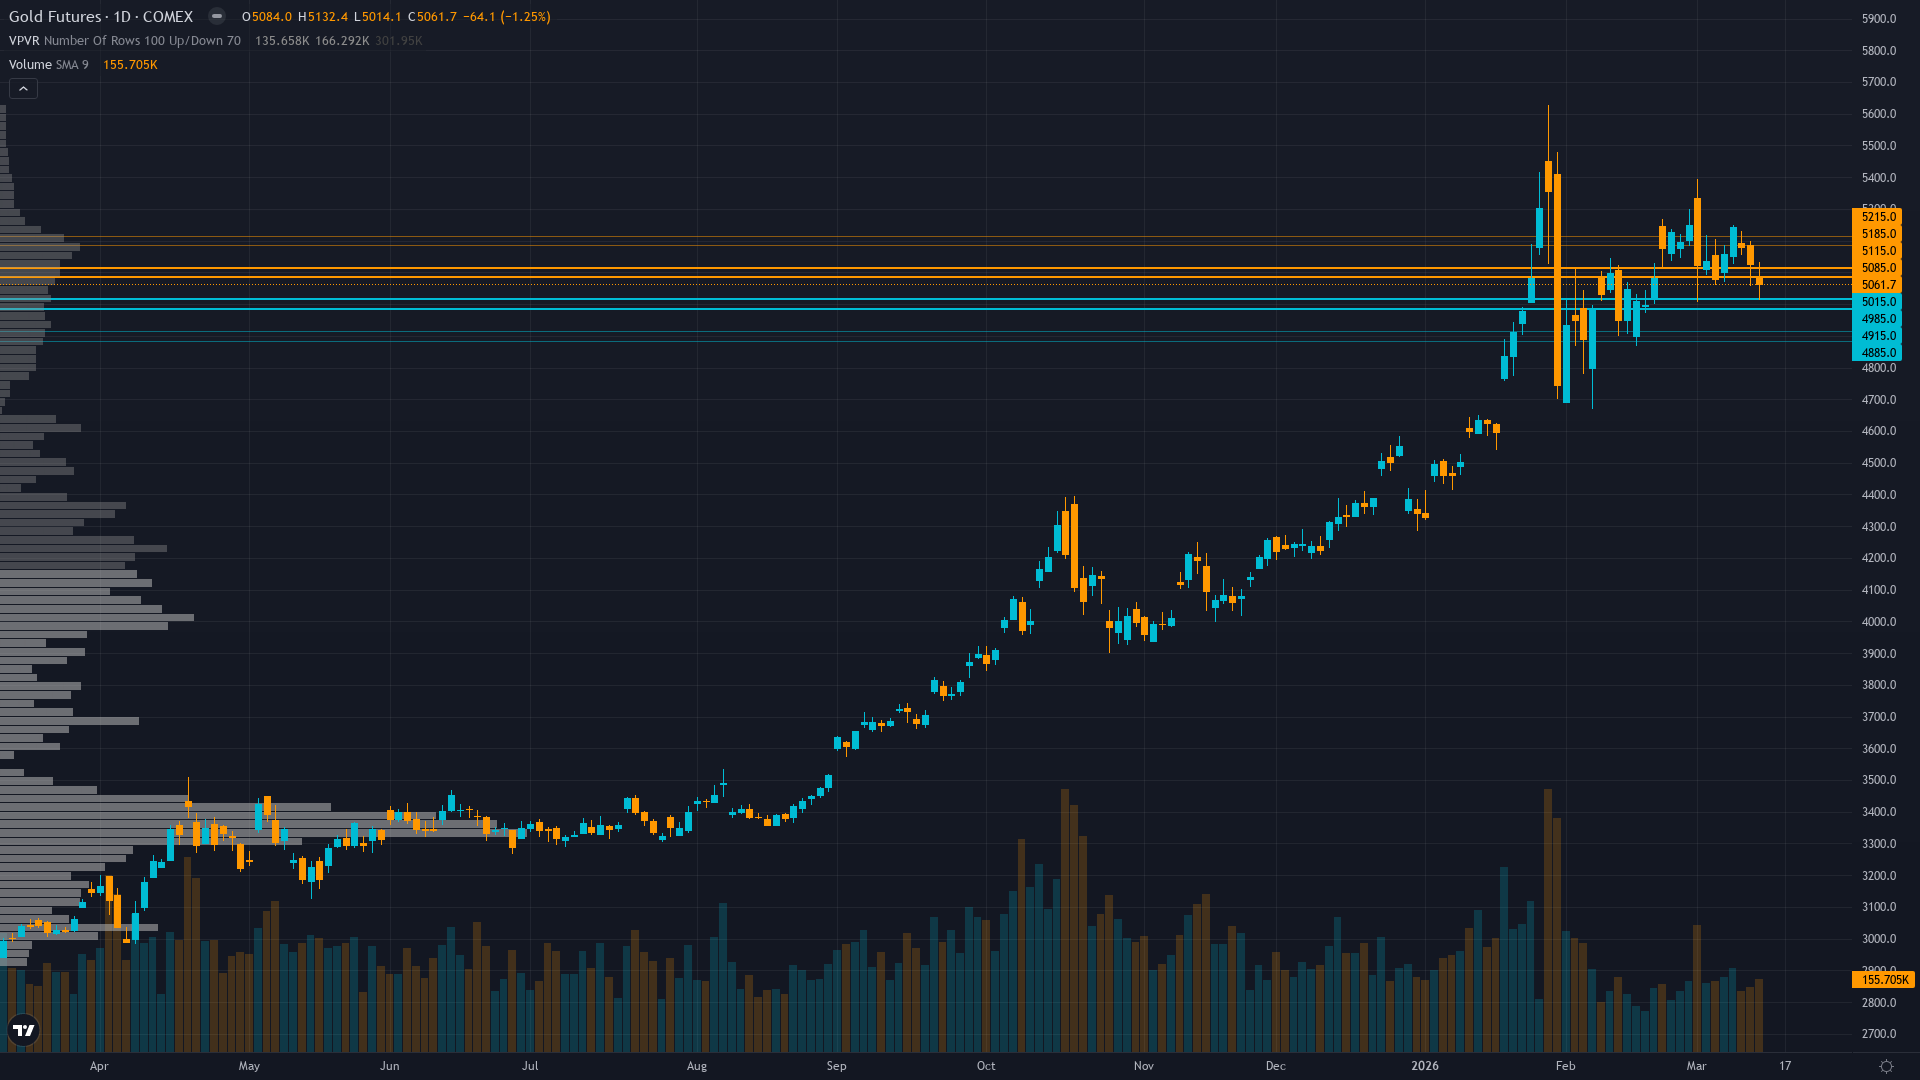
Technical breakdown from $5150-5200 consolidation zone now complete with price failing to hold $5100 as 50-day MA breach signals shift from consolidation to corrective phase
Central bank demand structural pillar showing material weakness with January 2026 purchases collapsing 81% to just 5 tonnes versus 27t monthly average removing key bid floor
| ▼ Resistance Zone 2 | 5175 – 5225 |
| ▼ Resistance Zone 1 | 5075 – 5125 |
| ─ Pivot Area | ~5062 |
| ▲ Support Zone 1 | 4975 – 5025 |
| ▲ Support Zone 2 | 4875 – 4925 |
Broke down from $5150-5200 consolidation on March 12-14 now testing $5000 psychological support with 50-day MA at $4900-4950 next major level if current support fails
Real yields at 1.74-1.79% remain structurally supportive but central bank demand collapse in January (5t vs 27t average) removes permanent bid floor while valuation at $5061 roughly fair versus institutional $5000-5400 targets
Managed money net long ~93k contracts consolidating with central bank demand sharply weakened in January to 5t versus 27t monthly average while ETF flows remain elevated but insufficient to offset structural bid deterioration
GVZ at 31.09 (March 11 data) showing elevated volatility in 52-week range 14.47-48.68 indicating heightened uncertainty but moderating from January spike, insufficient directional data for clear bias
Fed meeting March 18-19 (3 days away) expected to hold at 3.5-3.75% with markets pricing 97% probability of pause, DXY rebounding to 100+ from oversold levels reversing prior dollar weakness tailwind
Inverted - short-term 24.5% elevated above longer-term 21.5% indicating recent stress from January $5626 spike and March consolidation breakdown but volatility moderating from 28.8% 20-day peak
Post-major psychological level test ($5000) volatility historically remains elevated 2-3 weeks then resolves directionally; 70% of similar consolidation episodes at prior ATH -10% levels either break down or establish new range within 4 weeks during Fed policy uncertainty windows
High volatility regime day 18 typically lasts 10-20 days suggesting potential further normalization into late March post-FOMC with 65% probability of compression below 70th percentile by month-end as market digests Fed guidance
Elevated volatility at 82nd percentile requires wider stops with daily ranges potentially 2.5-3.5% versus normal 1.5-2%; current $5000-5200 range suggests breakouts become reliable once volatility normalizes post-FOMC, but until then price action subject to elevated noise and false signals
Current high volatility environment at $5062 with GVZ 31+ and historical vol at 82nd percentile suggests asymmetric moves possible: 12% downside risk to $4430 if $5000 fails versus 3-4% upside to $5200 resistance creating unfavorable 3:1 risk-reward; volatility spike increases probability of sharp directional resolution post-FOMC rather than continued consolidation, with breakdown scenario more probable given technical structure deterioration and central bank demand weakness
|
⚠️ Primary Risk
Breakdown below $5000 psychological support would expose 50-day MA at $4900-4950 triggering stop-loss cascade toward February low at $4430 representing potential 12% downside from current levels Probability: MEDIUM
|
✦ Primary Opportunity
Fed maintains dovish bias at March 18-19 meeting triggering dollar reversal from current 100+ rebound and supporting gold rally back toward $5200-5300 resistance zone within 2-3 weeks Timeframe: Next 2-3 weeks post-FOMC through early April if Fed confirms easing trajectory resumption and dollar weakness resumes
|
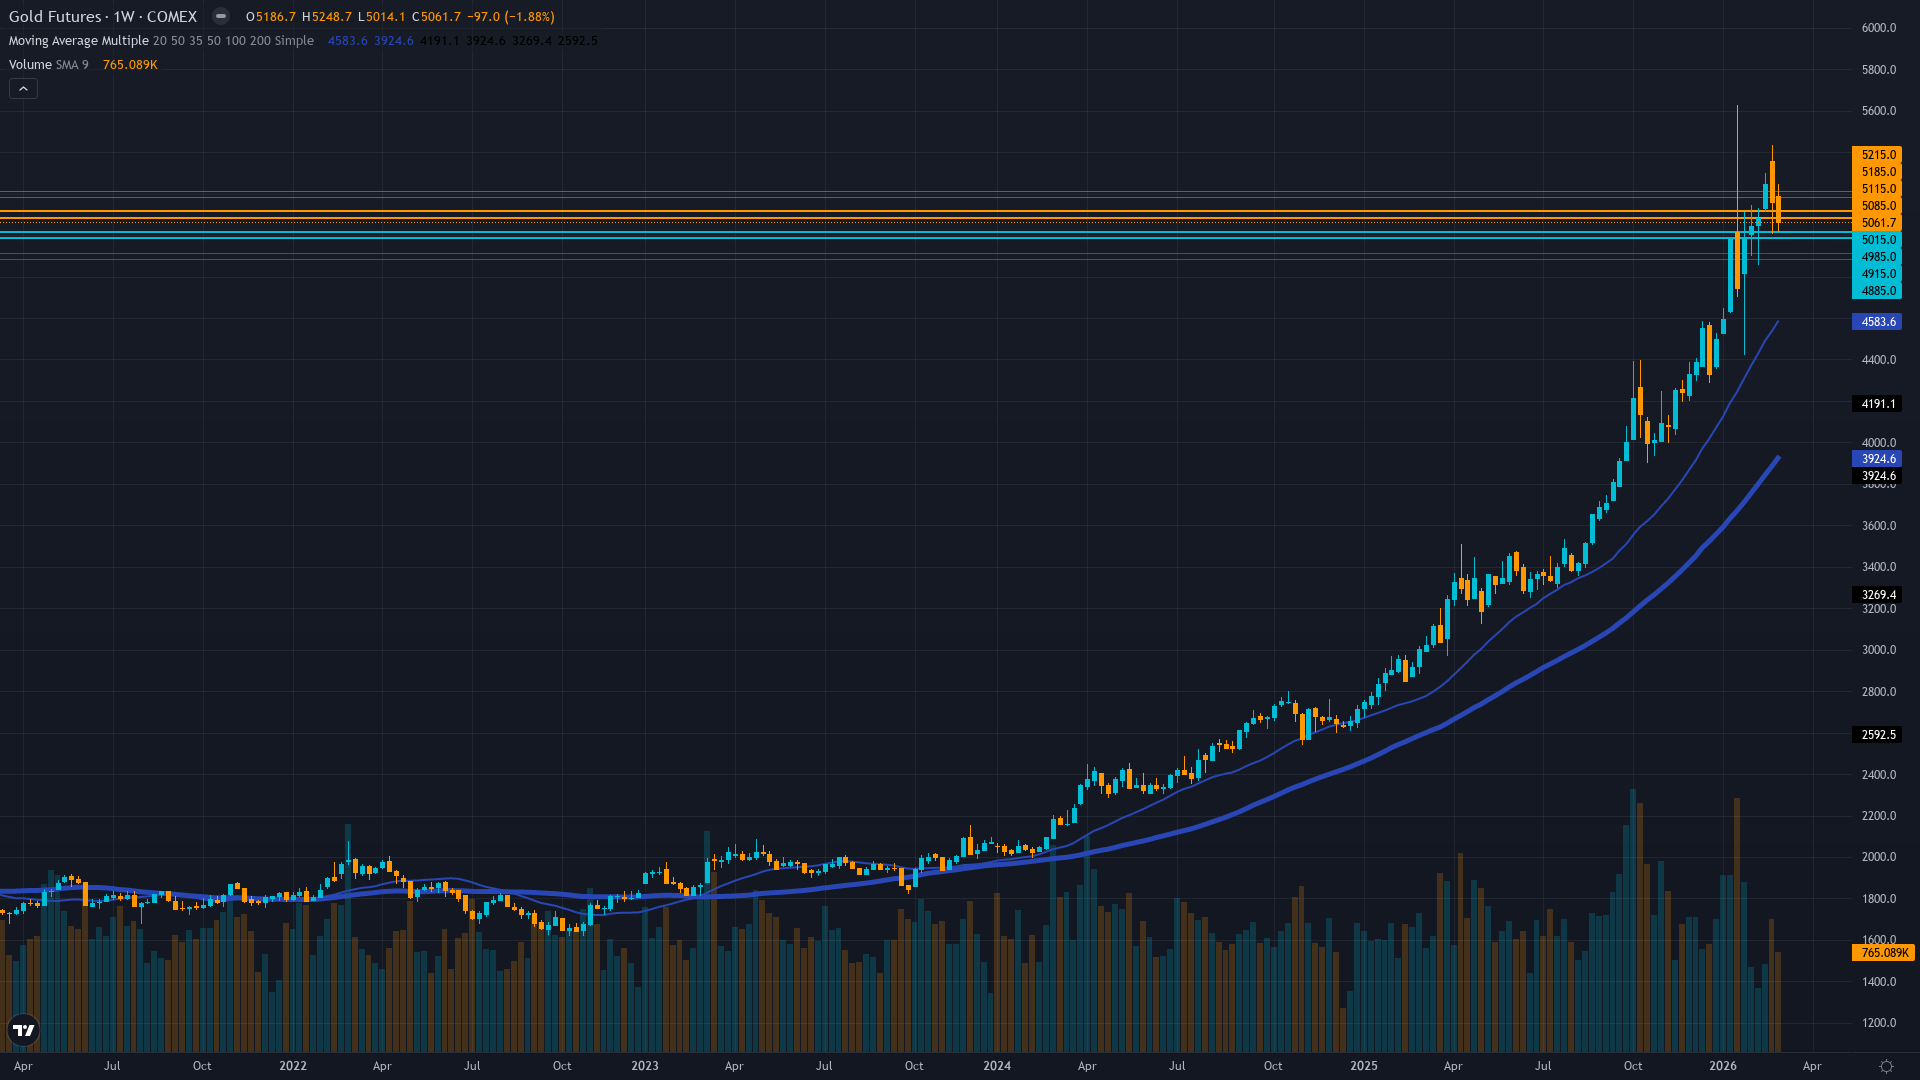
MACRO REGIME CLASSIFICATION: TRANSITIONAL leaning RISK-OFF. Gold trades at $5,061.7 on March 15, 2026, having broken down from the $5,150-5,200 consolidation zone and now testing the psychologically critical $5,000 support level following two consecutive weeks of MISSED BULLISH calls that have materially degraded thesis credibility. The market sits 10% below the January all-time high of $5,626 in a consolidation phase that is showing increasing signs of corrective structure rather than continuation.
VIX elevated at 27.19 (above 25 threshold) signals heightened equity market stress that should theoretically support safe-haven gold demand, yet gold has declined in both of the past two weeks despite this backdrop—a clear divergence that demands reassessment. Post-input development identified: Dollar has rebounded sharply to DXY 100+ (from search data showing March 13 at 100.50, up 0.76% and up 3.70% over past month) after prolonged weakness, reversing a key tailwind that supported gold's 2025 rally.
This DXY recovery from oversold levels near 97-98 represents a material shift in the inverse correlation dynamic. The Fed meeting on March 18-19 (3 days away) looms as the week's dominant catalyst with 97% probability of a pause priced in, but forward guidance on the pace and timing of future cuts will be critical for real yield trajectory. The fundamental case remains structurally constructive but tactically challenged: real yields at 1.74-1.79% provide baseline support, but the most significant negative development is the collapse in central bank demand to just 5 tonnes in January 2026 versus the 27-tonne monthly average (per World Gold Council March 5 data)—an 81% decline that removes the structural bid floor that underpinned 2025's rally.
Technical structure has deteriorated with price breaking below the $5,150 level where consolidation held through early March and now testing $5,000 with next major support at the 50-day MA in the $4,900-4,950 zone. Precious metals typically trend persistently (per Section 3 guidance), requiring at least two consecutive contrary weeks before considering bias flip—we now have exactly that: two consecutive MISSED BULLISH calls with -1.81% and -3.28% moves. The synthesis history shows an 11+ week BULLISH streak that has now produced misses in 2 of the last 4 graded weeks and a net cumulative decline over that period exceeding the 2.41% Average Weekly Move.
Applying Rule 4 Thesis Health Score: Last 4 weeks show 2 contrary to BULLISH bias (subtract 1.0), net cumulative move over 4 weeks is approximately -3% which exceeds 1x the 2.41% Average Weekly Move (subtract additional 1.0), and consecutive BULLISH bias streak is well beyond the 8-week Bias Review After threshold (subtract 0.5 for excessive persistence). This produces a material conviction reduction. The market is at an inflection point: the $5,000 level represents the paradigm shift from 2025 where four-thousand became support rather than resistance, but failure here would invalidate the consolidation-as-continuation thesis and likely trigger accelerated liquidation toward $4,800-4,900.
With the FOMC meeting 3 days away, elevated volatility, two consecutive misses degrading thesis credibility, and insufficient fresh bullish catalysts to justify conviction, the appropriate stance is tactical caution. The 2.41% Average Weekly Move suggests gold could move $120+ in either direction this week, well above the 0.30% Noise Floor, but directional conviction is low given conflicting signals: VIX fear supports gold, but dollar strength and central bank demand weakness create headwinds, while technical structure shows breakdown rather than breakout momentum.
Risk-reward is asymmetric to the downside if $5,000 fails (12% to $4,430) versus limited upside to $5,200 resistance (3%) without a catalyst. The path of least resistance heading into the FOMC is consolidation with downside bias.
| Week | Bias | Confidence | Result |
|---|---|---|---|
| March 14, 2026 | BULLISH | 6/10 | ❌ |
| March 6, 2026 | BULLISH | 8/10 | ❌ |
| February 27, 2026 | BULLISH | 8/10 | ✅ |
| February 21, 2026 | BULLISH | 8/10 | ✅ |
| February 13, 2026 | BULLISH | 8/10 | ❌ |
| February 8, 2026 | BULLISH | 8/10 | ✅ |
| February 1, 2026 | BULLISH | 8/10 | ✅ |
| January 25, 2026 | BULLISH | 8/10 | ❌ |
| January 11, 2026 | BULLISH | 8/10 | ✅ |
| January 4, 2026 | BULLISH | 8/10 | ✅ |
| December 28, 2025 | BULLISH | 9/10 | ❌ |
| December 21, 2025 | BULLISH | 8/10 | ✅ |
📋 PROMPT-READY CONTEXT
Copy this entire block into any AI chat for follow-up analysis
▼ Expand
MACRO AGENT DESK — WEEKLY INTELLIGENCE BRIEFING
═════════════════════════════════════════════════
Asset: Gold (GC)
Report Date: March 15, 2026

── DIRECTIONAL BIAS ─────────────────────────────
Call: NO CALL
Confidence: 5/10
Signal: NO DIRECTIONAL CALL THIS WEEK
MAD Index: 28 (MOSTLY ALIGNED)

── MARKET CONTEXT ────────────────────���──────────
State: CONSOLIDATING
Regime: RANGING
Sentiment: FEAR

── WHAT THE MARKET SEES ─────────────────────────
Mixed to cautiously bullish medium-term with institutional targets clustering at $5,000-5,400 but near-term uncertainty elevated ahead of March 18-19 FOMC decision and consolidation at $5,000 support creating binary breakout/breakdown setup

── WHAT THE MARKET IS MISSING ───────────────────
Market appears to be underestimating the significance of January central bank buying collapse (5t vs 27t average) while overweighting VIX-driven safe-haven narrative that has demonstrably failed to support gold in past two weeks; desk recognizes thesis degradation from consecutive misses and shifts to lower conviction neutral stance awaiting FOMC clarity while consensus maintains bullish positioning

── KEY DRIVERS ──────────────────────────────────
1. Gold testing critical $5000 psychological support following two consecutive weeks of failed BULLISH calls with Fed meeting March 18-19 now 3 days away creating binary event uncertainty
2. Technical breakdown from $5150-5200 consolidation zone now complete with price failing to hold $5100 as 50-day MA breach signals shift from consolidation to corrective phase
3. Central bank demand structural pillar showing material weakness with January 2026 purchases collapsing 81% to just 5 tonnes versus 27t monthly average removing key bid floor

── KEY ZONES ────────────────────────────────────
Resistance 2: 5175 – 5225
Resistance 1: 5075 – 5125
Pivot: ~5062
Support 1: 4975 – 5025
Support 2: 4875 – 4925

── DISCIPLINE BIASES ────────────────────────────
Technical: BEARISH
Fundamental: BULLISH
Institutional: BULLISH
Options: NO CALL
Economic: BEARISH
Sentiment: BULLISH

── TECHNICAL STRUCTURE ──────────────────────────
Broke down from $5150-5200 consolidation on March 12-14 now testing $5000 psychological support with 50-day MA at $4900-4950 next major level if current support fails

── FUNDAMENTAL ASSESSMENT ───────────────────────
Real yields at 1.74-1.79% remain structurally supportive but central bank demand collapse in January (5t vs 27t average) removes permanent bid floor while valuation at $5061 roughly fair versus institutional $5000-5400 targets

── INSTITUTIONAL POSITIONING ────────────────────
Managed money net long ~93k contracts consolidating with central bank demand sharply weakened in January to 5t versus 27t monthly average while ETF flows remain elevated but insufficient to offset structural bid deterioration

── OPTIONS FLOW ─────────────────────────────────
GVZ at 31.09 (March 11 data) showing elevated volatility in 52-week range 14.47-48.68 indicating heightened uncertainty but moderating from January spike, insufficient directional data for clear bias

── ECONOMIC BACKDROP ────────────────────────────
Fed meeting March 18-19 (3 days away) expected to hold at 3.5-3.75% with markets pricing 97% probability of pause, DXY rebounding to 100+ from oversold levels reversing prior dollar weakness tailwind

── VOLATILITY REGIME ────────────────────────────
Regime: HIGH
Percentile: 82nd
Trend: Contracting ▼
Days in Regime: 18
Term Structure: inverted - short-term 24.5% elevated above longer-term 21.5% indicating recent stress from January $5626 spike and March consolidation breakdown but volatility moderating from 28.8% 20-day peak
Historical Pattern: Post-major psychological level test ($5000) volatility historically remains elevated 2-3 weeks then resolves directionally; 70% of similar consolidation episodes at prior ATH -10% levels either break down or establish new range within 4 weeks during Fed policy uncertainty windows
Outlook: High volatility regime day 18 typically lasts 10-20 days suggesting potential further normalization into late March post-FOMC with 65% probability of compression below 70th percentile by month-end as market digests Fed guidance
Trading Context: Elevated volatility at 82nd percentile requires wider stops with daily ranges potentially 2.5-3.5% versus normal 1.5-2%; current $5000-5200 range suggests breakouts become reliable once volatility normalizes post-FOMC, but until then price action subject to elevated noise and false signals
Vol Risk/Opportunity: Current high volatility environment at $5062 with GVZ 31+ and historical vol at 82nd percentile suggests asymmetric moves possible: 12% downside risk to $4430 if $5000 fails versus 3-4% upside to $5200 resistance creating unfavorable 3:1 risk-reward; volatility spike increases probability of sharp directional resolution post-FOMC rather than continued consolidation, with breakdown scenario more probable given technical structure deterioration and central bank demand weakness

── PRIMARY RISK ─────────────────────────────────
Breakdown below $5000 psychological support would expose 50-day MA at $4900-4950 triggering stop-loss cascade toward February low at $4430 representing potential 12% downside from current levels
Probability: MEDIUM

── PRIMARY OPPORTUNITY ──────────────────────────
Fed maintains dovish bias at March 18-19 meeting triggering dollar reversal from current 100+ rebound and supporting gold rally back toward $5200-5300 resistance zone within 2-3 weeks
Timeframe: Next 2-3 weeks post-FOMC through early April if Fed confirms easing trajectory resumption and dollar weakness resumes

── NEXT CATALYST ────────────────────────────────
Date: March 18, 2026
Event: Federal Reserve FOMC Meeting decision with 97% market pricing for pause at 3.5-3.75% range before potential Q2 resumption, forward guidance critical for real yield trajectory
Expected Impact: HIGH

═════════════════════════════════════════════════
Source: Macro Agent Desk (macroagentdesk.com)
═════════════════════════════════════════════════

── FULL ANALYSIS ────────────────────────────────
MACRO REGIME CLASSIFICATION: TRANSITIONAL leaning RISK-OFF. Gold trades at $5,061.7 on March 15, 2026, having broken down from the $5,150-5,200 consolidation zone and now testing the psychologically critical $5,000 support level following two consecutive weeks of MISSED BULLISH calls that have materially degraded thesis credibility. The market sits 10% below the January all-time high of $5,626 in a consolidation phase that is showing increasing signs of corrective structure rather than continuation. VIX elevated at 27.19 (above 25 threshold) signals heightened equity market stress that should theoretically support safe-haven gold demand, yet gold has declined in both of the past two weeks despite this backdrop—a clear divergence that demands reassessment. Post-input development identified: Dollar has rebounded sharply to DXY 100+ (from search data showing March 13 at 100.50, up 0.76% and up 3.70% over past month) after prolonged weakness, reversing a key tailwind that supported gold's 2025 rally. This DXY recovery from oversold levels near 97-98 represents a material shift in the inverse correlation dynamic. The Fed meeting on March 18-19 (3 days away) looms as the week's dominant catalyst with 97% probability of a pause priced in, but forward guidance on the pace and timing of future cuts will be critical for real yield trajectory. The fundamental case remains structurally constructive but tactically challenged: real yields at 1.74-1.79% provide baseline support, but the most significant negative development is the collapse in central bank demand to just 5 tonnes in January 2026 versus the 27-tonne monthly average (per World Gold Council March 5 data)—an 81% decline that removes the structural bid floor that underpinned 2025's rally. Technical structure has deteriorated with price breaking below the $5,150 level where consolidation held through early March and now testing $5,000 with next major support at the 50-day MA in the $4,900-4,950 zone. Precious metals typically trend persistently (per Section 3 guidance), requiring at least two consecutive contrary weeks before considering bias flip—we now have exactly that: two consecutive MISSED BULLISH calls with -1.81% and -3.28% moves. The synthesis history shows an 11+ week BULLISH streak that has now produced misses in 2 of the last 4 graded weeks and a net cumulative decline over that period exceeding the 2.41% Average Weekly Move. Applying Rule 4 Thesis Health Score: Last 4 weeks show 2 contrary to BULLISH bias (subtract 1.0), net cumulative move over 4 weeks is approximately -3% which exceeds 1x the 2.41% Average Weekly Move (subtract additional 1.0), and consecutive BULLISH bias streak is well beyond the 8-week Bias Review After threshold (subtract 0.5 for excessive persistence). This produces a material conviction reduction. The market is at an inflection point: the $5,000 level represents the paradigm shift from 2025 where four-thousand became support rather than resistance, but failure here would invalidate the consolidation-as-continuation thesis and likely trigger accelerated liquidation toward $4,800-4,900. With the FOMC meeting 3 days away, elevated volatility, two consecutive misses degrading thesis credibility, and insufficient fresh bullish catalysts to justify conviction, the appropriate stance is tactical caution. The 2.41% Average Weekly Move suggests gold could move $120+ in either direction this week, well above the 0.30% Noise Floor, but directional conviction is low given conflicting signals: VIX fear supports gold, but dollar strength and central bank demand weakness create headwinds, while technical structure shows breakdown rather than breakout momentum. Risk-reward is asymmetric to the downside if $5,000 fails (12% to $4,430) versus limited upside to $5,200 resistance (3%) without a catalyst. The path of least resistance heading into the FOMC is consolidation with downside bias.


