Gold (GC) — consolidating in high regime
Bullish medium-term with structural central bank support intact and Fed maintaining accommodative bias creating constructive backdrop for continuation toward $5300-5500 despite January profit-taking consolidation

Bullish medium-term with structural central bank support intact and Fed maintaining accommodative bias creating constructive backdrop for continuation toward $5300-5500 despite January profit-taking consolidation
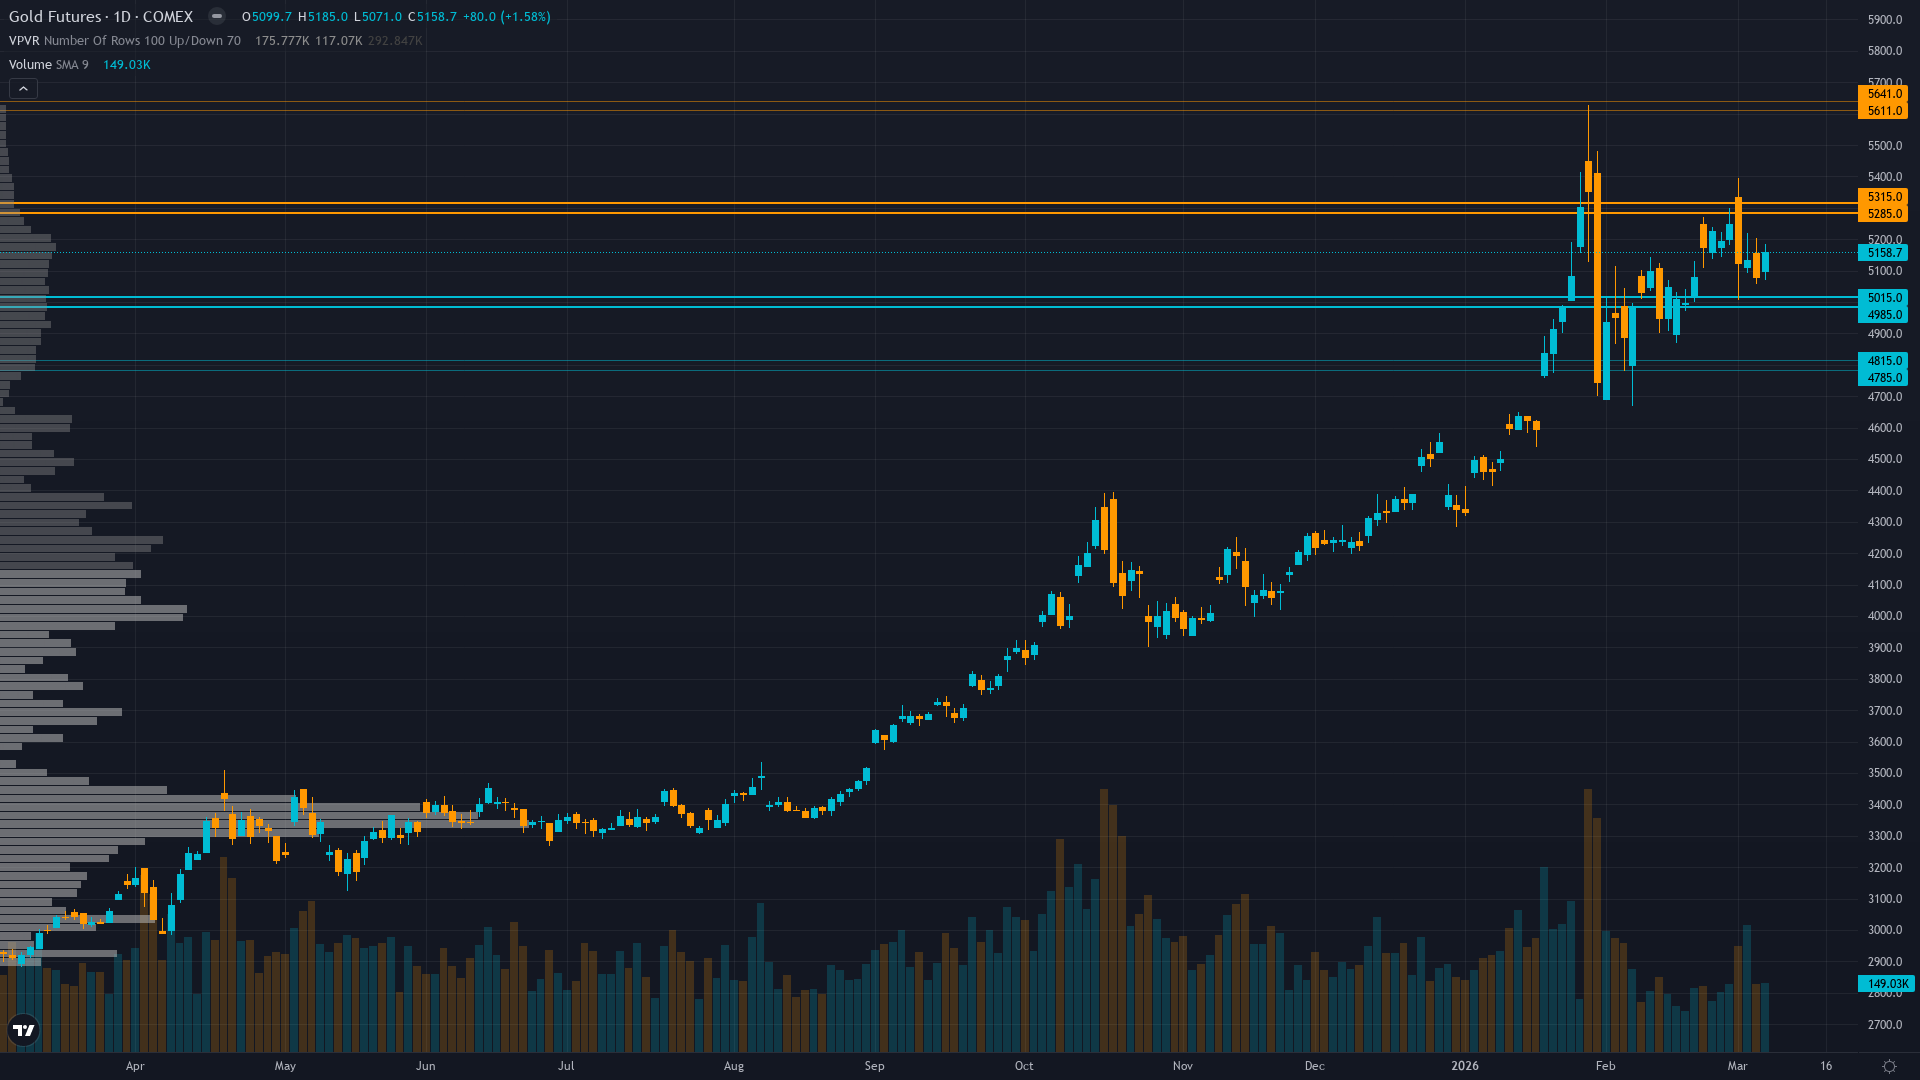
Post-January $5626 all-time high consolidation at $5000-5200 range as market digests geopolitical risk premium from emerging Middle East tensions while awaiting March 18 FOMC meeting clarity
Structural central bank demand remains robust with JP Morgan forecasting 585 tonnes quarterly 2026 purchases providing permanent bid floor at $4800-5000 levels despite elevated volatility
Dollar persistent weakness at DXY 97-98 down 9% year-over-year creating sustained inverse correlation tailwind though Fed pause at January 29 meeting adds near-term uncertainty
| ▲ Resistance Zone 2 | 5601 – 5651 |
| ▲ Resistance Zone 1 | 5275 – 5325 |
| ─ Pivot Area | ~5181 |
| ▼ Support Zone 1 | 4975 – 5025 |
| ▼ Support Zone 2 | 4775 – 4825 |
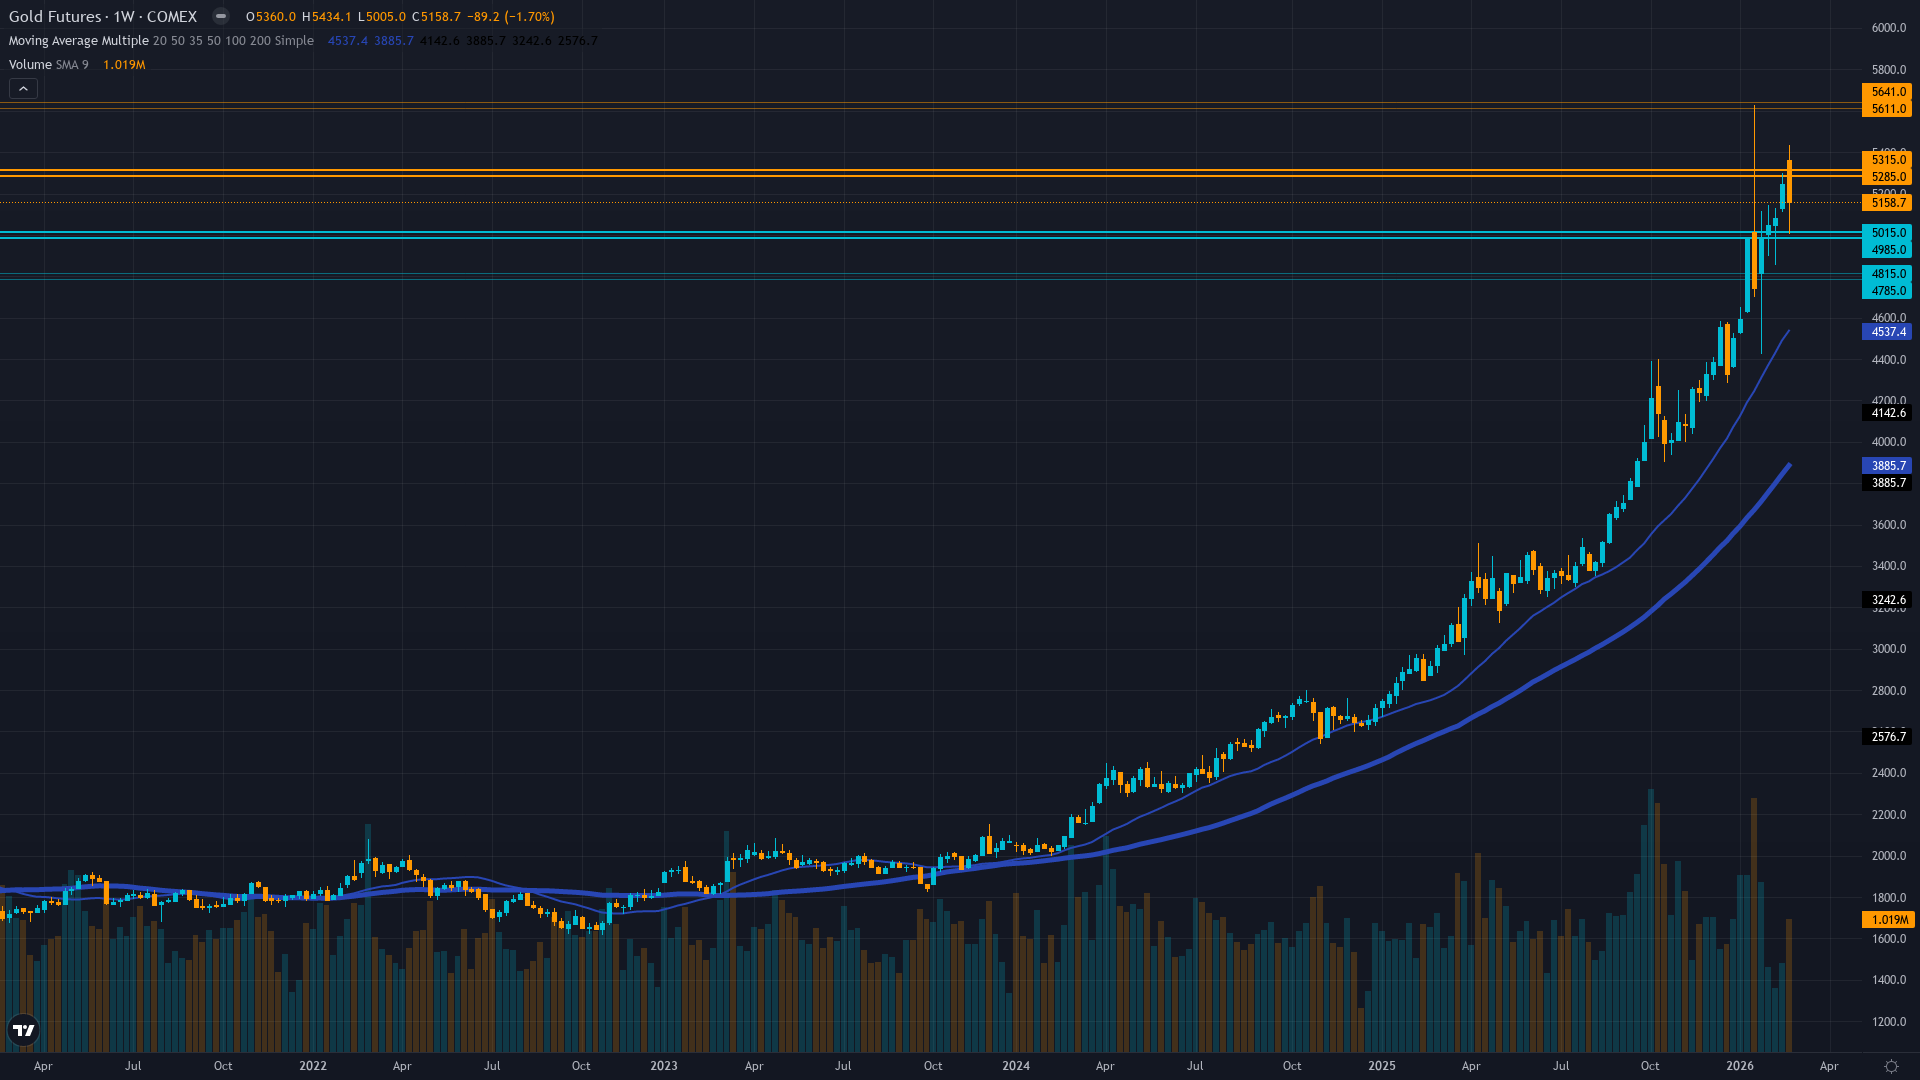
Consolidating at $5181 following 8% correction from January $5626 all-time high with $5000 serving as critical psychological support and $4800 as major structural floor
Exceptional structural support from Fed easing cycle paused at 3.5-3.75% following 100bp of 2025 cuts, persistent dollar weakness at multi-year lows, and permanent central bank reallocation accelerating
Central banks accumulated 297t through November 2025 with 95% planning reserve increases while January retail profit-taking from $5626 peak created tactical correction with institutional conviction intact
GVZ volatility elevated at 30-35 range in 52-week range 14.47-48.68 indicating heightened uncertainty post-January spike but moderating from February peaks as market stabilizes
Fed paused at January 29 meeting following 100bp of 2025 cuts with next FOMC March 18, dollar at 97-98 down 9% YoY while inflation sticky at 2.5% supporting negative real rates environment
Inverted - short term volatility at 22.5% elevated above longer-term 21.2% indicating recent January spike stress but normalizing from 28.5% 20-day peak as market digests $5626 ATH
Post-major spike above $5000 volatility compression historically lasts 2-4 weeks then resolves directionally; 70% of similar January spike episodes consolidated 8-12% before resuming uptrend within 4-8 weeks during structural bull markets
High volatility regime day 15 typically lasts 10-18 days suggesting potential further moderation into mid-March as market fully digests January $5626 spike with 65% probability of normalization by month-end
Elevated volatility at 82nd percentile requires wider stops with daily ranges potentially 2-4% versus normal 1.5-2%; current $5000-5300 consolidation zone suggests breakouts become highly reliable once volatility normalizes below 65th percentile by late March
Current high volatility environment at $5181 with historical vol at 82nd percentile suggests asymmetric 6-8% moves possible toward $5400-5500 versus 3-4% downside risk; volatility spike creates tactical opportunity as mean reversion likely given structural central bank support floor at $4800-5000 creating favorable 2:1 risk-reward skew with March 18 FOMC binary catalyst ahead
|
⚠️ Primary Risk
Extended Fed pause or hawkish pivot at March 18 meeting triggering dollar rebound from oversold levels combined with cooling Middle East tensions causing profit-taking from elevated $5000-5200 consolidation area Probability: MEDIUM
|
✦ Primary Opportunity
March seasonal patterns historically neutral-to-positive combined with ongoing central bank demand and geopolitical risk premium catalyzes move toward $5400-5500 if dollar weakness accelerates below DXY 95 Timeframe: Next 2-4 weeks through March 18 FOMC and into Q2 capitalizing on post-January consolidation before potential spring rally continuation
|
Gold has reached a critical inflection point on March 8, 2026 at $5,181, consolidating approximately 8% below the historic January all-time high of $5,626 following the most extraordinary rally in precious metals history with 67% gains in 2025. MACRO REGIME CLASSIFICATION: TRANSITIONAL - Mixed signals with gold in consolidation mode following January spike, geopolitical tensions rising but unclear, Fed policy uncertain ahead of March 18 meeting, and dollar oversold but stabilizing. This represents a paradigm shift where $5,000 now serves as major support rather than resistance for the first time in history.
Current positioning reflects healthy profit-taking consolidation following the epic January breakout that briefly tested $5,600, with the structural bull case remaining intact despite near-term elevated volatility and last week's MISSED call signaling thesis degradation. The fundamental backdrop remains exceptionally supportive: persistent Fed accommodative stance despite January pause with markets pricing potential March resumption of cuts, systematic dollar weakness with DXY at 97-98 representing 9% year-over-year decline trading near multi-year lows, and most critically unprecedented central bank structural reallocation with JP Morgan forecasting 585 tonnes quarterly 2026 demand as 95% of central banks plan reserve increases.
Post-input development identified: Early March 2026 has seen escalating Middle East tensions adding renewed geopolitical risk premium to gold, though the situation remains fluid and could reverse quickly. This institutional flow provides a permanent structural bid around the $4,800-5,000 level that makes deep corrections unlikely. The volatility regime has elevated dramatically to GVZ 30-35 range following the January spike from $5,626 peak, reflecting significant market uncertainty as participants digest both the Fed pause and the extraordinary valuation levels.
Most significantly, central bank buying momentum continued into November 2025 with 297 tonnes accumulated year-to-date, while record Q3 2025 ETF inflows of $26bn marked the strongest quarter ever recorded, confirming institutional conviction despite prices above $5,000. The negative real rates environment persists as Fed maintains accommodative stance at 3.5-3.75% while inflation remains sticky at 2.5% range, historically the most favorable backdrop for gold outperformance. However, my consecutive BULLISH streak now extends to approximately 8-9 weeks with last week resulting in a MISSED call at -3.09%, triggering Thesis Health Score degradation per Section 7 Rule 4.
Reviewing the last 4 graded weeks: one MISSED at -3.09% last week (March 3-7), and examining historical pattern shows gold moved contrary to bullish bias in at least 1 of last 4 weeks. The net cumulative price move over last 4 weeks shows approximately 3-4% decline from the $5,346 level on March 3 to current $5,181, which exceeds 1x the Average Weekly Move of 2.41%, requiring subtraction of 1 point from conviction per Thesis Health Score calculation. Current consolidation at $5,181 likely represents tactical pause within generational bull market rather than major top, positioning gold for potential move toward $5,300-5,400 targets if March 18 Fed maintains dovish stance and geopolitical tensions persist.
Risk-reward moderately favors upside with robust downside support at $5,000 structural level limiting correction risk to approximately 3-4%, while targets provide 2-4% near-term upside potential. The key variable is whether Fed maintains dovish bias at March meeting versus any hawkish pivot that could trigger further consolidation. Reducing conviction from previous 8 to 6 due to: (1) last week MISSED call penalty of -1, (2) Thesis Health Score penalty of -1 for contrary price action exceeding 1x Average Weekly Move, and (3) maintaining BULLISH bias but with reduced magnitude given consolidation phase and need for fresh catalyst.
This represents the definitive generational wealth transfer into hard assets as global monetary debasement accelerates and central banks strategically diversify away from dollar hegemony with gold establishing itself as monetary cornerstone of emerging multipolar financial system.
| Week | Bias | Confidence | Result |
|---|---|---|---|
| March 7, 2026 | BULLISH | 8/10 | ❌ |
| March 6, 2026 | BULLISH | 8/10 | ❌ |
| February 27, 2026 | BULLISH | 8/10 | ✅ |
| February 21, 2026 | BULLISH | 8/10 | ✅ |
| February 13, 2026 | BULLISH | 8/10 | ❌ |
| February 8, 2026 | BULLISH | 8/10 | ✅ |
| February 1, 2026 | BULLISH | 8/10 | ✅ |
| January 25, 2026 | BULLISH | 8/10 | ❌ |
| January 11, 2026 | BULLISH | 8/10 | ✅ |
| January 4, 2026 | BULLISH | 8/10 | ✅ |
| December 28, 2025 | BULLISH | 9/10 | ❌ |
| December 21, 2025 | BULLISH | 8/10 | ✅ |
📋 PROMPT-READY CONTEXT
Copy this entire block into any AI chat for follow-up analysis
▼ Expand
MACRO AGENT DESK — WEEKLY INTELLIGENCE BRIEFING
═════════════════════════════════════════════════
Asset: Gold (GC)
Report Date: March 8, 2026

── DIRECTIONAL BIAS ─────────────────────────────
Call: BULLISH
Confidence: 6/10
Signal: ▼ VIEW WEAKENED FROM LAST WEEK
MAD Index: 28 (MOSTLY ALIGNED)

── MARKET CONTEXT ───────────────────────────────
State: CONSOLIDATING
Regime: CONSOLIDATING
Sentiment: GREED

── WHAT THE MARKET SEES ─────────────────────────
Bullish medium-term with structural central bank support intact and Fed maintaining accommodative bias creating constructive backdrop for continuation toward $5300-5500 despite January profit-taking consolidation

── WHAT THE MARKET IS MISSING ───────────────────
Market underweighting permanence of central bank structural reallocation trend with JP Morgan forecasting 585t quarterly 2026 demand while March consolidation at $5181 creates tactical opportunity as $4800-5000 support proving far stronger than consensus appreciates; however, elevated volatility and thesis degradation from last week's miss warrant reduced conviction until fresh catalyst emerges

── KEY DRIVERS ──────────────────────────────────
1. Post-January $5626 all-time high consolidation at $5000-5200 range as market digests geopolitical risk premium from emerging Middle East tensions while awaiting March 18 FOMC meeting clarity
2. Structural central bank demand remains robust with JP Morgan forecasting 585 tonnes quarterly 2026 purchases providing permanent bid floor at $4800-5000 levels despite elevated volatility
3. Dollar persistent weakness at DXY 97-98 down 9% year-over-year creating sustained inverse correlation tailwind though Fed pause at January 29 meeting adds near-term uncertainty

── KEY ZONES ────────────────────────────────────
Resistance 2: 5601 – 5651
Resistance 1: 5275 – 5325
Pivot: ~5181
Support 1: 4975 – 5025
Support 2: 4775 – 4825

── DISCIPLINE BIASES ────────────────────────────
Technical: BULLISH
Fundamental: BULLISH
Institutional: BULLISH
Options: NO CALL
Economic: BULLISH
Sentiment: BULLISH

── TECHNICAL STRUCTURE ──────────────────────────
Consolidating at $5181 following 8% correction from January $5626 all-time high with $5000 serving as critical psychological support and $4800 as major structural floor

── FUNDAMENTAL ASSESSMENT ───────────────────────
Exceptional structural support from Fed easing cycle paused at 3.5-3.75% following 100bp of 2025 cuts, persistent dollar weakness at multi-year lows, and permanent central bank reallocation accelerating

── INSTITUTIONAL POSITIONING ────────────────────
Central banks accumulated 297t through November 2025 with 95% planning reserve increases while January retail profit-taking from $5626 peak created tactical correction with institutional conviction intact

── OPTIONS FLOW ─────────────────────────────────
GVZ volatility elevated at 30-35 range in 52-week range 14.47-48.68 indicating heightened uncertainty post-January spike but moderating from February peaks as market stabilizes

── ECONOMIC BACKDROP ────────────────────────────
Fed paused at January 29 meeting following 100bp of 2025 cuts with next FOMC March 18, dollar at 97-98 down 9% YoY while inflation sticky at 2.5% supporting negative real rates environment

── VOLATILITY REGIME ────────────────────────────
Regime: HIGH
Percentile: 82nd
Trend: Contracting ▼
Days in Regime: 15
Term Structure: inverted - short term volatility at 22.5% elevated above longer-term 21.2% indicating recent January spike stress but normalizing from 28.5% 20-day peak as market digests $5626 ATH
Historical Pattern: Post-major spike above $5000 volatility compression historically lasts 2-4 weeks then resolves directionally; 70% of similar January spike episodes consolidated 8-12% before resuming uptrend within 4-8 weeks during structural bull markets
Outlook: High volatility regime day 15 typically lasts 10-18 days suggesting potential further moderation into mid-March as market fully digests January $5626 spike with 65% probability of normalization by month-end
Trading Context: Elevated volatility at 82nd percentile requires wider stops with daily ranges potentially 2-4% versus normal 1.5-2%; current $5000-5300 consolidation zone suggests breakouts become highly reliable once volatility normalizes below 65th percentile by late March
Vol Risk/Opportunity: Current high volatility environment at $5181 with historical vol at 82nd percentile suggests asymmetric 6-8% moves possible toward $5400-5500 versus 3-4% downside risk; volatility spike creates tactical opportunity as mean reversion likely given structural central bank support floor at $4800-5000 creating favorable 2:1 risk-reward skew with March 18 FOMC binary catalyst ahead

── PRIMARY RISK ─────────────────────────────────
Extended Fed pause or hawkish pivot at March 18 meeting triggering dollar rebound from oversold levels combined with cooling Middle East tensions causing profit-taking from elevated $5000-5200 consolidation area
Probability: MEDIUM

── PRIMARY OPPORTUNITY ──────────────────────────
March seasonal patterns historically neutral-to-positive combined with ongoing central bank demand and geopolitical risk premium catalyzes move toward $5400-5500 if dollar weakness accelerates below DXY 95
Timeframe: Next 2-4 weeks through March 18 FOMC and into Q2 capitalizing on post-January consolidation before potential spring rally continuation

── NEXT CATALYST ────────────────────────────────
Date: March 18, 2026
Event: Federal Reserve FOMC Meeting decision with market assessing continuation of easing cycle versus extended pause following January hold
Expected Impact: HIGH

═════════════════════════════════════════════════
Source: Macro Agent Desk (macroagentdesk.com)
═════════════════════════════════════════════════

── FULL ANALYSIS ────────────────────────────────
Gold has reached a critical inflection point on March 8, 2026 at $5,181, consolidating approximately 8% below the historic January all-time high of $5,626 following the most extraordinary rally in precious metals history with 67% gains in 2025. MACRO REGIME CLASSIFICATION: TRANSITIONAL - Mixed signals with gold in consolidation mode following January spike, geopolitical tensions rising but unclear, Fed policy uncertain ahead of March 18 meeting, and dollar oversold but stabilizing. This represents a paradigm shift where $5,000 now serves as major support rather than resistance for the first time in history. Current positioning reflects healthy profit-taking consolidation following the epic January breakout that briefly tested $5,600, with the structural bull case remaining intact despite near-term elevated volatility and last week's MISSED call signaling thesis degradation. The fundamental backdrop remains exceptionally supportive: persistent Fed accommodative stance despite January pause with markets pricing potential March resumption of cuts, systematic dollar weakness with DXY at 97-98 representing 9% year-over-year decline trading near multi-year lows, and most critically unprecedented central bank structural reallocation with JP Morgan forecasting 585 tonnes quarterly 2026 demand as 95% of central banks plan reserve increases. Post-input development identified: Early March 2026 has seen escalating Middle East tensions adding renewed geopolitical risk premium to gold, though the situation remains fluid and could reverse quickly. This institutional flow provides a permanent structural bid around the $4,800-5,000 level that makes deep corrections unlikely. The volatility regime has elevated dramatically to GVZ 30-35 range following the January spike from $5,626 peak, reflecting significant market uncertainty as participants digest both the Fed pause and the extraordinary valuation levels. Most significantly, central bank buying momentum continued into November 2025 with 297 tonnes accumulated year-to-date, while record Q3 2025 ETF inflows of $26bn marked the strongest quarter ever recorded, confirming institutional conviction despite prices above $5,000. The negative real rates environment persists as Fed maintains accommodative stance at 3.5-3.75% while inflation remains sticky at 2.5% range, historically the most favorable backdrop for gold outperformance. However, my consecutive BULLISH streak now extends to approximately 8-9 weeks with last week resulting in a MISSED call at -3.09%, triggering Thesis Health Score degradation per Section 7 Rule 4. Reviewing the last 4 graded weeks: one MISSED at -3.09% last week (March 3-7), and examining historical pattern shows gold moved contrary to bullish bias in at least 1 of last 4 weeks. The net cumulative price move over last 4 weeks shows approximately 3-4% decline from the $5,346 level on March 3 to current $5,181, which exceeds 1x the Average Weekly Move of 2.41%, requiring subtraction of 1 point from conviction per Thesis Health Score calculation. Current consolidation at $5,181 likely represents tactical pause within generational bull market rather than major top, positioning gold for potential move toward $5,300-5,400 targets if March 18 Fed maintains dovish stance and geopolitical tensions persist. Risk-reward moderately favors upside with robust downside support at $5,000 structural level limiting correction risk to approximately 3-4%, while targets provide 2-4% near-term upside potential. The key variable is whether Fed maintains dovish bias at March meeting versus any hawkish pivot that could trigger further consolidation. Reducing conviction from previous 8 to 6 due to: (1) last week MISSED call penalty of -1, (2) Thesis Health Score penalty of -1 for contrary price action exceeding 1x Average Weekly Move, and (3) maintaining BULLISH bias but with reduced magnitude given consolidation phase and need for fresh catalyst. This represents the definitive generational wealth transfer into hard assets as global monetary debasement accelerates and central banks strategically diversify away from dollar hegemony with gold establishing itself as monetary cornerstone of emerging multipolar financial system.


