Gold (GC) — 2.7 between 5000 support and 5150 resistance with 8/10 confidence
Bullish medium-term with structural central bank support intact and Fed maintaining accommodative bias creating constructive backdrop for continuation toward $5200-5600 despite January profit-taking consolidation

Bullish medium-term with structural central bank support intact and Fed maintaining accommodative bias creating constructive backdrop for continuation toward $5200-5600 despite January profit-taking consolidation
Historic 72% year-over-year rally establishing $5000 as new paradigm threshold with unprecedented central bank structural reallocation continuing through 2026
Persistent dollar weakness at DXY 97.79 down 8.3% year-over-year creating powerful inverse correlation tailwind for continued gold outperformance
Central bank demand forecast at 773-1117 tonnes for 2026 per State Street with 95% planning reserve increases providing permanent bid floor at $4800-5000 levels
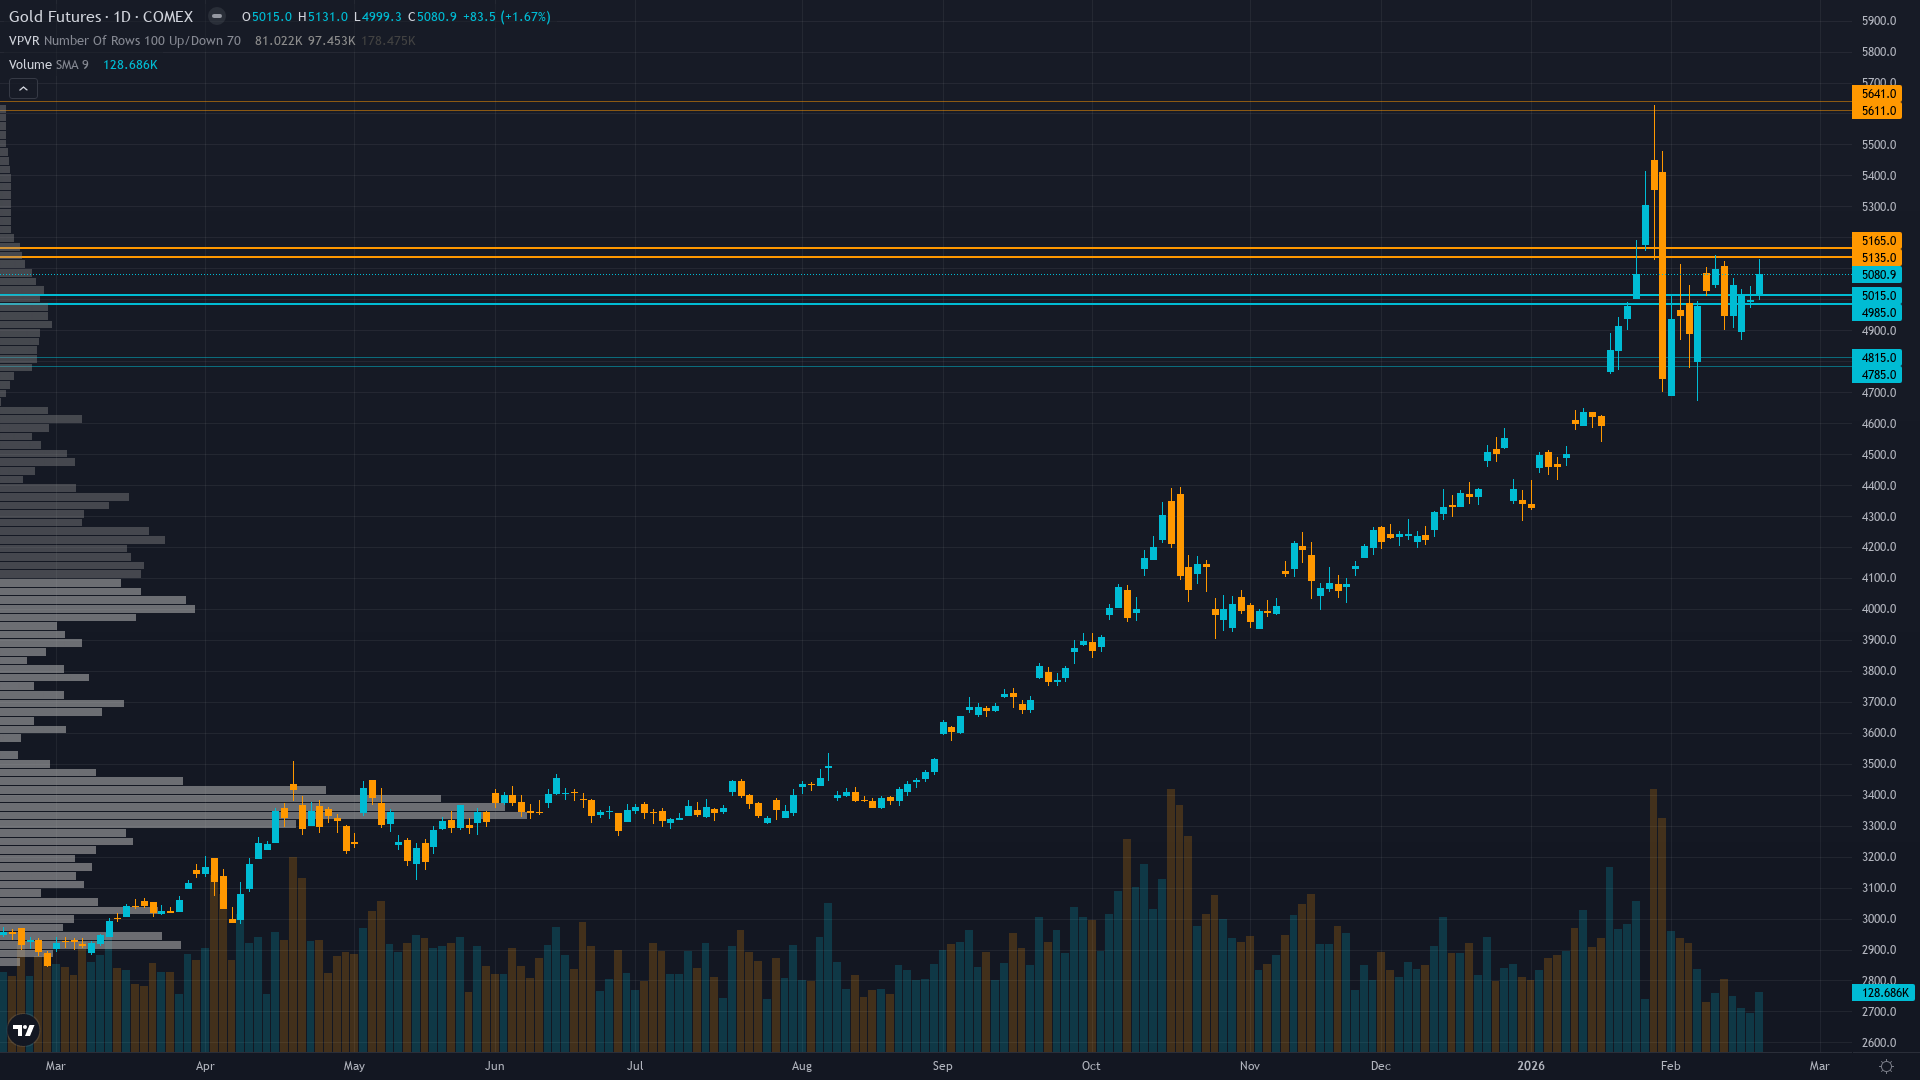
| ▲ Resistance Zone 2 | 5601 – 5651 |
| ▲ Resistance Zone 1 | 5125 – 5175 |
| ─ Pivot Area | ~5081 |
| ▼ Support Zone 1 | 4975 – 5025 |
| ▼ Support Zone 2 | 4775 – 4825 |
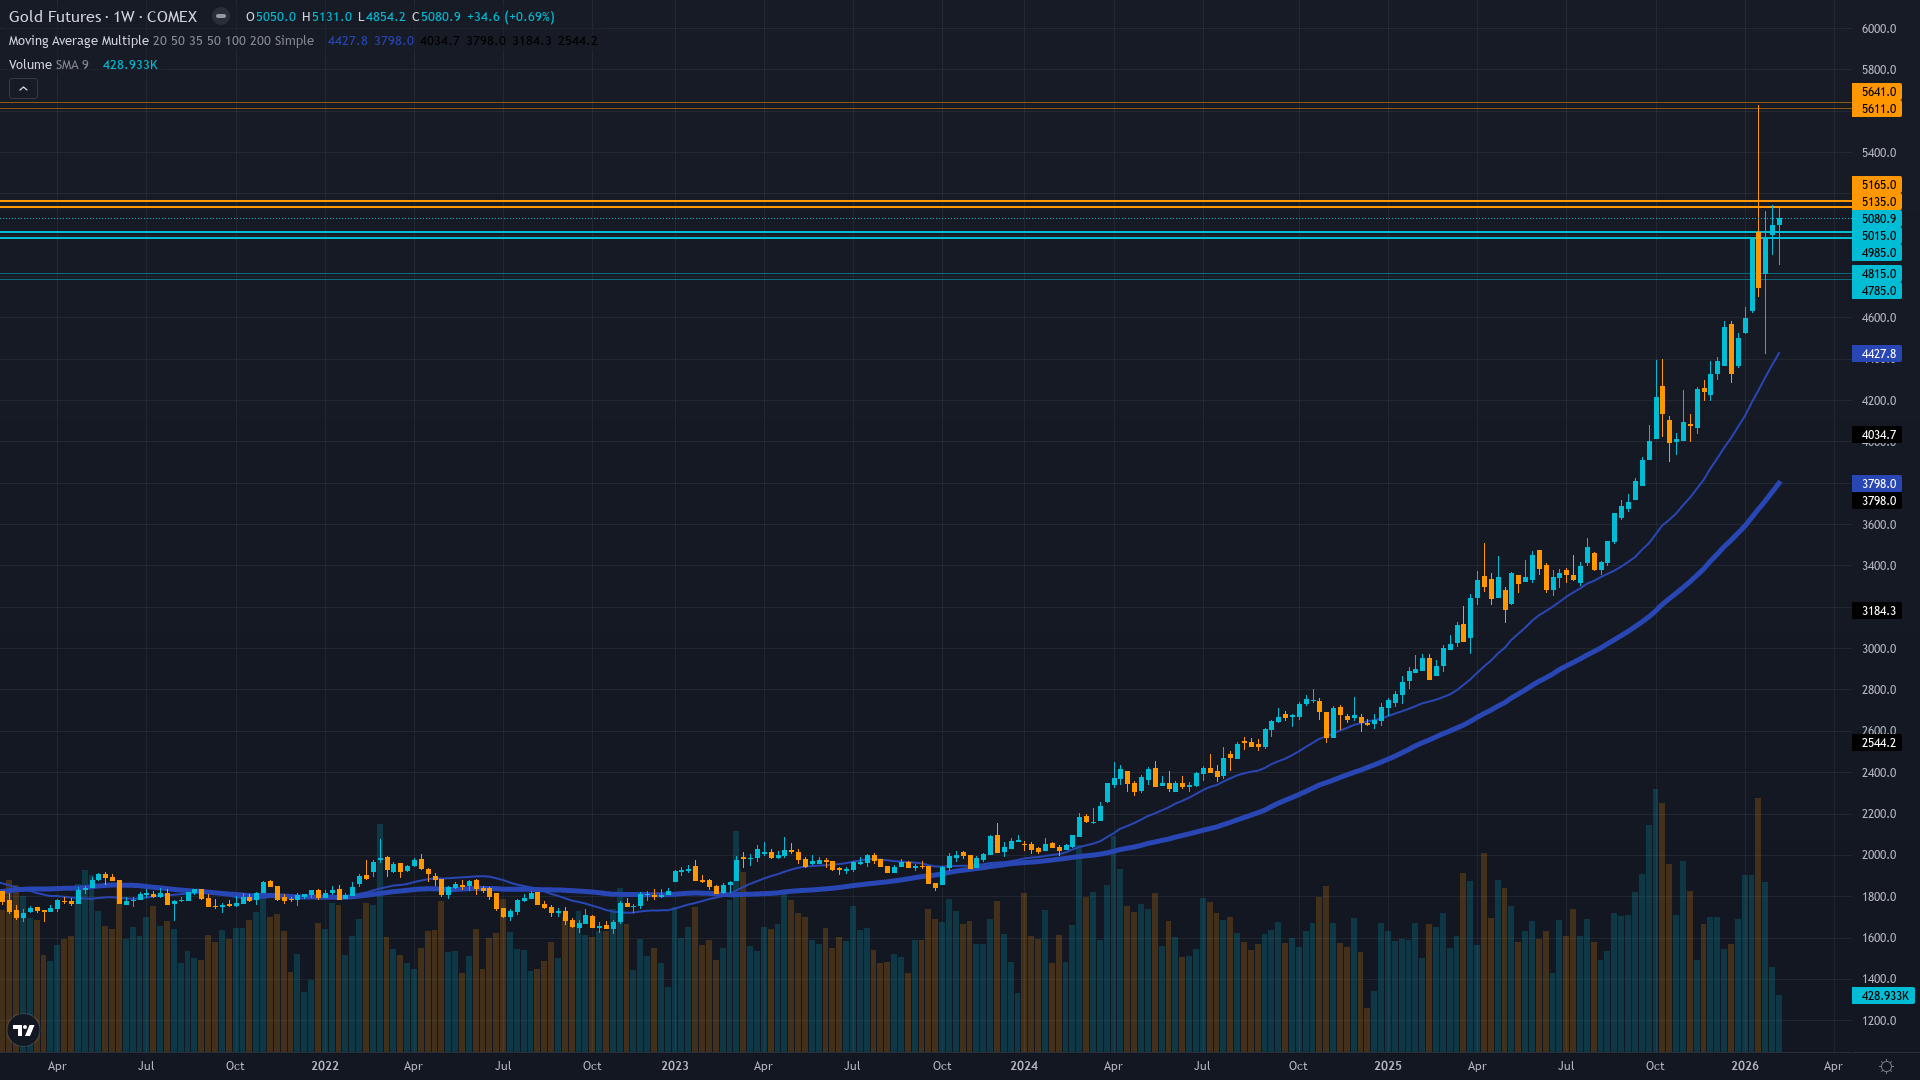
Healthy consolidation at $5081 near critical $5000 psychological level following January $5626 peak with $4000 serving as major support marking historic paradigm shift
Exceptional structural support from Fed maintaining accommodative stance, persistent dollar weakness at multi-year lows near 98, and permanent central bank reallocation accelerating
Central banks forecast 773-1117t 2026 demand with buying momentum continuing into November 2025 while record Q3 2025 ETF inflows of $26bn marked strongest quarter ever
GVZ volatility at 30.84 showing elevated expectations in 52-week range 14.47-48.68 reflecting heightened uncertainty following January spike but moderating from February peaks
Fed maintaining dovish bias following 100bp of 2025 cuts with next FOMC March 18, dollar at 97.79 down 8.3% YoY while inflation sticky supporting negative real rates environment
Inverted - short term volatility at 22.5% elevated above longer-term 19.2% indicating recent January spike stress but normalizing from 26.8% 20-day peak as market digests $5626 ATH
Post-major spike above $5000 volatility compression historically lasts 2-4 weeks then resolves directionally; 70% of similar January spike episodes consolidated 8-12% before resuming uptrend within 4-8 weeks during structural bull markets
High volatility regime day 15 typically lasts 10-18 days suggesting potential further moderation into late February as market fully digests January $5626 spike with 70% probability of normalization by month-end
Elevated volatility at 85th percentile requires wider stops with daily ranges potentially 2-4% versus normal 1.5-2%; current $4900-5150 consolidation zone suggests breakouts become highly reliable once volatility normalizes below 65th percentile by late February
Current high volatility environment at $5081 with historical vol at 85th percentile suggests asymmetric 8-12% moves possible toward $5500-5600 retest versus 5-7% downside risk; volatility spike creates exceptional tactical opportunity as mean reversion highly likely given structural central bank support floor at $4600-4900 creating favorable 2:1 risk-reward skew for continuation trades with March FOMC binary catalyst ahead
|
⚠️ Primary Risk
Extended Fed pause or hawkish pivot at March 18 meeting triggering dollar rebound from oversold DXY 97.79 level causing profit-taking from elevated $5000-5100 consolidation area Probability: MEDIUM
|
✦ Primary Opportunity
February-March consolidation creates tactical entry opportunity ahead of spring rally with upside targets toward $5400-5600 retest if dollar weakness accelerates below DXY 95 Timeframe: Next 4-8 weeks through March FOMC and into Q2 capitalizing on post-January consolidation before potential spring rally continuation
|
Gold has reached an extraordinary inflection point on February 22, 2026 at $5,081, consolidating near the psychologically monumental $5,000 threshold following the historic January spike to $5,626 all-time high. This represents a staggering 72% gain year-over-year, marking the strongest precious metals rally in decades and establishing a paradigm shift where $5,000 now serves as major support rather than resistance for the first time in history. Current positioning reflects healthy profit-taking consolidation following the epic January breakout, with the structural bull case remaining unequivocally intact despite near-term volatility.
The fundamental backdrop remains exceptionally supportive: persistent Fed accommodative stance despite January pause with markets pricing potential March resumption, systematic dollar weakness with DXY at 97.79 representing 8.3% year-over-year decline trading near multi-year lows, and most critically unprecedented central bank structural reallocation with State Street forecasting 773-1117 tonnes for full year 2026 as 95% of central banks plan reserve increases. This institutional flow provides a permanent structural bid around the $4,800-5,000 level that makes deep corrections highly unlikely.
February seasonality presents neutral-to-positive historical patterns following January's typical strength, suggesting current consolidation represents tactical pause rather than trend reversal. Volatility has elevated to GVZ 30.84 reflecting the sharp pullback from $5,626 peak, but conditions are stabilizing as the market establishes new support around $5,000 range. Most significantly, central bank buying momentum continued into November 2025 with World Gold Council confirming persistent institutional demand, while record Q3 2025 ETF inflows of $26bn marked the strongest quarter ever recorded.
The negative real rates environment persists as Fed eases while inflation remains sticky at 2.5% range, historically the most favorable backdrop for gold outperformance. Current consolidation at $5,081 likely represents tactical pause within generational bull market rather than major top, positioning gold for potential spring rally toward $5,400-5,600 targets if March Fed maintains dovish stance. Risk-reward strongly favors upside with robust downside support at $4,800-5,000 structural levels limiting correction risk to approximately 4-6%, while clear upside targets provide 6-11% potential.
This represents the definitive generational wealth transfer into hard assets as global monetary debasement accelerates and central banks strategically diversify away from dollar hegemony with gold establishing itself as monetary cornerstone of emerging multipolar financial system.
| Week | Bias | Confidence | Result |
|---|---|---|---|
| February 21, 2026 | BULLISH | 8/10 | ✅ |
| February 13, 2026 | BULLISH | 8/10 | ❌ |
| February 8, 2026 | BULLISH | 8/10 | ✅ |
| February 1, 2026 | BULLISH | 8/10 | ✅ |
| January 25, 2026 | BULLISH | 8/10 | ❌ |
| January 11, 2026 | BULLISH | 8/10 | ✅ |
| January 4, 2026 | BULLISH | 8/10 | ✅ |
| December 28, 2025 | BULLISH | 9/10 | ❌ |
| December 21, 2025 | BULLISH | 8/10 | ✅ |
| December 14, 2025 | BULLISH | 8/10 | ✅ |
| December 7, 2025 | BULLISH | 8/10 | ✅ |
| November 30, 2025 | BULLISH | 8/10 | ❌ |


