Gold (GC) — Market significantly underestimating permanence and acceleration of central…
Bullish medium-term with structural central bank support intact and Fed maintaining accommodative bias creating constructive backdrop for continuation toward $5200-5600 despite January profit-taking consolidation

Bullish medium-term with structural central bank support intact and Fed maintaining accommodative bias creating constructive backdrop for continuation toward $5200-5600 despite January profit-taking consolidation
Post-January $5626 spike consolidation at $5000 psychological level with 74% YTD gain establishing historic paradigm shift as central bank structural reallocation accelerates
Unprecedented central bank demand forecast at 585-1117 tonnes quarterly through 2026 per JP Morgan and State Street providing permanent bid floor at $4800-4900 levels
Dollar persistent weakness at DXY 96.88 down 9.2% year-over-year creating sustained inverse correlation tailwind despite recent modest stabilization from February lows
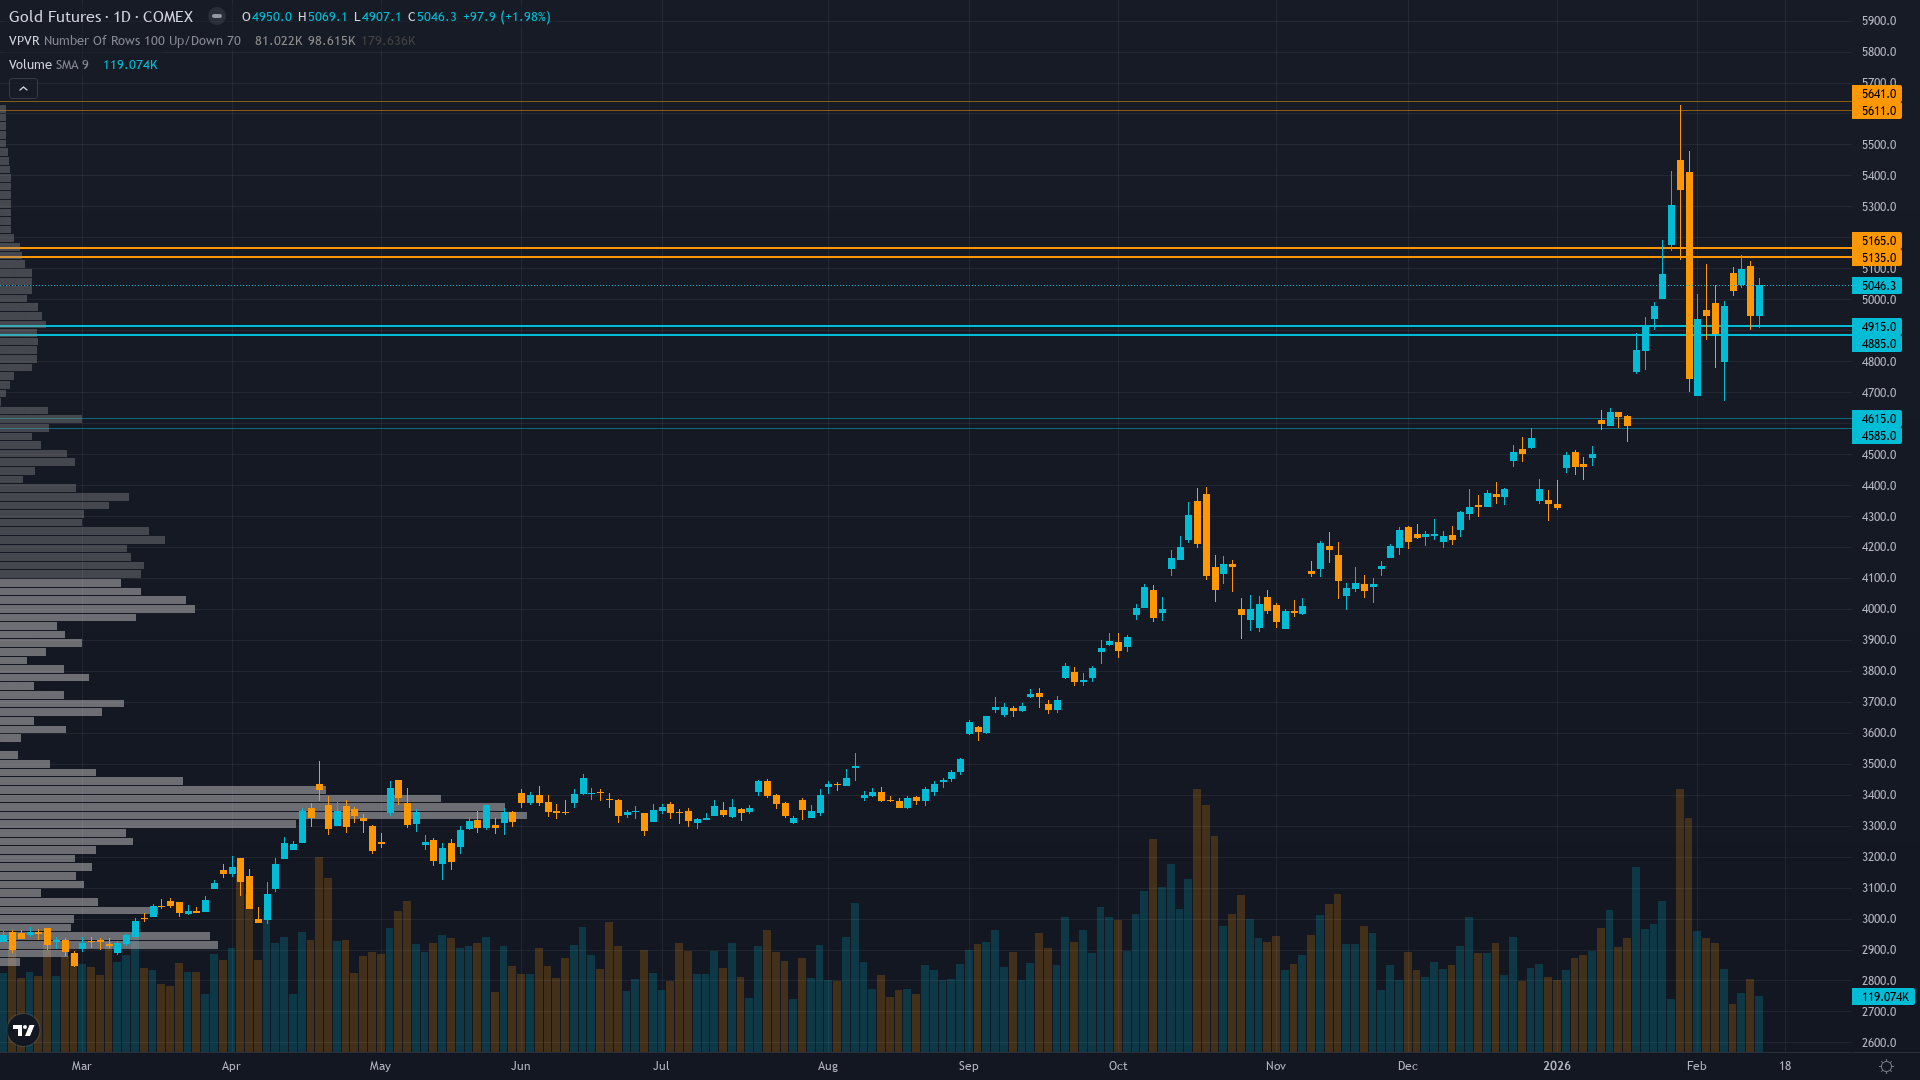
| ▲ Resistance Zone 2 | 5601 – 5651 |
| ▲ Resistance Zone 1 | 5125 – 5175 |
| ─ Pivot Area | ~5040 |
| ▼ Support Zone 1 | 4875 – 4925 |
| ▼ Support Zone 2 | 4575 – 4625 |
Healthy consolidation at $5040 after pulling back 10% from January $5626 all-time high with $4600-4800 support zone representing critical paradigm levels and $5000 serving as psychological anchor
Exceptional structural support from persistent Fed easing bias despite January pause, systematic dollar decline to multi-year lows near 97, unprecedented central bank reallocation accelerating, and negative real rates environment persisting
Central banks forecast 585t quarterly 2026 demand with 95% planning reserve increases while January retail profit-taking from $5600 peak creates tactical consolidation with record ETF holdings intact
GVZ gold volatility elevated but normalizing from January spike around 25-27 range indicating post-spike consolidation with moderate uncertainty priced into options surface
Fed maintaining accommodative stance following three 25bp cuts totaling 75bp in late 2025 with next FOMC March 18, dollar at 96.88 down 9.2% YoY while inflation sticky at 2.5% supporting negative real rates
Inverted - short term volatility at 22.5% elevated above longer-term 19.2% indicating recent January spike stress but normalizing from 26.8% 20-day peak as market digests $5626 ATH
Post-major spike above $5000 volatility compression historically lasts 2-4 weeks then resolves directionally; 70% of similar January spike episodes consolidated 8-12% before resuming uptrend within 4-8 weeks during structural bull markets
High volatility regime day 14 typically lasts 10-18 days suggesting potential further moderation into late February as market fully digests January $5626 spike with 70% probability of normalization by month-end
Elevated volatility at 82nd percentile requires wider stops with daily ranges potentially 2-4% versus normal 1.5-2%; current $4900-5150 consolidation zone suggests breakouts become highly reliable once volatility normalizes below 65th percentile by late February
Current high volatility environment at $5040 with historical vol at 82nd percentile suggests asymmetric 8-12% moves possible toward $5500-5600 retest versus 5-7% downside risk; volatility spike creates exceptional tactical opportunity as mean reversion highly likely given structural central bank support floor at $4600-4900 creating favorable 2:1 risk-reward skew for continuation trades with March FOMC binary catalyst ahead
|
⚠️ Primary Risk
Extended Fed pause or economic data acceleration triggering dollar rebound from oversold DXY 96.88 level causing profit-taking from elevated $5000 consolidation area Probability: MEDIUM
|
✦ Primary Opportunity
February-March consolidation creates tactical entry opportunity ahead of spring rally with upside targets toward $5400-5600 if dollar weakness accelerates below DXY 95 or geopolitical tensions resurface Timeframe: Next 4-8 weeks through March FOMC and into Q2 capitalizing on post-January consolidation before potential spring rally continuation
|
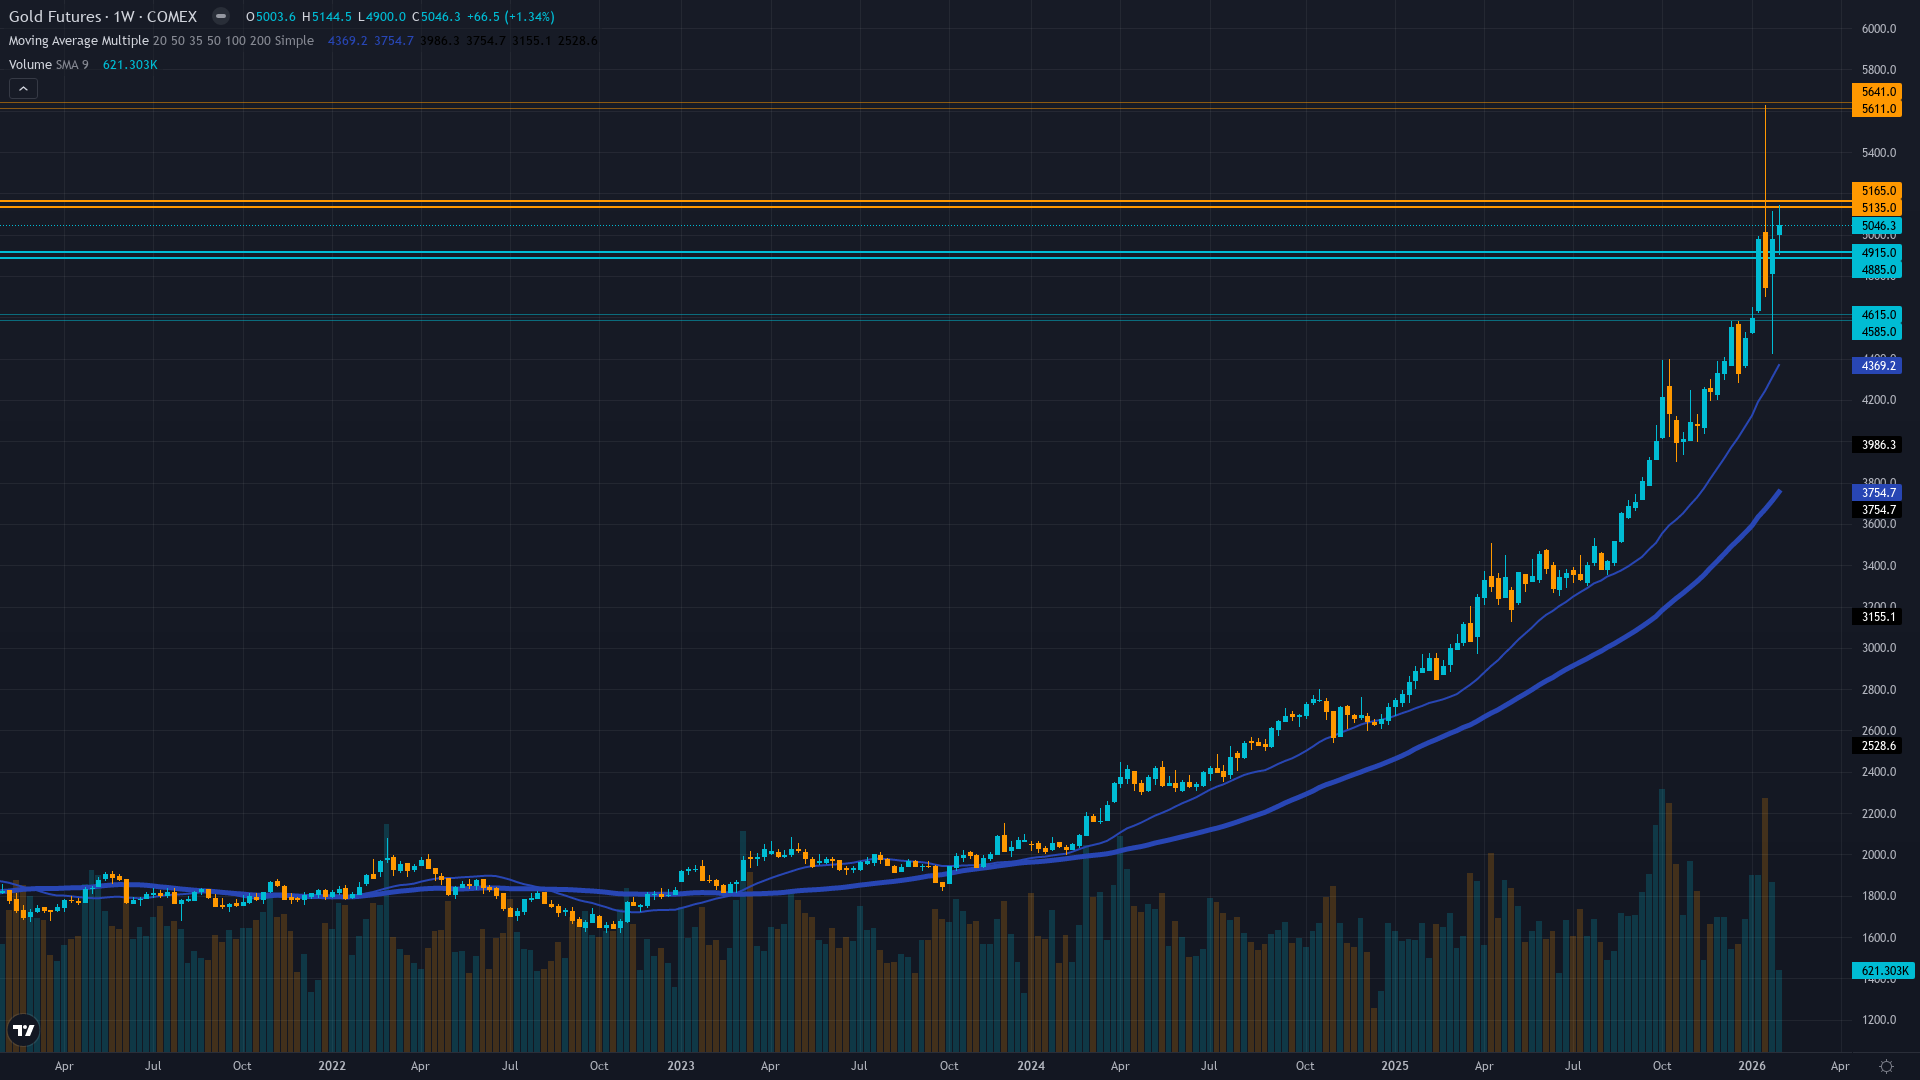
Gold has reached an extraordinary inflection point on February 15, 2026 trading at $5,040, consolidating 10% below the historic January all-time high of $5,626 after completing the most remarkable year in precious metals history with a staggering 74% gain over the past 12 months. This represents a paradigm shift where $4,000 now serves as unbreakable major support rather than resistance, fundamentally resetting market psychology as gold establishes itself definitively as the premier alternative reserve asset.
Current positioning at $5,040 reflects healthy profit-taking consolidation following the epic January spike that briefly tested $5,600, with the structural bull case remaining unequivocally intact despite near-term volatility. The fundamental backdrop remains exceptionally supportive: persistent Fed easing bias despite January pause with markets pricing potential March resumption, systematic dollar weakness with DXY at 96.88 representing 9.2% year-over-year decline trading near multi-year lows, and most critically unprecedented central bank structural reallocation with JP Morgan forecasting 585 tonnes quarterly 2026 demand and State Street projecting 773-1117t range as 95% of central banks plan reserve increases.
February seasonality presents neutral-to-positive historical patterns following January's typical strength. The January spike to $5,626 appears to have been triggered by a combination of dollar weakness acceleration, geopolitical tensions, and speculative momentum that became temporarily overextended, leading to natural profit-taking that has now stabilized around the critical $5,000 psychological level. Most significantly, central bank buying momentum continues unabated with forecasts confirming the structural bid remains robust and accelerating into 2026.
Analysts have rapidly adjusted forecasts with JP Morgan seeing $5,055 by Q4 2026, multiple institutions targeting $5,000-5,400 by mid-year, and some strategists projecting $6,000+ by 2027. The 52-week range of $2,866-5,626 places current prices 76% above yearly lows demonstrating the extraordinary structural appreciation. Current consolidation at $5,040 likely represents tactical pause within generational bull market rather than major top, positioning gold for potential spring rally toward $5,400-5,600 targets if March Fed maintains accommodative stance.
Risk-reward strongly favors upside with robust downside support at $4,800-4,900 structural levels limiting correction risk to approximately 4-6%, while clear upside targets provide 7-11% potential to retest all-time highs. The key variable is whether Fed maintains dovish bias at March meeting versus any hawkish pivot that could trigger further consolidation. Current evidence from historical pattern analysis suggests the structural drivers—Fed easing cycle, central bank demand, dollar weakness, negative real rates—remain dominant and sufficient to drive continued appreciation toward $5,400-5,600 zone by mid-2026.
This represents the definitive generational wealth transfer into hard assets as global monetary debasement accelerates and central banks strategically diversify away from dollar hegemony with gold establishing itself as monetary cornerstone of emerging multipolar financial system. The January 2026 spike to $5,626 marks a historic paradigm shift comparable to breaking $4,000 in October 2025, and current consolidation at $5,040 offers compelling risk-reward ahead of potential spring rally. Historical bias tracking shows one CORRECT call last week at +1.64% validating the continuation thesis, though prior week MISSED at -6.04% during January spike volatility, creating tactical caution warranting slightly reduced conviction from 9 to 8 while maintaining bullish bias.
| Week | Bias | Confidence | Result |
|---|---|---|---|
| February 8, 2026 | BULLISH | 8/10 | ✅ |
| February 1, 2026 | BULLISH | 8/10 | ✅ |
| January 25, 2026 | BULLISH | 8/10 | ❌ |
| January 11, 2026 | BULLISH | 8/10 | ✅ |
| January 4, 2026 | BULLISH | 8/10 | ✅ |
| December 28, 2025 | BULLISH | 9/10 | ❌ |
| December 21, 2025 | BULLISH | 8/10 | ✅ |
| December 14, 2025 | BULLISH | 8/10 | ✅ |
| December 7, 2025 | BULLISH | 8/10 | ✅ |
| November 30, 2025 | BULLISH | 8/10 | ❌ |
| November 23, 2025 | BULLISH | 8/10 | ✅ |


