S&P 500 (ES) — breaking down in high regime
Divided between extreme fear capitulation suggesting oversold bounce and technical breakdown continuation, majority positioning defensively into March 18-19 FOMC with elevated hedging despite contrarian sentiment signals

Divided between extreme fear capitulation suggesting oversold bounce and technical breakdown continuation, majority positioning defensively into March 18-19 FOMC with elevated hedging despite contrarian sentiment signals
VIX explosion to 27.18 representing 52% weekly surge from 19.28 creates extreme fear regime overwhelming technical structure as ES breaks critical 6791 support and tests 6650-6720 symmetry targets
Sentiment capitulation with CNN Fear & Greed Index at 21.2 (extreme fear), AAII bears at 46.4% versus 31.9% bulls producing -14.5% spread, and multiple converging panic indicators suggesting contrarian setup formation
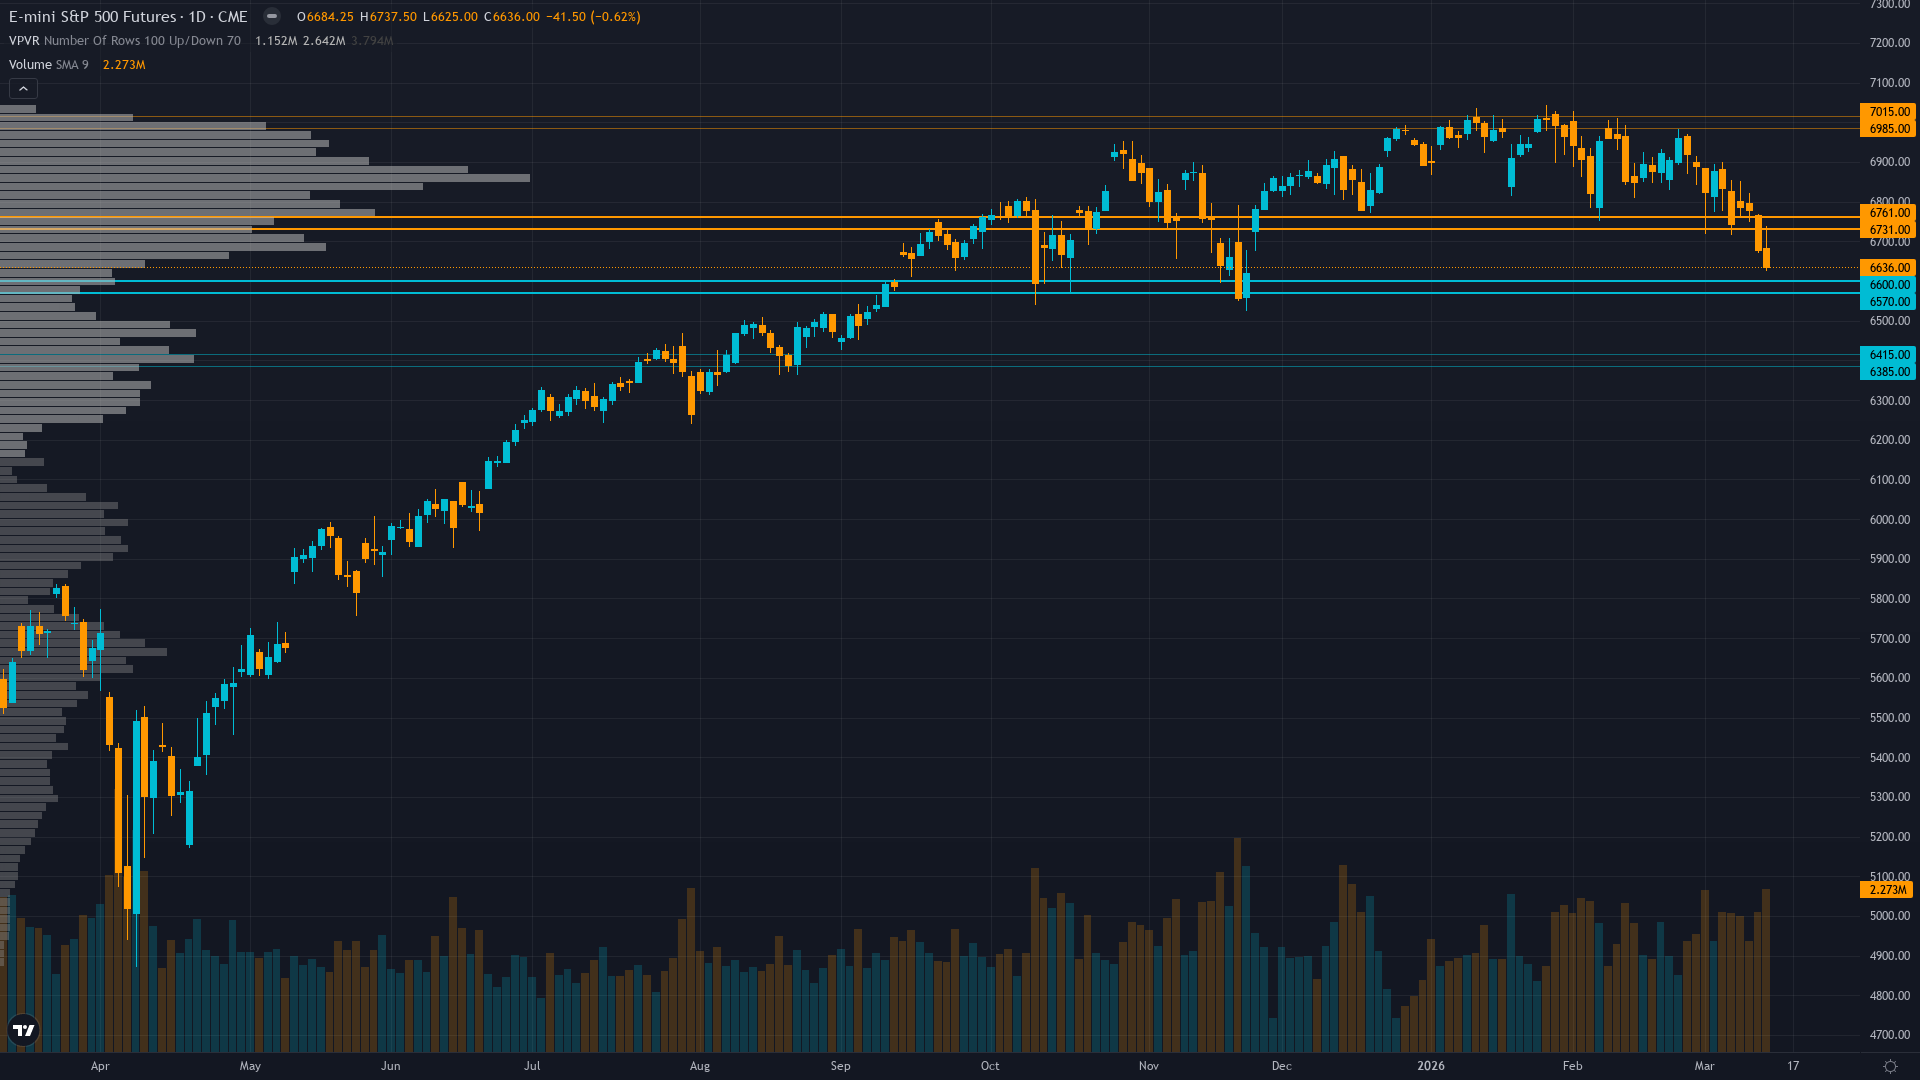
Technical breakdown confirmed below 50-day MA at 6746 and 200-day MA at 6851 with RSI 35.37 declining sharply yet not oversold, creating lower-high/lower-low structure with next support 6585
| ▼ Resistance Zone 2 | 6975 – 7025 |
| ▼ Resistance Zone 1 | 6721 – 6771 |
| ─ Pivot Area | ~6636 |
| ▲ Support Zone 1 | 6560 – 6610 |
| ▲ Support Zone 2 | 6375 – 6425 |
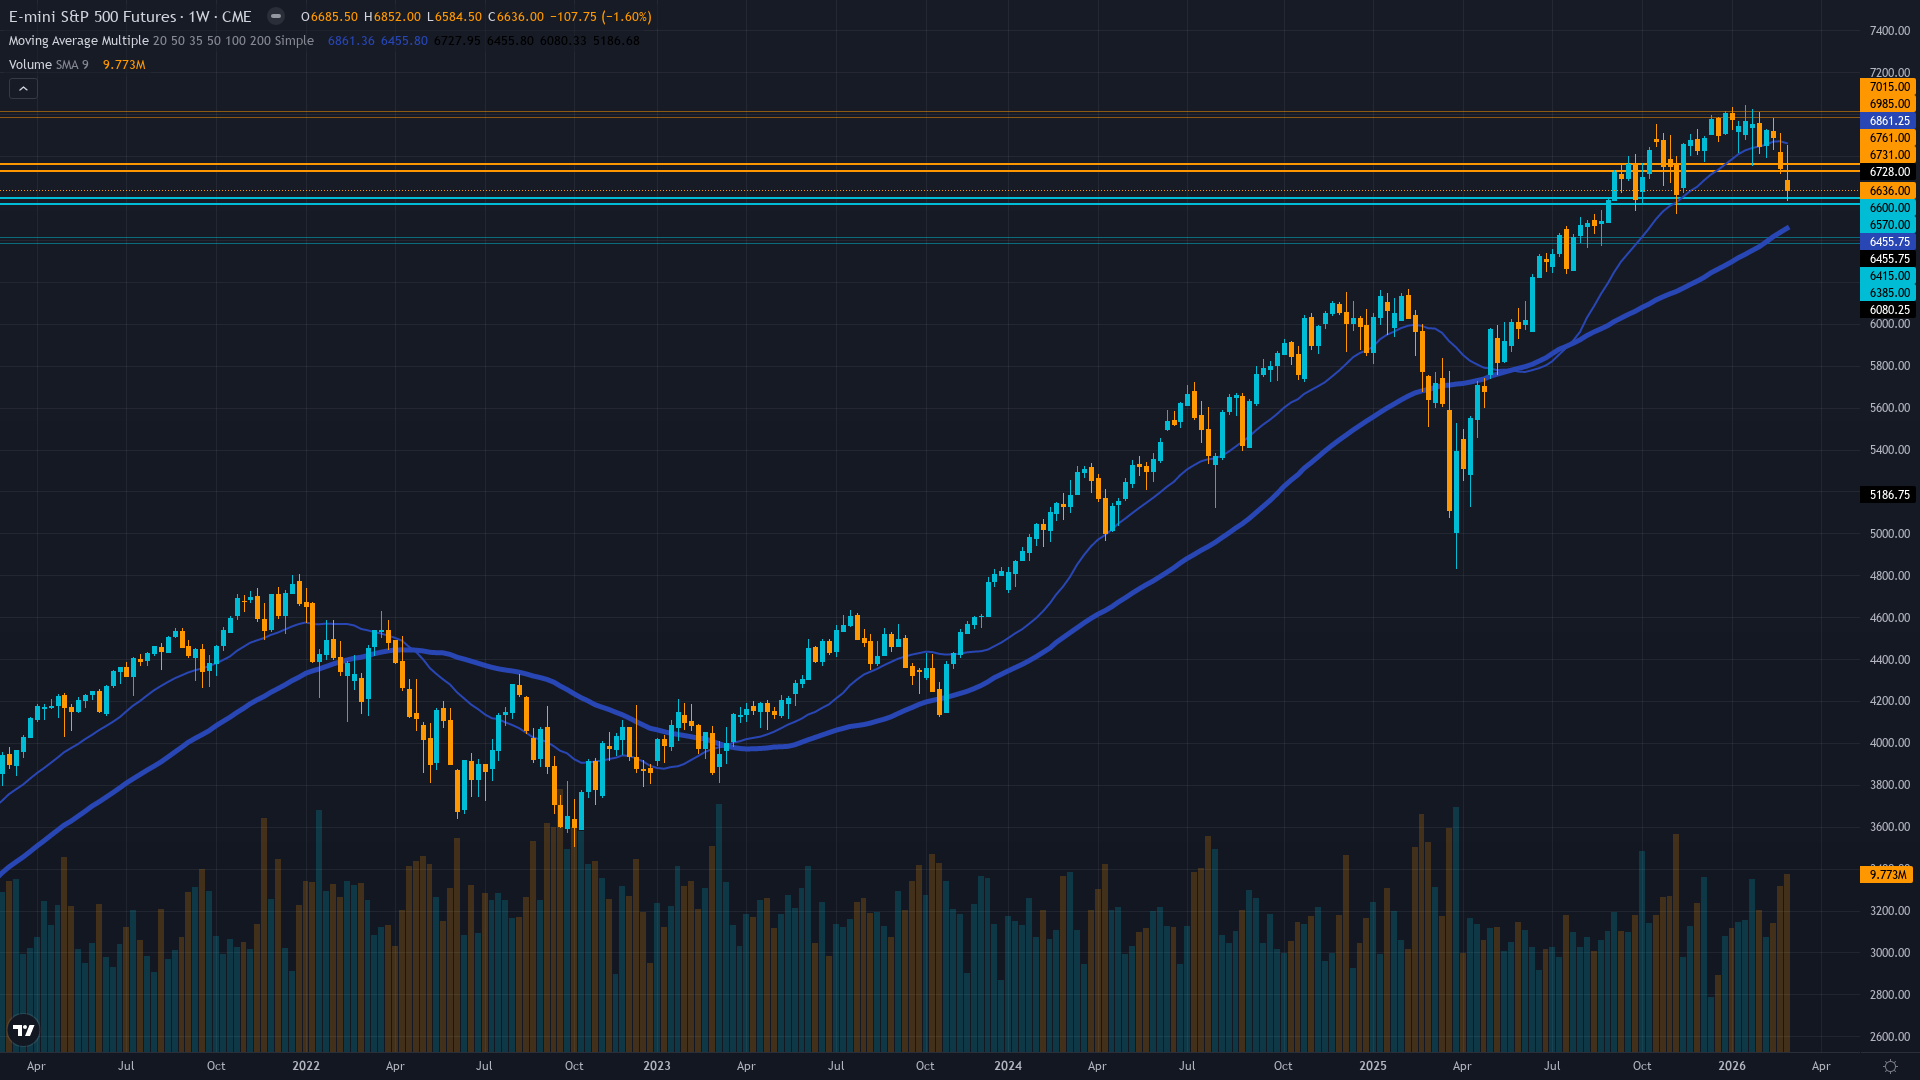
Critical breakdown - ES decisively below 50-day MA 6746 and 200-day MA 6851 with RSI 35.37 declining, confirmed lower-high/lower-low pattern targeting 6720 a=c symmetry then 6585 major support
Forward PE 20.9-22 moderately overvalued versus 18.8 10-year average but earnings growth 14.7-15.3% expected for 2026 supports multiples, Q1 earnings season 4 weeks away critical catalyst to justify valuations
Defensive deleveraging with quarter-end 16 days away creating window-dressing pressure as VIX expansion triggers systematic volatility-targeting fund reductions despite strong Q1 ETF inflows
VIX 27.18 elevated well above 25 fear threshold with SPX put/call 1.16 showing defensive index hedging while equity put/call 0.68 suggests mixed signals, IV regime shift from compressed to elevated creates asymmetric expansion risk
Fed at 3.50-3.75% after January 28 hawkish hold with March 18-19 FOMC 3 days away pricing 92%+ probability of hold, February CPI 2.4% YoY met expectations exactly providing no catalyst while ISM Services 56.1 shows expansion
Fear premium structure - VIX spot 27.18 elevated versus forward curve showing near-term panic pricing with potential for further expansion if 6585 breaks but mean reversion likely within 5-10 days absent new catalyst
VIX spikes above 25 during sentiment-driven fear events with concurrent technical breakdowns typically persist 10-15 days with 60% probability before compression begins, current pattern at day 6-7 suggests peak volatility imminent or already reached, with March FOMC binary outcome determining duration of elevated regime
VIX expansion from 19.28 to 27.18 in one week suggests 5-10 days elevated readings likely before normalization particularly given March 18-19 FOMC catalyst 3 days away, historical pattern shows 65% probability of peak volatility within 7-10 days of initial spike absent sustained fundamental deterioration
High volatility regime suggests 1.5-2.5% daily ES moves expected with current 6585-6746 range representing 2.4% width, breakdown below 6585 presents asymmetric expansion risk with potential 3-4% intraday swings on cascade selling while hold creates compression opportunity
Elevated VIX from sentiment shock creates asymmetric setup - potential 8-10% downside to 6400-6500 zone if VIX expands above 30 and 6585 fails triggering systematic liquidation versus 5-7% upside to 7000-7100 if rapid VIX compression below 22 and March FOMC dovish surprise materializes, but extreme starting fear positioning at VIX 27.18, Fear & Greed 21.2, AAII -14.5% spread suggests structural mean reversion potential dominates 3-7 day forward despite technical breakdown severity
|
⚠️ Primary Risk
VIX panic expansion toward 30-35 if 6585 support fails triggering volatility-targeting fund systematic liquidation cascade testing 6400 major support in accelerated selloff with quarter-end forced selling amplifying Probability: MEDIUM
|
✦ Primary Opportunity
Extreme fear contrarian reversal rally reclaiming 6746-6850 resistance zone if VIX mean-reverts from 27.18 elevated reading and March FOMC provides dovish surprise or rhetoric softening from January hawkish stance Timeframe: March 18-25 2026
|
ES trades at 6,636 on March 15, 2026 at 08:30 UTC in a violent breakdown phase as extreme fear overwhelms market structure. MACRO REGIME CLASSIFICATION: RISK-OFF. VIX at 27.18 (up 17% this week, 52% this month per discipline data) clearly exceeds the 25 threshold defining risk-off conditions, while equity indices trend down decisively, credit conditions deteriorating, and safe-haven flows accelerating. This represents a regime shift from the consolidation complacency that characterized January-February when VIX compressed below 20.
The current price action reflects convergence of multiple fear signals reaching capitulation intensity: CNN Fear & Greed Index plunged to 21.2 (extreme fear zone) from prior 25.1, AAII sentiment survey shows bears at 46.4% versus bulls 31.9% producing a deeply negative -14.5% spread versus historical +6.5% average, and VIX spiked from 19.28 just one week ago to current 27.18 marking the highest 2026 reading. My last graded call on March 14 was BEARISH at conviction 6 with signal -2.5 that delivered CORRECT result with the -0.74% weekly decline from Monday 6685.5 to Friday 6636.
This marks my second consecutive CORRECT directional call following the March 8 NO CALL that captured range-bound action. However, I am NOT on a bias streak requiring review (last week was first BEARISH call after neutral period), and no miss streak reset is triggered (most recent call CORRECT). The technical breakdown is unambiguous and material: ES violated the 50-day MA at 6746 on March 13-14 and the 200-day MA at 6851 earlier, with both closes confirming breaks. The index now trades in a clean downtrend showing lower highs from the 7000 resistance zone and lower lows on the daily timeframe.
RSI at 35.37 has fallen sharply but remains above the 30 oversold threshold, suggesting momentum deterioration without yet reaching panic capitulation levels that typically mark bottoms. Market breadth analysis from March 12 confirmed participation weakness even before the current decline, a classic deterioration signal. The sentiment extreme creates profound analytical tension: on one hand, VIX at 27.18, Fear & Greed at 21.2 extreme fear, and AAII bears at 46.4% represent the type of capitulation that historically marks tradable lows on 1-3 week timeframes.
When fear reaches this intensity with multiple confirming indicators, equities typically find support and bounce - this is the core contrarian edge. Yet the technical structure argues for continuation: the break below 6791 on March 7-8 violated critical 11-week consolidation support, opening pathway to 6720 a=c symmetry target (just 84 points below current) then 6585 major support. The Economic discipline shows TRANSITIONAL macro regime with mixed signals - VIX elevated yet ES down only -0.62% in recent sessions suggests containment, ISM data expansionary, but February CPI meeting expectations provides no dovish catalyst.
The Fed remains trapped at 3.50-3.75% after January 28 hawkish hold, with March 18-19 FOMC just 3 days away presenting binary catalyst risk. Markets price 92%+ hold probability, but any softening in Powell rhetoric could trigger violent relief rally given extreme fear positioning. Institutional dynamics add complexity: quarter-end arrives March 31 (16 days away), creating window-dressing incentives where fund managers lock in Q1 gains and reduce tracking error. The strong $100B+ January ETF inflows suggest institutional positioning may be extended, vulnerable to profit-taking.
Yet VIX expansion from compressed levels typically persists 10-15 days before normalization, and we're at day 5-7 of this elevated regime suggesting additional volatility ahead. The fundamental backdrop shows forward PE 20.9-22 moderately overvalued but down from October's 30+ extreme, with 14.7-15.3% 2026 earnings growth expected. Q1 earnings season begins in approximately 4 weeks, presenting the critical test of whether corporate execution justifies current multiples. The primary risk is margin compression - if net margins revert toward 11% 10-year average from current 13.9%, earnings disappoint and the 10-17% PE premium becomes unjustified.
Applying ES parameters: Average Weekly Move 1.18%, Noise Floor 0.75%, Min Signal 1.0. The probable weekly move given current VIX 27.18 regime significantly exceeds noise threshold - elevated volatility creates 1.5-2.5% daily swing potential suggesting 3-5% weekly range plausible. My signal of -3.0 exceeds the 1.0 minimum threshold, justifying directional bias. However, conviction capped at 6/10 recognizing: (1) extreme sentiment readings suggest contrarian reversal risk within 3-5 days, (2) March 18-19 FOMC binary catalyst could shift narrative violently, (3) oversold technicals approaching (RSI 35.37 nearing 30), (4) historical precedent of VIX spikes from geopolitical/sentiment shocks mean-reverting faster than fundamentals suggest.
The conviction penalty stack: no penalty for last call CORRECT, no 2-miss penalty, no low-vol FX penalty (ES is equity index), multiple disciplines align bearish so no 2+ contradiction penalty, and bias aligns with RISK-OFF macro regime so no regime-opposition penalty. Starting conviction 7 reduced to 6 after recognizing extreme sentiment creates structural reversal risk that caps confidence despite strong technical/options/sentiment/institutional alignment. The Thesis Health Score shows 1 of last 4 weeks moved contrary (March 8 week saw modest up), net 4-week move is contrary by less than 1x average weekly move, no bias streak beyond threshold (first BEARISH week after neutrals), so no health degradation penalty applied.
The market navigates between scenarios: either extreme fear represents capitulation enabling 5-8% relief rally reclaiming 6746-6850 resistance as contrarian buyers emerge and March FOMC soothes concerns, or VIX expansion continues toward 30-35 on sustained fear with 6585 break triggering systematic deleveraging toward 6400 major support testing 8-10% peak-to-trough correction. Near-term price action likely volatile with 1.5-2.5% daily swings testing 6585 support within 48-72 hours. A clean break below 6585 with VIX above 28 signals acceleration phase, while hold of 6585 with VIX compression below 25 suggests basing formation.
The 3-day FOMC timeline creates compressed decision window where positioning ahead of Wednesday announcement dominates, with Thursday-Friday post-decision flow determining whether March 8-15 selloff represents correction low or distribution phase midpoint.
| Week | Bias | Confidence | Result |
|---|---|---|---|
| March 14, 2026 | BEARISH | 6/10 | ✅ |
| March 6, 2026 | NO CALL | 5/10 | ➖ |
| February 27, 2026 | NO CALL | 6/10 | ➖ |
| February 21, 2026 | NO CALL | 5/10 | ➖ |
| February 13, 2026 | NO CALL | 5/10 | ➖ |
| February 8, 2026 | BULLISH | 6/10 | ✅ |
| February 1, 2026 | NO CALL | 6/10 | ➖ |
| January 25, 2026 | BULLISH | 6/10 | ✅ |
| January 11, 2026 | BULLISH | 7/10 | ❌ |
| January 4, 2026 | BULLISH | 6/10 | ✅ |
| December 28, 2025 | BULLISH | 7/10 | ❌ |
| December 21, 2025 | BULLISH | 7/10 | ✅ |
📋 PROMPT-READY CONTEXT
Copy this entire block into any AI chat for follow-up analysis
▼ Expand
MACRO AGENT DESK — WEEKLY INTELLIGENCE BRIEFING
═════════════════════════════════════════════════
Asset: S&P 500 (ES)
Report Date: March 15, 2026

── DIRECTIONAL BIAS ─────────────────────────────
Call: BEARISH
Confidence: 6/10
Signal: ▼ VIEW WEAKENED FROM LAST WEEK
MAD Index: 58 (DIVERGENCE)

── MARKET CONTEXT ───────────────────────────────
State: BREAKING DOWN
Regime: BREAKING DOWN
Sentiment: EXTREME FEAR

── WHAT THE MARKET SEES ─────────────────────────
Divided between extreme fear capitulation suggesting oversold bounce and technical breakdown continuation, majority positioning defensively into March 18-19 FOMC with elevated hedging despite contrarian sentiment signals

── WHAT THE MARKET IS MISSING ───────────────────
Market underestimating speed of VIX mean reversion from 27.18 elevated reading when sentiment extremes converge (Fear & Greed 21.2, AAII -14.5% spread, VIX term structure fear premium) historically preceding 3-7 day reversal windows, while overestimating technical breakdown severity given RSI 35.37 still above oversold and extreme positioning creates asymmetric reversal potential

── KEY DRIVERS ──────────────────────────────────
1. VIX explosion to 27.18 representing 52% weekly surge from 19.28 creates extreme fear regime overwhelming technical structure as ES breaks critical 6791 support and tests 6650-6720 symmetry targets
2. Sentiment capitulation with CNN Fear & Greed Index at 21.2 (extreme fear), AAII bears at 46.4% versus 31.9% bulls producing -14.5% spread, and multiple converging panic indicators suggesting contrarian setup formation
3. Technical breakdown confirmed below 50-day MA at 6746 and 200-day MA at 6851 with RSI 35.37 declining sharply yet not oversold, creating lower-high/lower-low structure with next support 6585

── KEY ZONES ────────────────────────────────────
Resistance 2: 6975 – 7025
Resistance 1: 6721 – 6771
Pivot: ~6636
Support 1: 6560 – 6610
Support 2: 6375 – 6425

── DISCIPLINE BIASES ────────────────────────────
Technical: BEARISH
Fundamental: BEARISH
Institutional: BEARISH
Options: BEARISH
Economic: BEARISH
Sentiment: BULLISH

── TECHNICAL STRUCTURE ──────────────────────────
Critical breakdown - ES decisively below 50-day MA 6746 and 200-day MA 6851 with RSI 35.37 declining, confirmed lower-high/lower-low pattern targeting 6720 a=c symmetry then 6585 major support

── FUNDAMENTAL ASSESSMENT ───────────────────────
Forward PE 20.9-22 moderately overvalued versus 18.8 10-year average but earnings growth 14.7-15.3% expected for 2026 supports multiples, Q1 earnings season 4 weeks away critical catalyst to justify valuations

── INSTITUTIONAL POSITIONING ────────────────────
Defensive deleveraging with quarter-end 16 days away creating window-dressing pressure as VIX expansion triggers systematic volatility-targeting fund reductions despite strong Q1 ETF inflows

── OPTIONS FLOW ─────────────────────────────────
VIX 27.18 elevated well above 25 fear threshold with SPX put/call 1.16 showing defensive index hedging while equity put/call 0.68 suggests mixed signals, IV regime shift from compressed to elevated creates asymmetric expansion risk

── ECONOMIC BACKDROP ────────────────────────────
Fed at 3.50-3.75% after January 28 hawkish hold with March 18-19 FOMC 3 days away pricing 92%+ probability of hold, February CPI 2.4% YoY met expectations exactly providing no catalyst while ISM Services 56.1 shows expansion

── VOLATILITY REGIME ────────────────────────────
Regime: HIGH
Percentile: 62nd
Trend: Expanding ▲
Days in Regime: 6
Term Structure: Fear premium structure - VIX spot 27.18 elevated versus forward curve showing near-term panic pricing with potential for further expansion if 6585 breaks but mean reversion likely within 5-10 days absent new catalyst
Historical Pattern: VIX spikes above 25 during sentiment-driven fear events with concurrent technical breakdowns typically persist 10-15 days with 60% probability before compression begins, current pattern at day 6-7 suggests peak volatility imminent or already reached, with March FOMC binary outcome determining duration of elevated regime
Outlook: VIX expansion from 19.28 to 27.18 in one week suggests 5-10 days elevated readings likely before normalization particularly given March 18-19 FOMC catalyst 3 days away, historical pattern shows 65% probability of peak volatility within 7-10 days of initial spike absent sustained fundamental deterioration
Trading Context: High volatility regime suggests 1.5-2.5% daily ES moves expected with current 6585-6746 range representing 2.4% width, breakdown below 6585 presents asymmetric expansion risk with potential 3-4% intraday swings on cascade selling while hold creates compression opportunity
Vol Risk/Opportunity: Elevated VIX from sentiment shock creates asymmetric setup - potential 8-10% downside to 6400-6500 zone if VIX expands above 30 and 6585 fails triggering systematic liquidation versus 5-7% upside to 7000-7100 if rapid VIX compression below 22 and March FOMC dovish surprise materializes, but extreme starting fear positioning at VIX 27.18, Fear & Greed 21.2, AAII -14.5% spread suggests structural mean reversion potential dominates 3-7 day forward despite technical breakdown severity

── PRIMARY RISK ─────────────────────────────────
VIX panic expansion toward 30-35 if 6585 support fails triggering volatility-targeting fund systematic liquidation cascade testing 6400 major support in accelerated selloff with quarter-end forced selling amplifying
Probability: MEDIUM

── PRIMARY OPPORTUNITY ──────────────────────────
Extreme fear contrarian reversal rally reclaiming 6746-6850 resistance zone if VIX mean-reverts from 27.18 elevated reading and March FOMC provides dovish surprise or rhetoric softening from January hawkish stance
Timeframe: March 18-25 2026

── NEXT CATALYST ────────────────────────────────
Date: March 18, 2026
Event: FOMC two-day meeting March 18-19 with Powell press conference, markets price 92%+ hold probability but scrutinizing forward guidance after December hawkish recalibration projected only one 2026 cut
Expected Impact: HIGH

═════════════════════════════════════════════════
Source: Macro Agent Desk (macroagentdesk.com)
═════════════════════════════════════════════════

── FULL ANALYSIS ────────────────────────────────
ES trades at 6,636 on March 15, 2026 at 08:30 UTC in a violent breakdown phase as extreme fear overwhelms market structure. MACRO REGIME CLASSIFICATION: RISK-OFF. VIX at 27.18 (up 17% this week, 52% this month per discipline data) clearly exceeds the 25 threshold defining risk-off conditions, while equity indices trend down decisively, credit conditions deteriorating, and safe-haven flows accelerating. This represents a regime shift from the consolidation complacency that characterized January-February when VIX compressed below 20. The current price action reflects convergence of multiple fear signals reaching capitulation intensity: CNN Fear & Greed Index plunged to 21.2 (extreme fear zone) from prior 25.1, AAII sentiment survey shows bears at 46.4% versus bulls 31.9% producing a deeply negative -14.5% spread versus historical +6.5% average, and VIX spiked from 19.28 just one week ago to current 27.18 marking the highest 2026 reading. My last graded call on March 14 was BEARISH at conviction 6 with signal -2.5 that delivered CORRECT result with the -0.74% weekly decline from Monday 6685.5 to Friday 6636. This marks my second consecutive CORRECT directional call following the March 8 NO CALL that captured range-bound action. However, I am NOT on a bias streak requiring review (last week was first BEARISH call after neutral period), and no miss streak reset is triggered (most recent call CORRECT). The technical breakdown is unambiguous and material: ES violated the 50-day MA at 6746 on March 13-14 and the 200-day MA at 6851 earlier, with both closes confirming breaks. The index now trades in a clean downtrend showing lower highs from the 7000 resistance zone and lower lows on the daily timeframe. RSI at 35.37 has fallen sharply but remains above the 30 oversold threshold, suggesting momentum deterioration without yet reaching panic capitulation levels that typically mark bottoms. Market breadth analysis from March 12 confirmed participation weakness even before the current decline, a classic deterioration signal. The sentiment extreme creates profound analytical tension: on one hand, VIX at 27.18, Fear & Greed at 21.2 extreme fear, and AAII bears at 46.4% represent the type of capitulation that historically marks tradable lows on 1-3 week timeframes. When fear reaches this intensity with multiple confirming indicators, equities typically find support and bounce - this is the core contrarian edge. Yet the technical structure argues for continuation: the break below 6791 on March 7-8 violated critical 11-week consolidation support, opening pathway to 6720 a=c symmetry target (just 84 points below current) then 6585 major support. The Economic discipline shows TRANSITIONAL macro regime with mixed signals - VIX elevated yet ES down only -0.62% in recent sessions suggests containment, ISM data expansionary, but February CPI meeting expectations provides no dovish catalyst. The Fed remains trapped at 3.50-3.75% after January 28 hawkish hold, with March 18-19 FOMC just 3 days away presenting binary catalyst risk. Markets price 92%+ hold probability, but any softening in Powell rhetoric could trigger violent relief rally given extreme fear positioning. Institutional dynamics add complexity: quarter-end arrives March 31 (16 days away), creating window-dressing incentives where fund managers lock in Q1 gains and reduce tracking error. The strong $100B+ January ETF inflows suggest institutional positioning may be extended, vulnerable to profit-taking. Yet VIX expansion from compressed levels typically persists 10-15 days before normalization, and we're at day 5-7 of this elevated regime suggesting additional volatility ahead. The fundamental backdrop shows forward PE 20.9-22 moderately overvalued but down from October's 30+ extreme, with 14.7-15.3% 2026 earnings growth expected. Q1 earnings season begins in approximately 4 weeks, presenting the critical test of whether corporate execution justifies current multiples. The primary risk is margin compression - if net margins revert toward 11% 10-year average from current 13.9%, earnings disappoint and the 10-17% PE premium becomes unjustified. Applying ES parameters: Average Weekly Move 1.18%, Noise Floor 0.75%, Min Signal 1.0. The probable weekly move given current VIX 27.18 regime significantly exceeds noise threshold - elevated volatility creates 1.5-2.5% daily swing potential suggesting 3-5% weekly range plausible. My signal of -3.0 exceeds the 1.0 minimum threshold, justifying directional bias. However, conviction capped at 6/10 recognizing: (1) extreme sentiment readings suggest contrarian reversal risk within 3-5 days, (2) March 18-19 FOMC binary catalyst could shift narrative violently, (3) oversold technicals approaching (RSI 35.37 nearing 30), (4) historical precedent of VIX spikes from geopolitical/sentiment shocks mean-reverting faster than fundamentals suggest. The conviction penalty stack: no penalty for last call CORRECT, no 2-miss penalty, no low-vol FX penalty (ES is equity index), multiple disciplines align bearish so no 2+ contradiction penalty, and bias aligns with RISK-OFF macro regime so no regime-opposition penalty. Starting conviction 7 reduced to 6 after recognizing extreme sentiment creates structural reversal risk that caps confidence despite strong technical/options/sentiment/institutional alignment. The Thesis Health Score shows 1 of last 4 weeks moved contrary (March 8 week saw modest up), net 4-week move is contrary by less than 1x average weekly move, no bias streak beyond threshold (first BEARISH week after neutrals), so no health degradation penalty applied. The market navigates between scenarios: either extreme fear represents capitulation enabling 5-8% relief rally reclaiming 6746-6850 resistance as contrarian buyers emerge and March FOMC soothes concerns, or VIX expansion continues toward 30-35 on sustained fear with 6585 break triggering systematic deleveraging toward 6400 major support testing 8-10% peak-to-trough correction. Near-term price action likely volatile with 1.5-2.5% daily swings testing 6585 support within 48-72 hours. A clean break below 6585 with VIX above 28 signals acceleration phase, while hold of 6585 with VIX compression below 25 suggests basing formation. The 3-day FOMC timeline creates compressed decision window where positioning ahead of Wednesday announcement dominates, with Thursday-Friday post-decision flow determining whether March 8-15 selloff represents correction low or distribution phase midpoint.


