S&P 500 (ES) — -0.8 between 6800 support and 6950 resistance with 5/10 confidence
Cautiously neutral awaiting March 17-18 FOMC catalyst with 10-week consolidation pattern reflecting institutional indecision between seasonal optimism and Fed hawkish reality

Cautiously neutral awaiting March 17-18 FOMC catalyst with 10-week consolidation pattern reflecting institutional indecision between seasonal optimism and Fed hawkish reality
February 27 week closed -0.49% continuing 10-week consolidation pattern below 7000 psychological resistance amid unresolved March 17-18 FOMC uncertainty
VIX elevated at 19.85 (up 6.61% in 24 hours) signals renewed institutional anxiety entering March after February compression failed to sustain
Forward PE at 23.60 remains elevated at 72nd percentile creating asymmetric downside risk despite compression from October 30x extreme
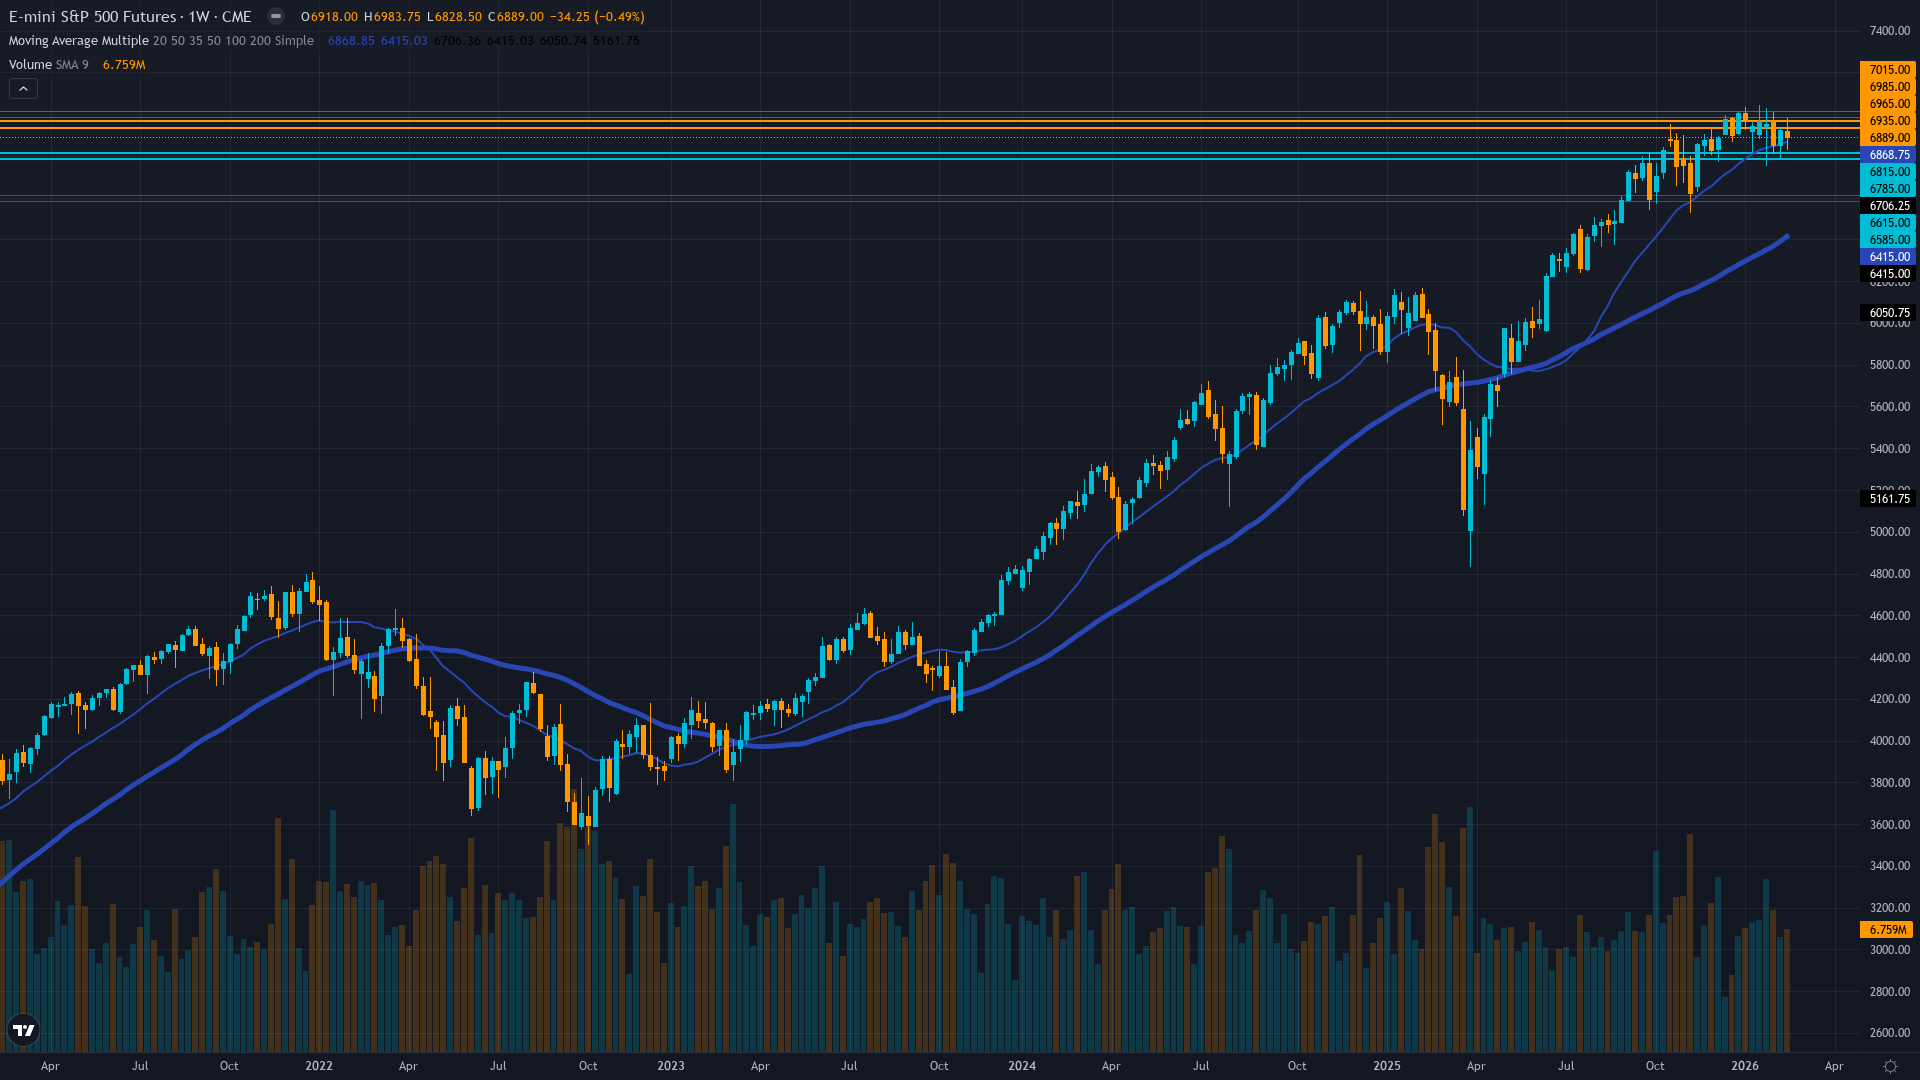
| ▲ Resistance Zone 2 | 6975 – 7025 |
| ▲ Resistance Zone 1 | 6925 – 6975 |
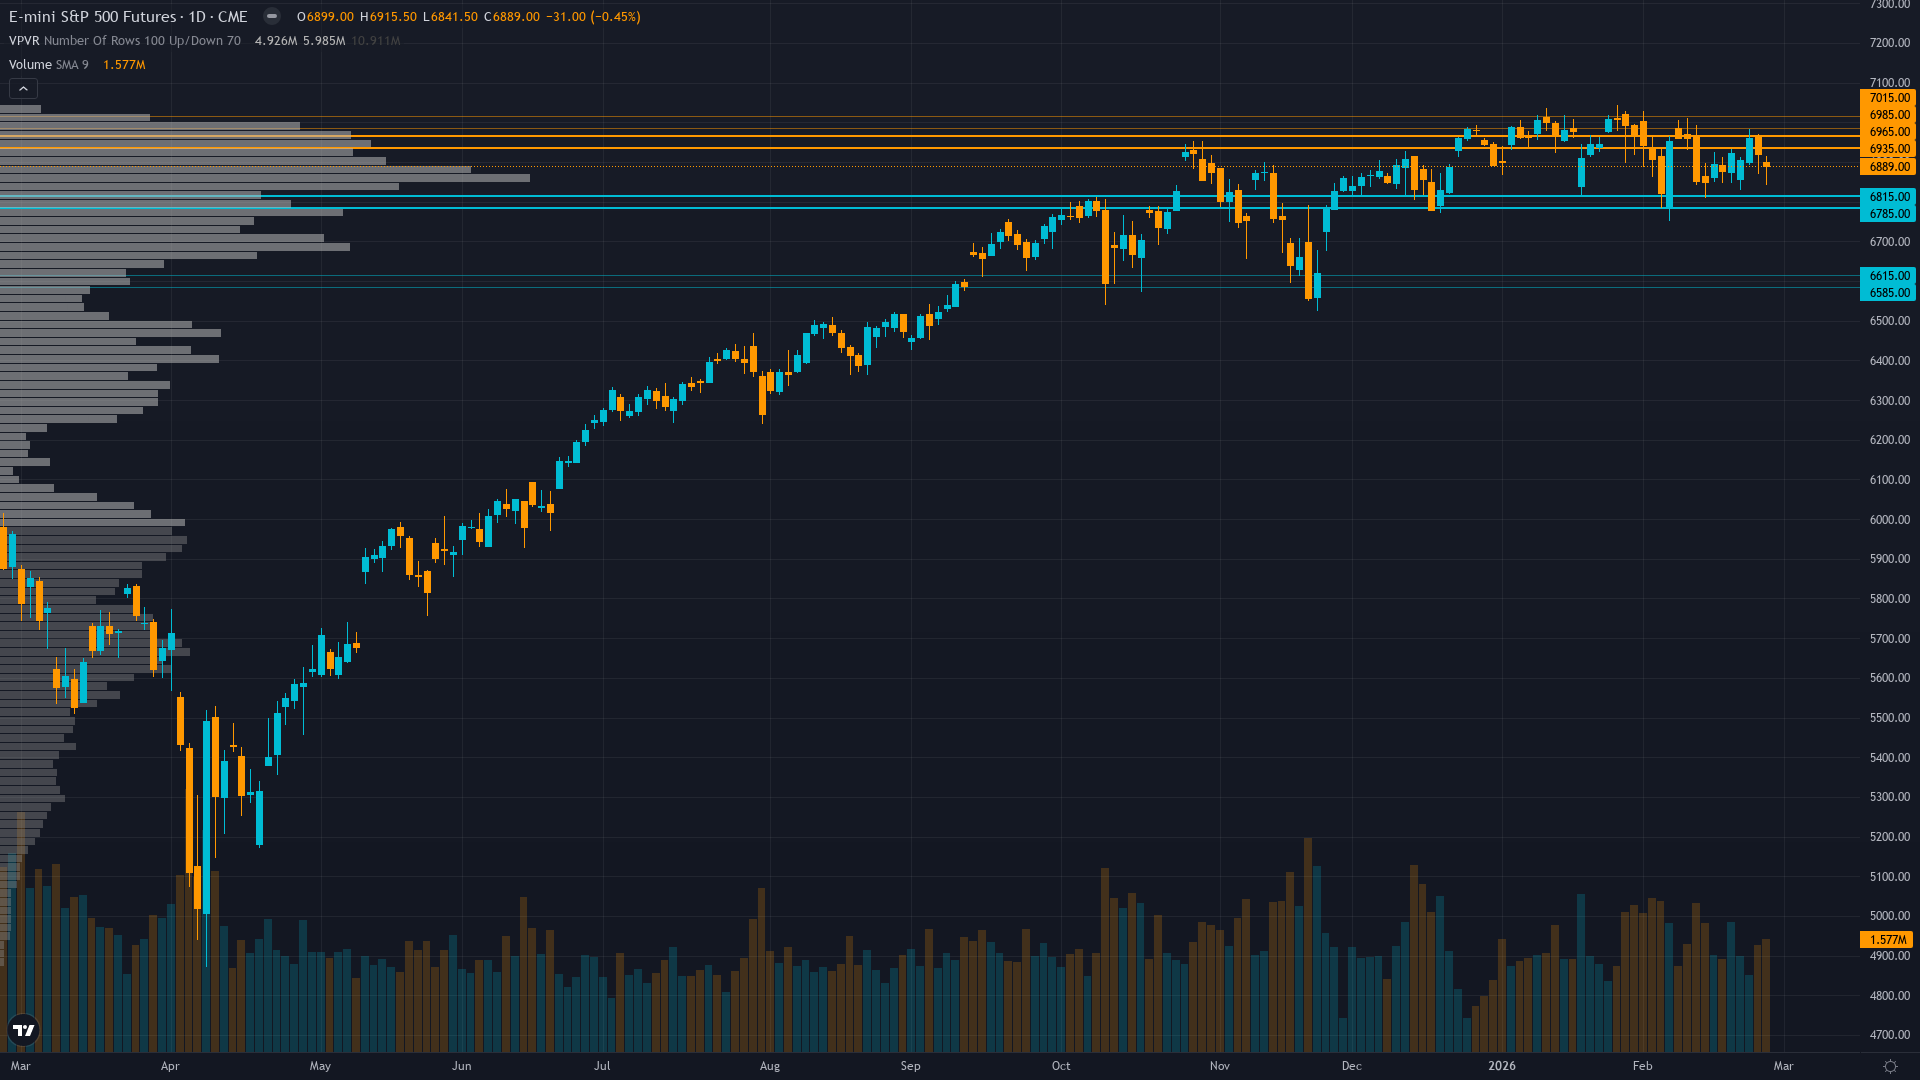
| ─ Pivot Area | ~6884 |
| ▼ Support Zone 1 | 6775 – 6825 |
| ▼ Support Zone 2 | 6575 – 6625 |
Trapped in 6800-6950 range for 10 consecutive weeks since late December unable to reclaim January 11 7005 high - momentum exhausted below 7000 psychological resistance
Forward PE 23.60 at 72nd percentile down from October extreme but elevated - Fed at 3.50-3.75% after January 28 hawkish hold creates policy uncertainty entering March 17-18 meeting
Defensive hedging elevated despite 10-week consolidation near all-time highs with VIX 19.85 expansion signaling renewed caution entering March FOMC
VIX 19.85 up 6.61% in 24 hours from Friday close shows institutional hedging acceleration despite surface consolidation - VIX futures at 20.55 indicates modest contango and near-term fear premium
Fed maintained 3.50-3.75% at January 28 meeting after December 11 hawkish shock projected only one 2026 cut versus four expected - March 17-18 FOMC critical catalyst with zero cut probability priced
Normal with near-term expansion - VIX spot at 19.85 versus futures at 20.55 showing modest contango as institutional hedging expands entering March 17-18 FOMC catalyst
VIX readings in 19-20 range during protracted consolidations typically persist until catalyst resolution - March FOMC binary outcome could expand to 22-25 range or compress to 16-17 depending on Powell rhetoric
VIX expansion from 19.08 on February 22 to current 19.85 suggests 5-10 days elevated readings likely before normalization particularly given March 17-18 FOMC catalyst presents asymmetric expansion risk
Normal-to-elevated volatility suggests 1.0-1.5% daily ES moves expected with current 6800-6950 consolidation representing 2.2% range - March 17-18 FOMC catalyst presents asymmetric expansion risk with potential 2-3% intraday swings
Elevated VIX from 10-week consolidation creates balanced but asymmetric setup - potential 6-8% downside to 6400-6500 zone if March FOMC reinforces hawkish stance versus 4-5% upside to 7200-7250 if Fed softens and seasonal rally materializes despite elevated starting forward PE 23.60 at 72nd percentile creating structural compression risk
|
⚠️ Primary Risk
March 17-18 FOMC reinforces December 11 hawkish recalibration with sustained restrictive rhetoric forcing equity multiple compression from forward PE 23.60 elevated levels Probability: MEDIUM
|
✦ Primary Opportunity
March-April seasonal strength capturing historical +1.0% March and +1.4% April average gains with March-May period generating +4.2% combined if Fed rhetoric softens Timeframe: March 17 through April 30 2026
|
ES trades at 6884 on March 1, 2026, beginning the new month from a position of profound exhaustion after 10 consecutive weeks trapped in the 6800-6950 consolidation range. Friday February 27 closed -0.49% extending the range-bound pattern that has persisted since late December when the index failed to sustain breakouts above the psychologically significant 7000 level first tested at 7005 on January 11. This protracted consolidation occurs against a backdrop of multiple unresolved tensions that create asymmetric risk entering March.
The VIX spiked 6.61% to 19.85 in the past 24 hours from Friday's close, signaling renewed institutional anxiety despite the surface calm of the 10-week range. VIX futures at 20.55 indicate modest contango with near-term fear premium expanding as markets approach the critical March 17-18 FOMC catalyst. The forward PE ratio sits at 23.60 as of February 2 data - down meaningfully from October's dangerous 30x extreme but still elevated at the 72nd percentile historically, creating vulnerability to multiple compression if the Fed maintains its hawkish stance.
Recent historical context reveals the December 11, 2025 FOMC delivered one of the most consequential surprises: while cutting 25bp as expected to 3.50-3.75%, Chair Powell shocked markets by projecting only ONE 2026 cut versus prior expectations of four, while raising inflation forecasts to 2.5% from 2.1%. The January 28 FOMC maintained rates with no indication of near-term cuts, cementing the hawkish pivot. Markets currently price zero probability of a March cut, but the meeting represents a binary catalyst where either Powell's rhetoric softens creating relief rally potential, or sustained hawkishness forces deeper correction testing 6600 support.
February closed the month essentially flat after the earlier promise of seasonal strength (+1.5% January Effect) failed to materialize, with the S&P 500 trapped in the same consolidation pattern. March historically averages +1.0% gains with April at +1.4%, and the March-May period delivers +4.2% combined returns - but 2026 faces unique headwinds from the Fed's hawkish December pivot that reduced expected accommodation by 75bp. The 10-week consolidation creates a coiled spring pattern where either direction presents meaningful potential: breakout above 6950-7000 resistance targets 7100-7200 on seasonal strength and Fed softening, or breakdown below 6800 tests 6600-6700 major support on continued policy restrictiveness.
Technical indicators show deterioration with the compression pattern now extending two months without resolution, suggesting institutional indecision rather than accumulation. Historical volatility remains elevated with 20-day vol at approximately 13.8% annualized, positioning above the low end but below extreme readings. The VIX expansion to 19.85 from recent 17-19 range suggests institutions are positioning defensively entering March despite proximity to all-time highs set at 6979 on December 28.
The December-through-February period revealed a market struggling to reconcile powerful seasonal tailwinds against fundamental reality of reduced Fed accommodation. Applying Bias Integrity Rule 1 (Noise Threshold): ES average weekly move is 1.18% with Noise Floor at 0.75%. The 10-week consolidation in a 6800-6950 range (2.2% width) suggests probable weekly moves remain marginal around the noise threshold absent a major catalyst. Given this protracted compression pattern, elevated VIX signaling defensive positioning, forward PE 23.60 vulnerability, unresolved March 17-18 FOMC binary outcome with zero cuts priced, and the index unable to generate directional momentum for 10 consecutive weeks, a cautious BEARISH lean with low conviction appears warranted.
The bias reflects technical exhaustion after failing multiple 7000 breakout attempts, elevated volatility regime expansion entering a critical Fed catalyst, and asymmetric risk from stretched valuations at a market inflection point. However, conviction remains measured at 5/10 given March-April seasonal tailwinds, potential for Fed rhetoric to surprise dovish, and the reality that 10-week consolidations often precede significant moves in either direction. The market essentially bets that March FOMC can provide the catalyst to resolve this protracted indecision, with the risk skewed toward breakdown given December's hawkish recalibration remains unresolved and forward multiples offer limited margin for disappointment. Near-term price action likely remains range-bound in the 6800-6950 zone until the March 17-18 catalyst provides directional clarity.
| Week | Bias | Confidence | Result |
|---|---|---|---|
| February 27, 2026 | NO CALL | 6/10 | ➖ |
| February 21, 2026 | NO CALL | 5/10 | ➖ |
| February 13, 2026 | NO CALL | 5/10 | ➖ |
| February 8, 2026 | BULLISH | 6/10 | ✅ |
| February 1, 2026 | NO CALL | 6/10 | ➖ |
| January 25, 2026 | BULLISH | 6/10 | ✅ |
| January 11, 2026 | BULLISH | 7/10 | ❌ |
| January 4, 2026 | BULLISH | 6/10 | ✅ |
| December 28, 2025 | BULLISH | 7/10 | ❌ |
| December 21, 2025 | BULLISH | 7/10 | ✅ |
| December 14, 2025 | BEARISH | 8/10 | ✅ |
| December 7, 2025 | BULLISH | 7/10 | ❌ |
📋 PROMPT-READY CONTEXT
Copy this entire block into any AI chat for follow-up analysis
▼ Expand
MACRO AGENT DESK — WEEKLY INTELLIGENCE BRIEFING
═════════════════════════════════════════════════
Asset: S&P 500 (ES)
Report Date: March 1, 2026

── DIRECTIONAL BIAS ─────────────────────────────
Call: NO CALL
Confidence: 5/10
Signal: VIEW MAINTAINED FROM LAST WEEK
MAD Index: 32 (SLIGHT DIVERGENCE)

── MARKET CONTEXT ───────────────────────────────
State: CONSOLIDATING
Regime: RANGING
Sentiment: NEUTRAL

── WHAT THE MARKET SEES ─────────────────────────
Cautiously neutral awaiting March 17-18 FOMC catalyst with 10-week consolidation pattern reflecting institutional indecision between seasonal optimism and Fed hawkish reality

── WHAT THE MARKET IS MISSING ───────────────────
Market may be underestimating duration of consolidation given December hawkish recalibration remains unresolved while overestimating March seasonal reliability in current environment of elevated VIX 19.85 and forward PE 23.60 at 72nd percentile creating structural compression vulnerability

── KEY DRIVERS ──────────────────────────────────
1. February 27 week closed -0.49% continuing 10-week consolidation pattern below 7000 psychological resistance amid unresolved March 17-18 FOMC uncertainty
2. VIX elevated at 19.85 (up 6.61% in 24 hours) signals renewed institutional anxiety entering March after February compression failed to sustain
3. Forward PE at 23.60 remains elevated at 72nd percentile creating asymmetric downside risk despite compression from October 30x extreme

── KEY ZONES ────────────────────────────────────
Resistance 2: 6975 – 7025
Resistance 1: 6925 – 6975
Pivot: ~6884
Support 1: 6775 – 6825
Support 2: 6575 – 6625

── DISCIPLINE BIASES ────────────────────────────
Technical: BEARISH
Fundamental: BEARISH
Institutional: BEARISH
Options: BEARISH
Economic: BEARISH
Sentiment: NO CALL

── TECHNICAL STRUCTURE ──────────────────────────
Trapped in 6800-6950 range for 10 consecutive weeks since late December unable to reclaim January 11 7005 high - momentum exhausted below 7000 psychological resistance

── FUNDAMENTAL ASSESSMENT ───────────────────────
Forward PE 23.60 at 72nd percentile down from October extreme but elevated - Fed at 3.50-3.75% after January 28 hawkish hold creates policy uncertainty entering March 17-18 meeting

── INSTITUTIONAL POSITIONING ────────────────────
Defensive hedging elevated despite 10-week consolidation near all-time highs with VIX 19.85 expansion signaling renewed caution entering March FOMC

── OPTIONS FLOW ─────────────────────────────────
VIX 19.85 up 6.61% in 24 hours from Friday close shows institutional hedging acceleration despite surface consolidation - VIX futures at 20.55 indicates modest contango and near-term fear premium

── ECONOMIC BACKDROP ────────────────────────────
Fed maintained 3.50-3.75% at January 28 meeting after December 11 hawkish shock projected only one 2026 cut versus four expected - March 17-18 FOMC critical catalyst with zero cut probability priced

── VOLATILITY REGIME ────────────────────────────
Regime: NORMAL
Percentile: 52nd
Trend: Expanding ▲
Days in Regime: 1
Term Structure: normal with near-term expansion - VIX spot at 19.85 versus futures at 20.55 showing modest contango as institutional hedging expands entering March 17-18 FOMC catalyst
Historical Pattern: VIX readings in 19-20 range during protracted consolidations typically persist until catalyst resolution - March FOMC binary outcome could expand to 22-25 range or compress to 16-17 depending on Powell rhetoric
Outlook: VIX expansion from 19.08 on February 22 to current 19.85 suggests 5-10 days elevated readings likely before normalization particularly given March 17-18 FOMC catalyst presents asymmetric expansion risk
Trading Context: Normal-to-elevated volatility suggests 1.0-1.5% daily ES moves expected with current 6800-6950 consolidation representing 2.2% range - March 17-18 FOMC catalyst presents asymmetric expansion risk with potential 2-3% intraday swings
Vol Risk/Opportunity: Elevated VIX from 10-week consolidation creates balanced but asymmetric setup - potential 6-8% downside to 6400-6500 zone if March FOMC reinforces hawkish stance versus 4-5% upside to 7200-7250 if Fed softens and seasonal rally materializes despite elevated starting forward PE 23.60 at 72nd percentile creating structural compression risk

── PRIMARY RISK ─────────────────────────────────
March 17-18 FOMC reinforces December 11 hawkish recalibration with sustained restrictive rhetoric forcing equity multiple compression from forward PE 23.60 elevated levels
Probability: MEDIUM

── PRIMARY OPPORTUNITY ──────────────────────────
March-April seasonal strength capturing historical +1.0% March and +1.4% April average gains with March-May period generating +4.2% combined if Fed rhetoric softens
Timeframe: March 17 through April 30 2026

── NEXT CATALYST ────────────────────────────────
Date: March 17, 2026
Event: March 17-18 FOMC two-day meeting with zero rate cut probability priced but markets scrutinizing Powell rhetoric for any softening of December/January hawkish stance plus updated dot plot
Expected Impact: HIGH

── FULL ANALYSIS ────────────────────────────────
ES trades at 6884 on March 1, 2026, beginning the new month from a position of profound exhaustion after 10 consecutive weeks trapped in the 6800-6950 consolidation range. Friday February 27 closed -0.49% extending the range-bound pattern that has persisted since late December when the index failed to sustain breakouts above the psychologically significant 7000 level first tested at 7005 on January 11. This protracted consolidation occurs against a backdrop of multiple unresolved tensions that create asymmetric risk entering March. The VIX spiked 6.61% to 19.85 in the past 24 hours from Friday's close, signaling renewed institutional anxiety despite the surface calm of the 10-week range. VIX futures at 20.55 indicate modest contango with near-term fear premium expanding as markets approach the critical March 17-18 FOMC catalyst. The forward PE ratio sits at 23.60 as of February 2 data - down meaningfully from October's dangerous 30x extreme but still elevated at the 72nd percentile historically, creating vulnerability to multiple compression if the Fed maintains its hawkish stance. Recent historical context reveals the December 11, 2025 FOMC delivered one of the most consequential surprises: while cutting 25bp as expected to 3.50-3.75%, Chair Powell shocked markets by projecting only ONE 2026 cut versus prior expectations of four, while raising inflation forecasts to 2.5% from 2.1%. The January 28 FOMC maintained rates with no indication of near-term cuts, cementing the hawkish pivot. Markets currently price zero probability of a March cut, but the meeting represents a binary catalyst where either Powell's rhetoric softens creating relief rally potential, or sustained hawkishness forces deeper correction testing 6600 support. February closed the month essentially flat after the earlier promise of seasonal strength (+1.5% January Effect) failed to materialize, with the S&P 500 trapped in the same consolidation pattern. March historically averages +1.0% gains with April at +1.4%, and the March-May period delivers +4.2% combined returns - but 2026 faces unique headwinds from the Fed's hawkish December pivot that reduced expected accommodation by 75bp. The 10-week consolidation creates a coiled spring pattern where either direction presents meaningful potential: breakout above 6950-7000 resistance targets 7100-7200 on seasonal strength and Fed softening, or breakdown below 6800 tests 6600-6700 major support on continued policy restrictiveness. Technical indicators show deterioration with the compression pattern now extending two months without resolution, suggesting institutional indecision rather than accumulation. Historical volatility remains elevated with 20-day vol at approximately 13.8% annualized, positioning above the low end but below extreme readings. The VIX expansion to 19.85 from recent 17-19 range suggests institutions are positioning defensively entering March despite proximity to all-time highs set at 6979 on December 28. The December-through-February period revealed a market struggling to reconcile powerful seasonal tailwinds against fundamental reality of reduced Fed accommodation. Applying Bias Integrity Rule 1 (Noise Threshold): ES average weekly move is 1.18% with Noise Floor at 0.75%. The 10-week consolidation in a 6800-6950 range (2.2% width) suggests probable weekly moves remain marginal around the noise threshold absent a major catalyst. Given this protracted compression pattern, elevated VIX signaling defensive positioning, forward PE 23.60 vulnerability, unresolved March 17-18 FOMC binary outcome with zero cuts priced, and the index unable to generate directional momentum for 10 consecutive weeks, a cautious BEARISH lean with low conviction appears warranted. The bias reflects technical exhaustion after failing multiple 7000 breakout attempts, elevated volatility regime expansion entering a critical Fed catalyst, and asymmetric risk from stretched valuations at a market inflection point. However, conviction remains measured at 5/10 given March-April seasonal tailwinds, potential for Fed rhetoric to surprise dovish, and the reality that 10-week consolidations often precede significant moves in either direction. The market essentially bets that March FOMC can provide the catalyst to resolve this protracted indecision, with the risk skewed toward breakdown given December's hawkish recalibration remains unresolved and forward multiples offer limited margin for disappointment. Near-term price action likely remains range-bound in the 6800-6950 zone until the March 17-18 catalyst provides directional clarity.

═════════════════════════════════════════════════
Source: Macro Agent Desk (macroagentdesk.com)


