S&P 500 (ES) — DeepSeek AI disruption aftershock persists as markets digest technology sector…
Cautiously neutral with growing defensive positioning after DeepSeek disruption and February seasonality concerns tempering January optimism despite positive earnings momentum

Cautiously neutral with growing defensive positioning after DeepSeek disruption and February seasonality concerns tempering January optimism despite positive earnings momentum
DeepSeek AI disruption aftershock persists as markets digest technology sector rotation and cost-efficiency narrative challenging AI infrastructure spending thesis
February seasonality headwinds historically weakest of major months averaging -0.1% with only 54% positive hit rate creating structural calendar resistance
Fed policy uncertainty following January 27-28 hawkish hold maintains restrictive stance at 3.50-3.75% with futures pricing only two 2026 cuts versus prior four-cut expectations
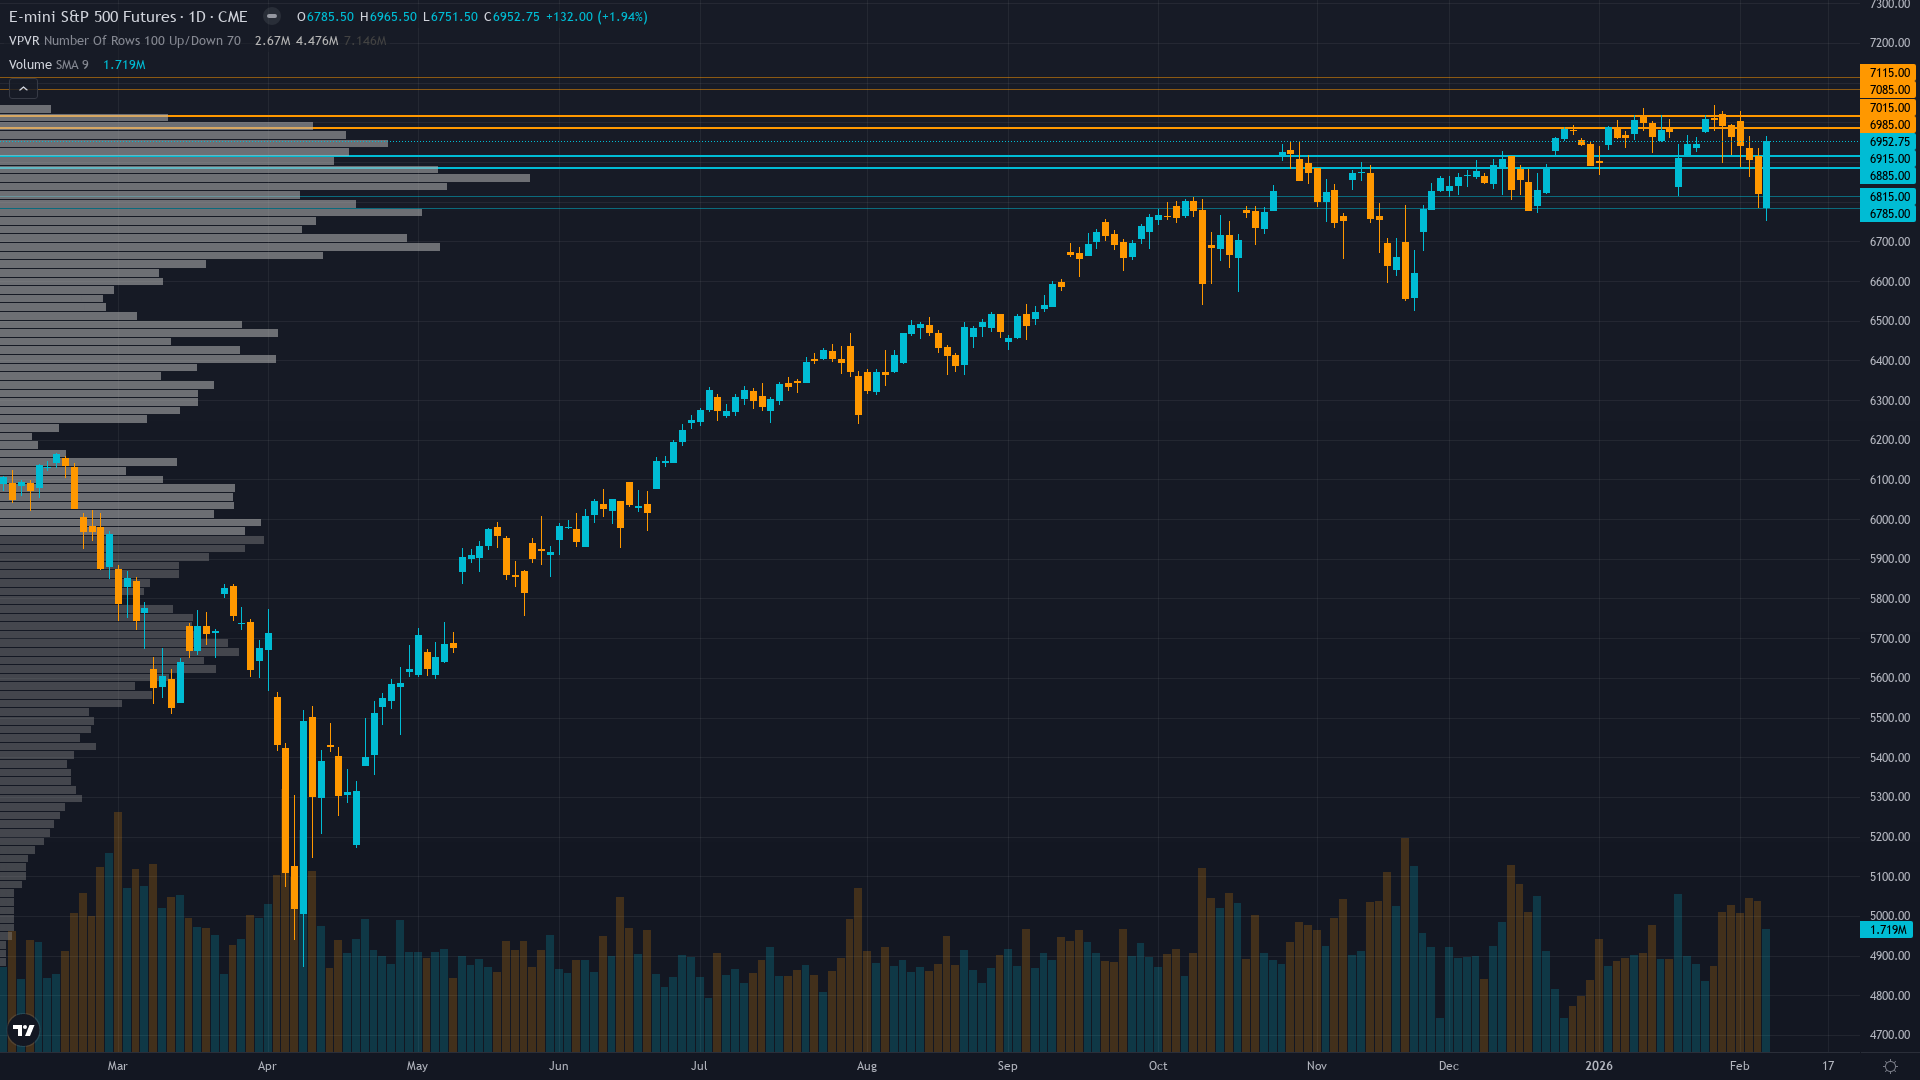
| ▲ Resistance Zone 2 | 7075 – 7125 |
| ▲ Resistance Zone 1 | 6975 – 7025 |
| ─ Pivot Area | ~6950 |
| ▼ Support Zone 1 | 6875 – 6925 |
| ▼ Support Zone 2 | 6775 – 6825 |
Consolidating in 6900-7000 range near psychological resistance after recovering from February 4-5 selloff that pushed S&P 500 briefly negative for 2026 before stabilizing
Q4 2025 earnings growth at 13.0% blended rate supports multiples but forward PE remains elevated creating vulnerability - Q1 2026 estimates call for 11.3% growth facing execution risk
Defensive rotation ongoing with elevated hedging despite proximity to record highs - technology concentration risk unwinding continues from late January DeepSeek catalyst
VIX elevated at 18.64 as of February 5 up from compressed January levels signaling renewed institutional anxiety despite surface recovery - 52-week range 13.38-60.13 shows historic volatility patterns
Fed held rates at 3.50-3.75% on January 27-28 after three consecutive cuts signaling restrictive stance maintained longer - futures price at most two 2026 reductions down from four-cut consensus creating monetary headwinds
Normal with expansion bias - VIX at 18.64 elevated from January compressed 14-15 range showing near-term fear premium developing after DeepSeek technology sector disruption
VIX spikes from compressed levels during technology sector shocks typically persist 10-15 days with 60% probability of sustained elevation when fundamental uncertainty remains unresolved as with current AI spending reassessment
VIX expansion from extreme January compression suggests 5-10 days elevated readings likely before normalization particularly given DeepSeek catalyst unresolved and February earnings catalysts creating binary outcomes
Normal-to-elevated volatility suggests 1.0-1.5% daily ES moves expected with current 6900-7000 consolidation representing 1.4% range - earnings surprises and Fed rhetoric present asymmetric expansion risk with potential 2-3% intraday swings on catalyst disappointments
Elevated vol from DeepSeek shock creates balanced but asymmetric setup - potential 5-8% downside to 6400-6500 zone if technology earnings disappoint or AI spending cuts materialize versus 3-5% upside to 7200-7300 if March-April seasonality and earnings resilience materialize despite structural headwinds from sector rotation and monetary policy restrictiveness
|
⚠️ Primary Risk
DeepSeek efficiency revolution forces revaluation of AI infrastructure spending thesis causing sustained technology sector underperformance and broader market multiple compression from elevated levels Probability: MEDIUM
|
✦ Primary Opportunity
February weakness proves transitory allowing seasonal mean reversion into March-April historically strongest period if earnings validate stretched multiples and Fed rhetoric softens Timeframe: Mid-February through March 2026
|
ES trades at 6,952.75 on February 8, 2026, consolidating just below the psychologically significant 7,000 level in a fragile equilibrium where multiple powerful crosscurrents create profound uncertainty. The index sits approximately 2% above its February 1 level of 6,965.75, having recovered from the violent February 4-5 selloff that briefly pushed the S&P 500 negative for 2026 before stabilizing. This volatility reflects markets grappling with the lingering aftershocks of late January's DeepSeek AI disruption - the Chinese startup's announcement of cost-efficient AI models that challenged the prevailing narrative of massive infrastructure spending requirements.
That catalyst triggered violent technology sector rotation, wiping nearly $600 billion from Nvidia's market value in a single session and forcing investors to reassess AI investment sustainability. The "DeepSeek Shock" now enters its second week as the defining narrative, with technology concentration risk unwinding as the Magnificent 7 stocks that comprise over 30% of S&P 500 market cap face sustained scrutiny. Beyond sector-specific concerns, ES confronts structural headwinds from February seasonality - historically the second-weakest month averaging -0.1% returns with only 54% positive hit rate since 1950, a stark contrast to January's traditionally strong patterns that delivered 1.3% gains in 2026.
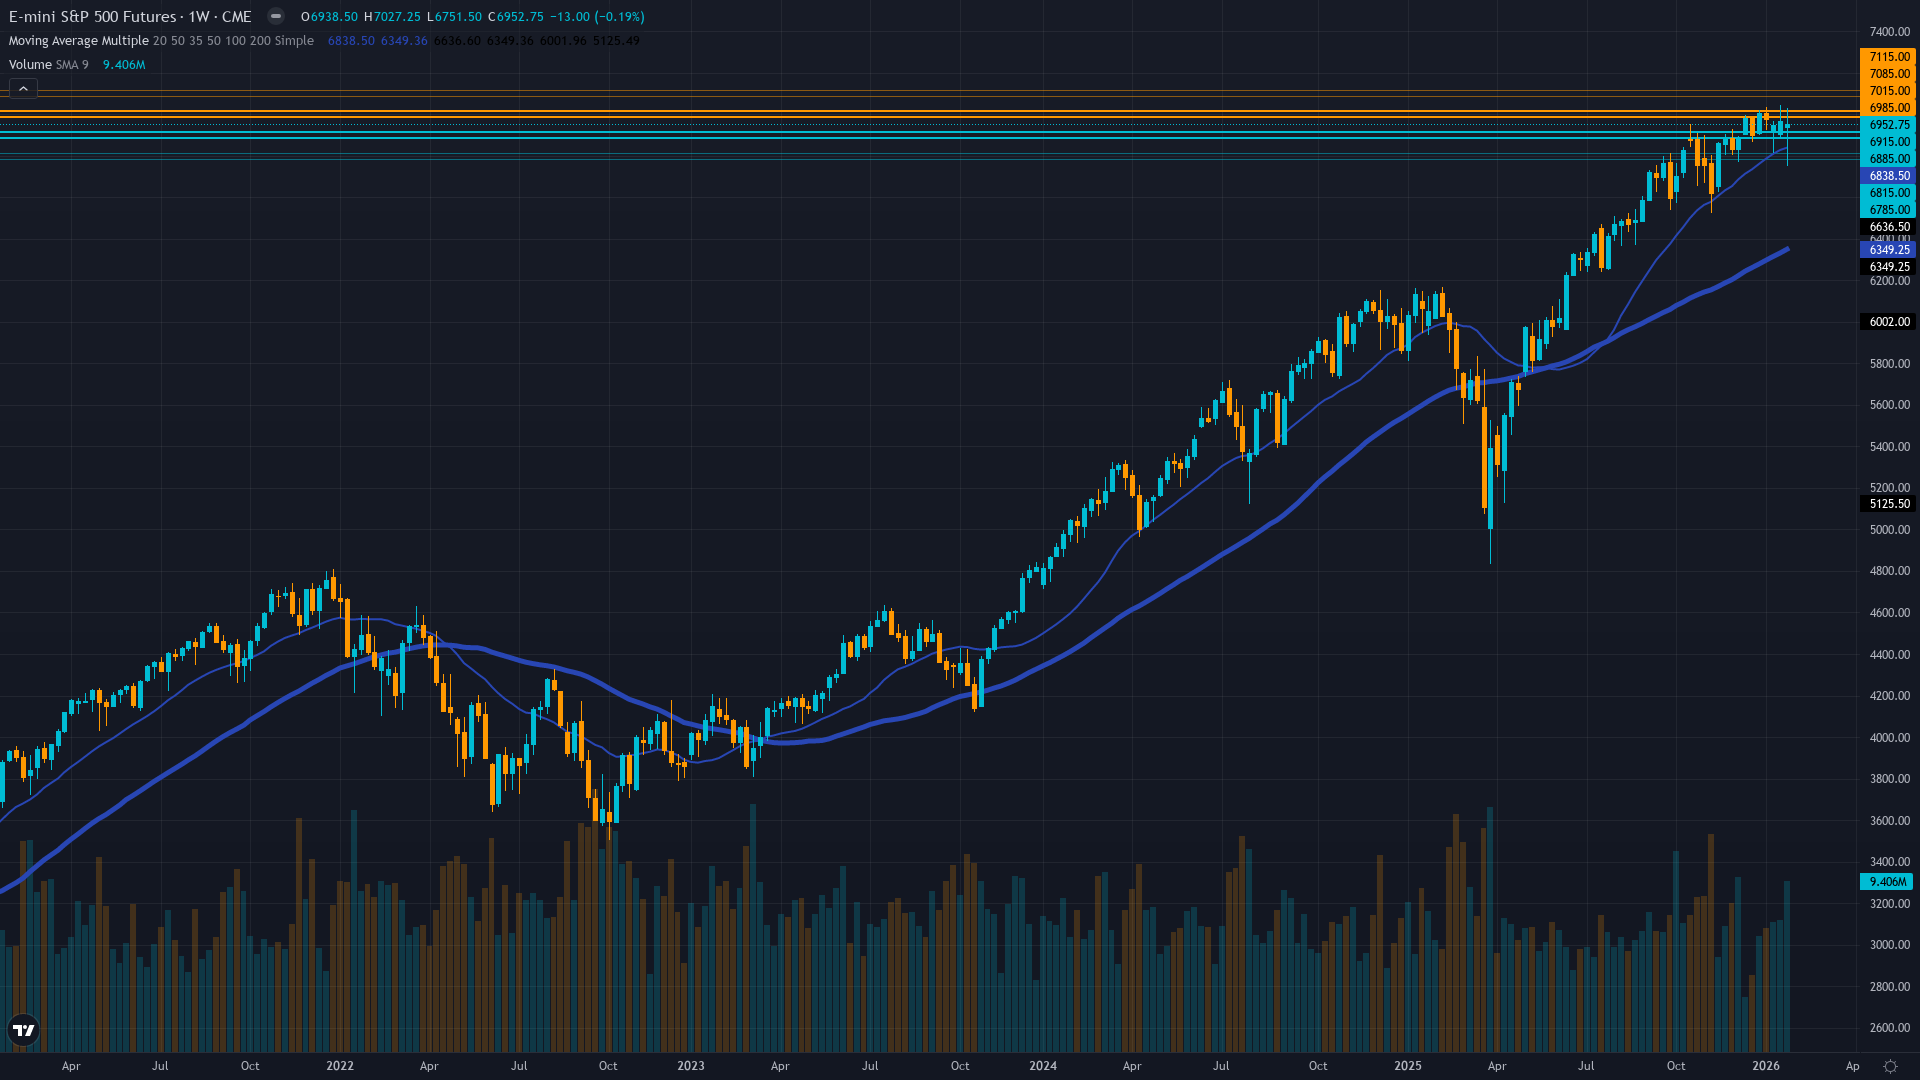
This calendar effect compounds Fed policy uncertainty following the January 27-28 FOMC meeting where the central bank held rates at 3.50-3.75% after three consecutive cuts, delivering a hawkish message that futures markets now price at most two 2026 reductions versus prior four-cut consensus. Technical structure shows consolidation in the 6900-7000 range with ES testing psychological resistance repeatedly without sustained breakout, creating a compression pattern that typically precedes volatile resolution.
The VIX at 18.64 as of February 5 represents meaningful expansion from January's compressed 14-15 range, signaling institutional hedging activity despite surface calm. Historical volatility metrics show 20-day vol at 11.83% positioning at relatively low levels but with expanding bias, while the VIX 52-week range of 13.38-60.13 illustrates the dramatic regime shifts experienced over the past year. Fundamental dynamics provide mixed signals: Q4 2025 earnings season delivers exceptional results with FactSet reporting 13.0% blended growth rate and 81% of early reporters beating estimates - the strongest performance since 2021.
However, forward estimates face scrutiny with Q1 2026 projections calling for 11.3% growth and Q2 at 14.9%, yet these must justify forward PE multiples that remain elevated despite compression from October's dangerous 30+ extreme to current levels. Wall Street consensus expects S&P 500 EPS of roughly $306 in 2026, implying 12.5% growth, but execution risk increases in an environment of technology sector disruption, Fed restrictive stance, and weakest annual job growth since 2003. Market positioning reflects institutional caution: despite proximity to record highs, elevated hedging persists with defensive rotation ongoing from technology leadership.
The January Barometer delivered positive 1.3% gain historically predicting strong full-year performance with 87% accuracy, yet 2026 faces unique headwinds that may override seasonal patterns. Volatility intelligence reveals critical regime transition: the market moved from extreme January compression below 15 VIX to current elevated 18.64 reading, suggesting institutional positioning shifted from complacency to caution. This expansion typically persists 5-10 days after catalyst events, with current readings at day 4-5 of elevated regime suggesting additional volatility ahead.
Historical patterns show VIX spikes from compressed levels during technology sector shocks typically take 10-15 days to normalize, implying potential continued choppiness through mid-February. Looking ahead, ES navigates between binary scenarios: either February weakness proves transitory enabling seasonal mean reversion into the historically strong March-April period (March averages +1.0%, April +1.4% with March-May generating average 4.2% gains), or the combination of DeepSeek disruption, Fed hawkishness, stretched valuations, and calendar headwinds triggers deeper 5-8% correction toward 6400-6500 testing major support.
The critical near-term catalysts include ongoing Q4 earnings reports where technology companies must address DeepSeek implications for capital expenditure plans, February 19 release of January FOMC minutes providing policy clarity, and March 18-19 next FOMC meeting where Fed rhetoric may soften if economic data weakens. Current 6900-7000 consolidation represents either accumulation before spring rally or distribution before testing deeper support, with conviction measured at 6/10 given extreme cross-currents creating balanced but asymmetric risk.
The market essentially bets that Q1 earnings growth, potential Fed pivot if data softens, and seasonal March-April tailwinds can overcome technology disruption narrative, elevated starting valuations, and restrictive monetary policy - a precarious setup where both breakout to 7200 and breakdown to 6400 remain plausible within the quarter.
| Week | Bias | Confidence |
|---|---|---|
| February 8, 2026 | NEUTRAL | 6/10 |
| February 1, 2026 | NEUTRAL | 6/10 |
| January 25, 2026 | BULLISH | 6/10 |
| January 18, 2026 | BULLISH | 7/10 |
| January 11, 2026 | BULLISH | 7/10 |
| January 4, 2026 | BULLISH | 6/10 |
| December 28, 2025 | BULLISH | 7/10 |
| December 21, 2025 | BULLISH | 7/10 |
| December 14, 2025 | BEARISH | 8/10 |
| December 7, 2025 | BULLISH | 7/10 |
| November 30, 2025 | NEUTRAL | 7/10 |
| November 23, 2025 | NEUTRAL | 6/10 |


