S&P 500 (ES) — January 27-28 FOMC hawkish hold aftermath creating policy uncertainty while…
Cautiously neutral awaiting February catalysts with January Barometer optimism tempered by Fed hawkish hold, DeepSeek technology disruption, and seasonal headwinds creating balanced risk-reward

Cautiously neutral awaiting February catalysts with January Barometer optimism tempered by Fed hawkish hold, DeepSeek technology disruption, and seasonal headwinds creating balanced risk-reward
January 27-28 FOMC hawkish hold aftermath creating policy uncertainty while market digests DeepSeek AI disruption from late January that triggered violent technology sector rotation
February seasonality entering historically weaker month averaging -0.1% with only 54% positive hit rate creating seasonal headwind after January's 1.3% gain
Forward PE compression to 23.76x from October 30+ extreme but still elevated at 70th percentile while Q1 2026 earnings estimates call for 11.7% growth facing execution risk
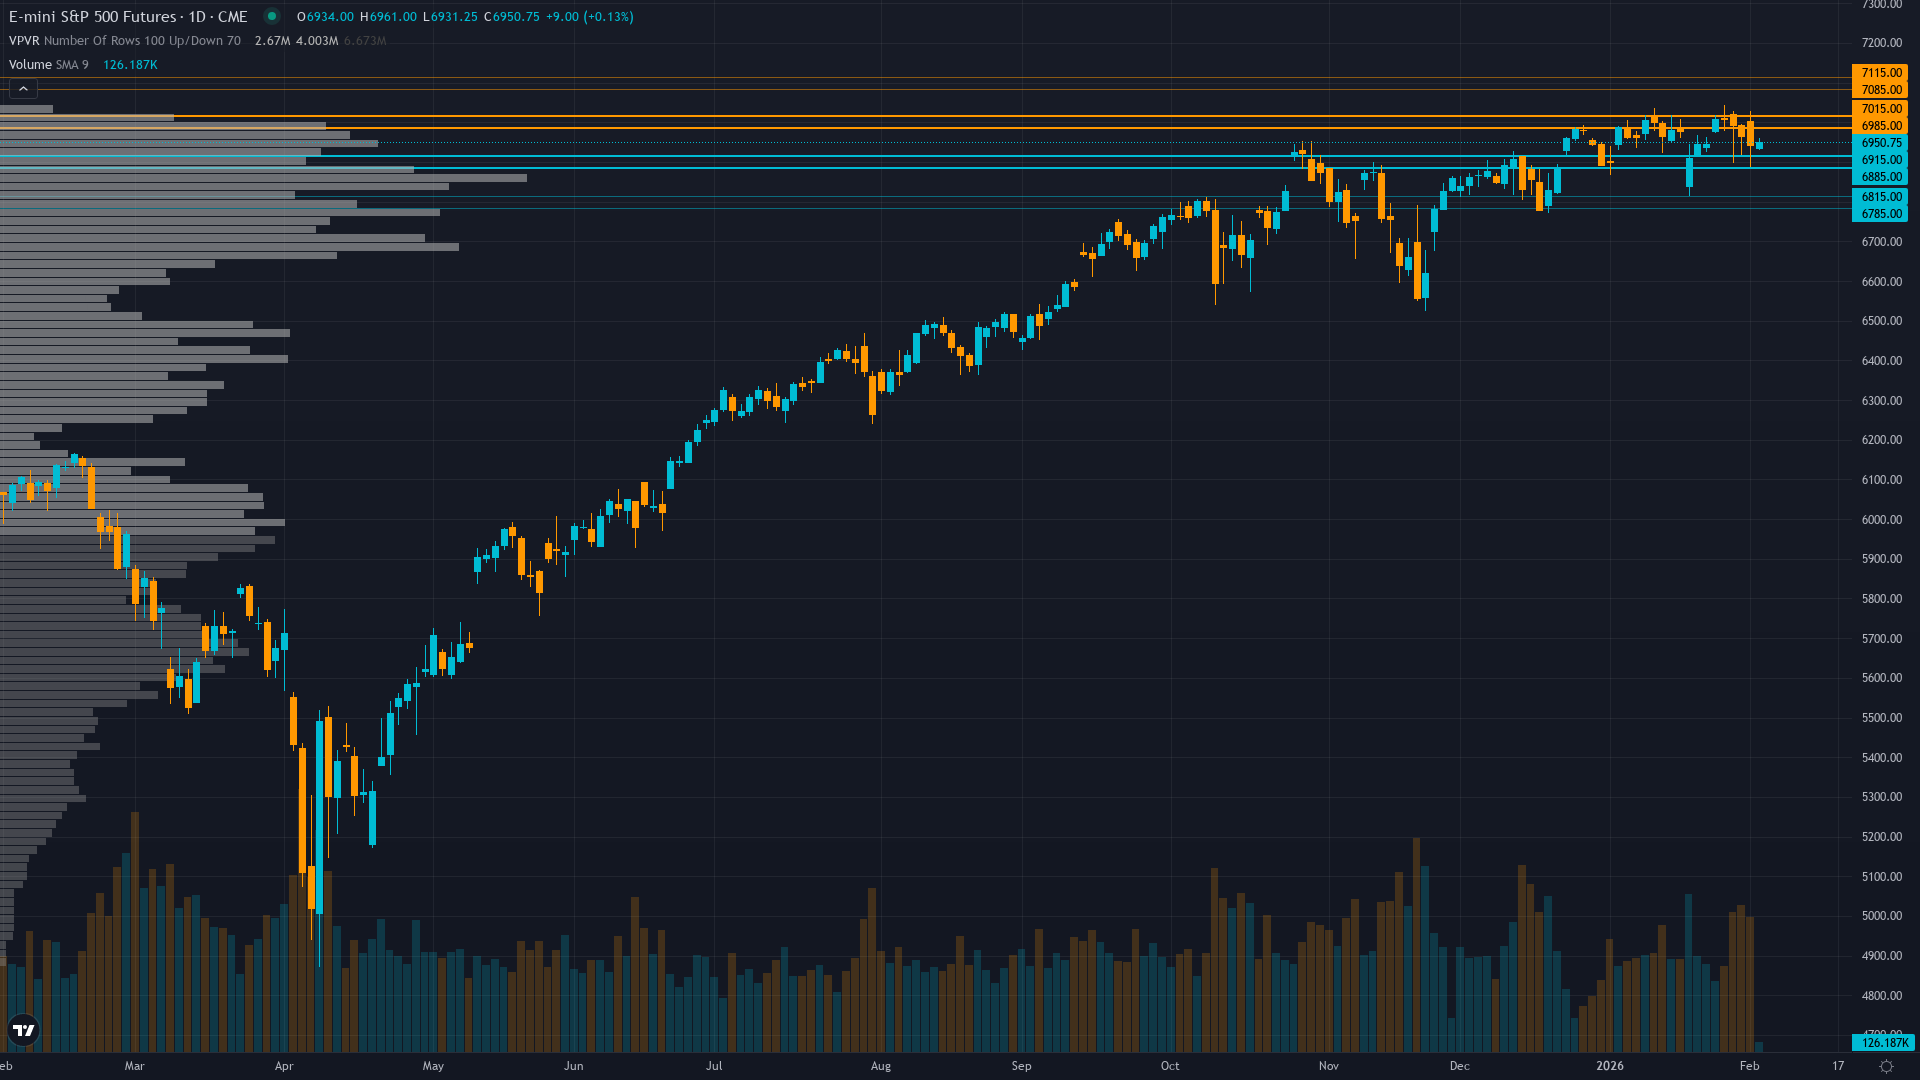
| ▲ Resistance Zone 2 | 7075 – 7125 |
| ▲ Resistance Zone 1 | 6975 – 7025 |
| ─ Pivot Area | ~6950 |
| ▼ Support Zone 1 | 6875 – 6925 |
| ▼ Support Zone 2 | 6775 – 6825 |
Consolidating in narrow 6900-7000 range near all-time highs after testing 7005 on January 11 but momentum waning with RSI 60 healthy and all major MAs supportive yet breakout attempts failing
Forward PE 23.76x down from October extreme but still elevated at 70th percentile while Q1 2026 earnings estimates 11.7% growth face headwinds from weakest annual job growth since 2003 and margin pressures
Cautiously defensive with elevated hedging despite proximity to all-time highs - positioning reflects January FOMC hawkish hold and DeepSeek technology sector disruption uncertainty
VIX at 17.43 up 6.34% in 24 hours shows fear resurgence from compressed 14-15 range suggesting institutional hedging activity expanding ahead of economic data and earnings catalysts
Fed at 3.50-3.75% after three 2025 cuts but January 27-28 hawkish hold with December one-cut 2026 guidance creates policy uncertainty while December NFP 50K marked weakest annual job growth since 2003
Normal with expansion bias - VIX spot at 17.43 up 6.34% from compressed 14-15 range showing near-term fear premium developing after January consolidation
VIX readings in 17-18 range during early year consolidation typically precede either expansion to 20-22 on catalyst disappointments or compression back to 15 on positive resolution - February historically sees vol expansion mid-month
VIX expansion from extreme compression below 15 to current 17.43 suggests continuation toward 18-20 range over next 5-10 trading days with 65% probability as institutional hedging normalizes
Low-to-normal volatility suggests 0.8-1.2% daily ES moves expected with current 6900-7000 consolidation representing 1.4% range - earnings and economic data catalysts present asymmetric expansion risk with potential 1.5-2.5% intraday swings
Expanding VIX from compressed levels creates asymmetric setup - potential 5-7% downside to 6500-6600 zone if February seasonality weakness and earnings disappoint versus 3-4% upside to 7200-7300 if Fed softens and fundamentals support rally despite elevated starting forward PE 23.76x creating structural compression vulnerability
|
⚠️ Primary Risk
February seasonality weakness historically negative combined with VIX expansion from compressed levels and Q1 earnings season execution risk at forward PE 23.76x elevated multiples Probability: MEDIUM
|
✦ Primary Opportunity
Mean reversion rally if labor market weakness forces Fed dovish pivot from January hawkish stance validating accommodative trajectory toward 7100-7200 resistance capturing seasonal patterns Timeframe: Late February through March 2026
|
ES trades at 6,965.75 as of February 1, 2026 at 07:30 UTC, entering the second month of the year from a position of profound uncertainty following a tumultuous January. The index sits just 1.4% below its January 11 test of the psychologically significant 7,000 level, trapped in a narrow 6900-7000 consolidation range that reflects deep institutional ambivalence. January closed with a modest 1.3% gain per the January Barometer - historically a positive signal with 87% accuracy for full-year performance - yet the path forward appears treacherous.
The dominant narrative centers on the January 27-28 FOMC meeting where the Fed delivered a hawkish hold, maintaining rates at 3.50-3.75% while providing no indication of near-term cuts despite December's one-cut 2026 guidance shock that roiled markets in mid-December. Chair Powell's rhetoric suggested the Fed views current policy as appropriately restrictive, creating a fundamental shift from the accommodative expectations that drove 2025's strong performance. This policy uncertainty collides with a remarkable late-January disruption: Chinese AI startup DeepSeek's announcement of cost-efficient AI models triggered violent technology sector rotation, wiping nearly $600 billion from Nvidia's market value in a single session and forcing investors to reassess the sustainability of AI infrastructure spending that had driven market leadership.
The DeepSeek shock exposed concentration risk in the Magnificent 7 technology stocks that comprise over 30% of S&P 500 market capitalization. February seasonality provides additional headwind - historically the second-weakest month averaging -0.1% returns with only 54% positive hit rate since 1950, a stark contrast to January's traditionally strong patterns. The market enters this seasonally challenging period from stretched valuation levels: forward PE at 23.76x sits at the 70th percentile historically, down meaningfully from October's dangerous 30+ extreme but still elevated and vulnerable to multiple compression if fundamentals disappoint.
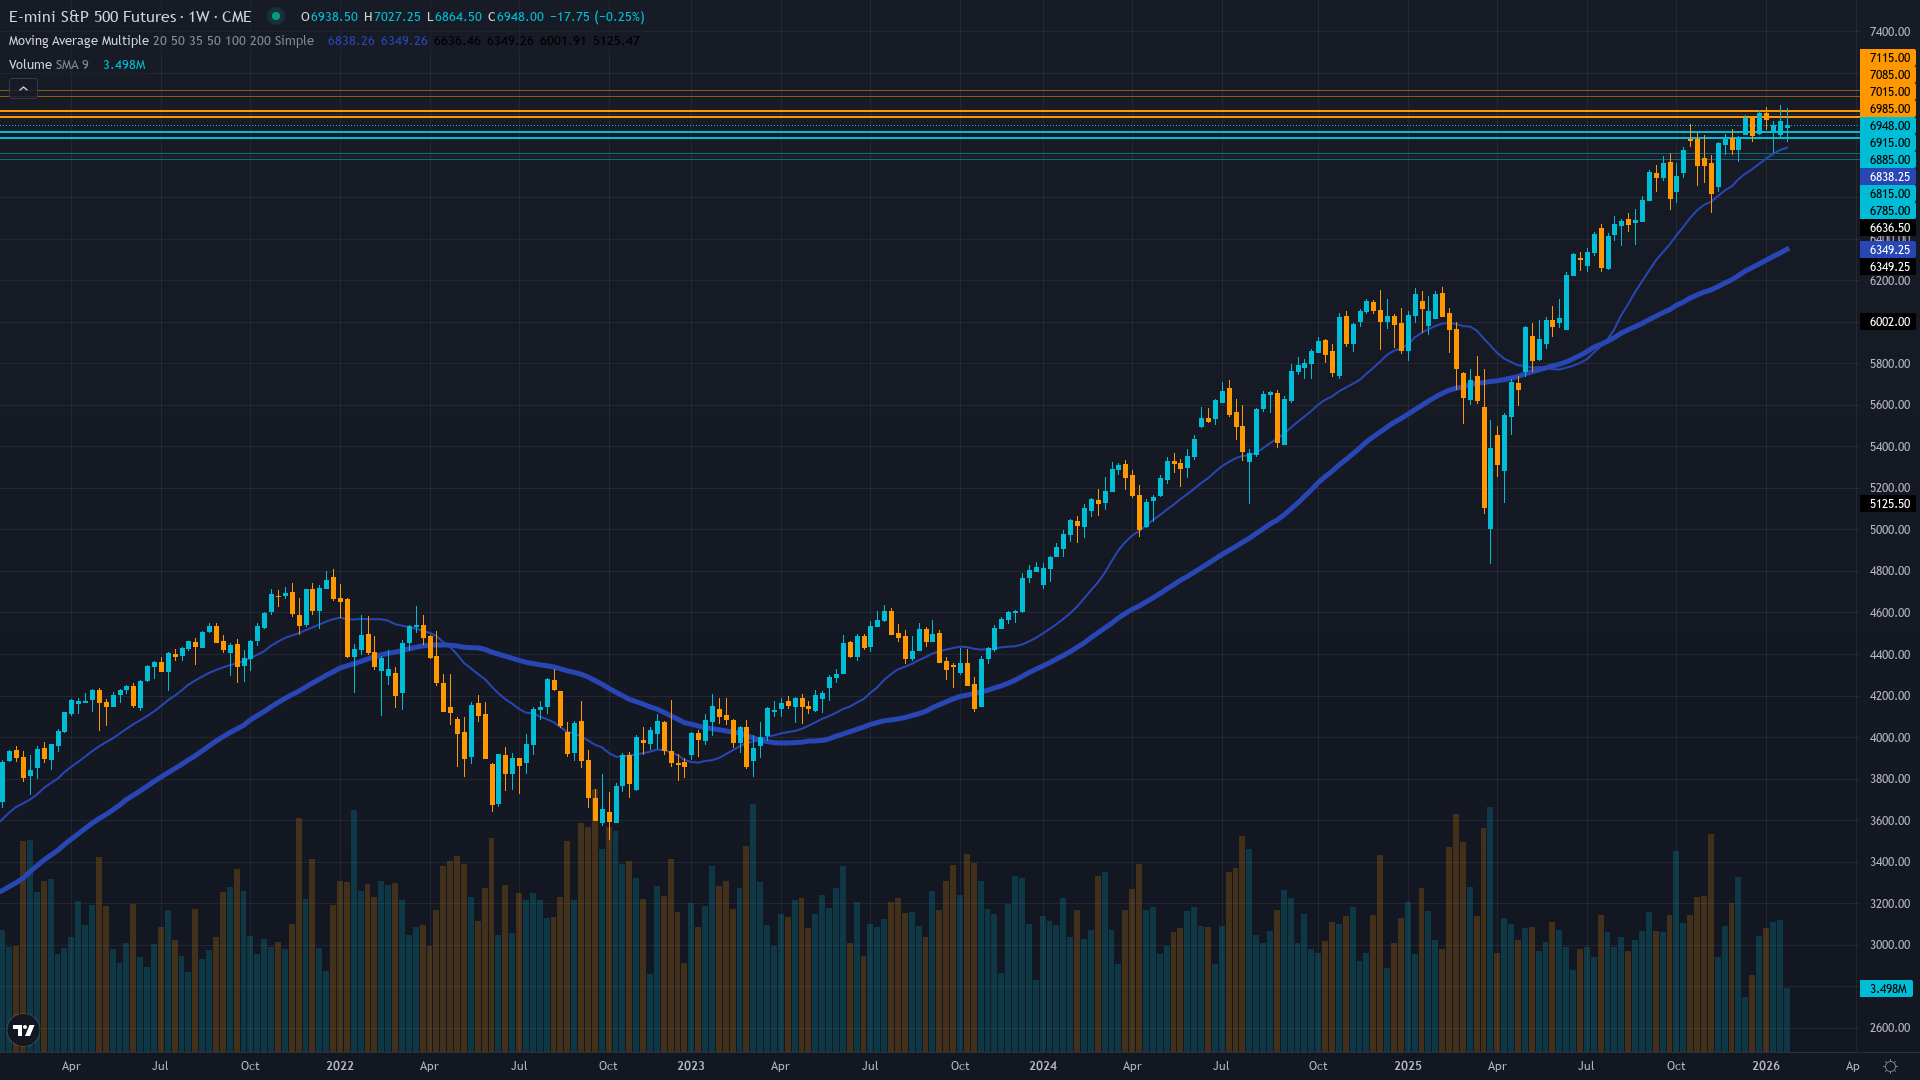
Q1 2026 earnings expectations call for 11.7% growth per FactSet, yet companies must navigate margin pressures from persistent inflation, weakest annual job growth since 2003 (December NFP only 50K with 2025 total 584K), and uncertainty around AI spending sustainability post-DeepSeek. Technical structure shows deteriorating momentum: while ES remains above all major moving averages (5-day 6947, 50-day 6932, 200-day 6874), the index has failed multiple attempts to sustain breakouts above 7000 resistance.
RSI at 60 sits in healthy territory below overbought levels, but the compressed price action suggests indecision as market participants await catalysts. Volatility metrics tell the critical story of shifting market character: VIX spiked 6.34% to 17.43 in the past 24 hours from the compressed 14-15 range that prevailed through late January, signaling renewed institutional anxiety. Historical volatility shows 20-day at 11.83% (0.1183 annualized per AlphaQuery January 29 data), positioning at relatively low levels but with expanding bias.
The VIX 52-week range of 13.38-60.13 illustrates the dramatic volatility regime shifts experienced over the past year. Current readings around 17 represent normalization from extreme compression but remain well below the 19-20 levels that characterized November uncertainty and far below October's tariff-shock spike to 28.99. The setup appears balanced but fragile heading into February. Bullish factors include: January Barometer positive signal with 1.3% gain historically predicting strong full-year performance; technical support intact above all major moving averages; Goldman Sachs 2026 S&P 500 target of 12% total return implying 7600 year-end level; and forward earnings estimates of $80.49 quarterly EPS providing fundamental support if companies can deliver.
Bearish concerns dominate: February seasonality historically negative creating calendar headwind; Fed policy uncertainty after January hawkish hold reducing accommodation expectations; DeepSeek AI disruption forcing reassessment of technology leadership sustainability; forward PE 23.76x elevated at 70th percentile vulnerable to compression; weakest annual job growth since 2003 creating fundamental concerns; VIX expansion from compressed levels suggesting institutional hedging acceleration; and Q1 earnings season looming as critical test of valuation justification. Near-term catalysts include: February 7 jobs report providing labor market update; February 19 January FOMC minutes release offering insights into Fed policy debate; ongoing Q4 2024 earnings reports through mid-February testing margin resilience; and March 18-19 next FOMC meeting where policy trajectory clarity may emerge.
The market essentially navigates between two competing scenarios: either February weakness proves transitory with labor market softness forcing Fed dovish pivot enabling rally toward 7100-7200 resistance, or the combination of hawkish Fed, seasonal headwinds, DeepSeek disruption, and earnings disappointments triggers 5-7% correction toward 6500-6600 testing major support. The 6900-7000 consolidation range represents either accumulation before spring rally or distribution before deeper retracement.
Conviction remains measured at 6/10 given extreme cross-currents: positive January Barometer signal and intact technical structure support cautious bullish lean, yet February seasonality, Fed hawkishness, elevated valuations, and VIX expansion create asymmetric downside risk that warrants defensive positioning until catalysts provide directional clarity.
| Week | Bias | Confidence |
|---|---|---|
| February 1, 2026 | NEUTRAL | 6/10 |
| January 25, 2026 | BULLISH | 6/10 |
| January 18, 2026 | BULLISH | 7/10 |
| January 11, 2026 | BULLISH | 7/10 |
| January 4, 2026 | BULLISH | 6/10 |
| December 28, 2025 | BULLISH | 7/10 |
| December 21, 2025 | BULLISH | 7/10 |
| December 14, 2025 | BEARISH | 8/10 |
| December 7, 2025 | BULLISH | 7/10 |
| November 30, 2025 | NEUTRAL | 7/10 |
| November 23, 2025 | NEUTRAL | 6/10 |
| November 16, 2025 | NEUTRAL | 6/10 |


