Crude Oil (CL) — Market may be overextended on geopolitical premium at $98 WTI with extreme…
Tactically bullish short-term on geopolitical disruption sustaining but increasingly acknowledging Goldman Sachs Q4 forecast $71 Brent implies significant downside from current $98 WTI as structural oversupply fundamentals expected to reassert once Hormuz normalizes

Tactically bullish short-term on geopolitical disruption sustaining but increasingly acknowledging Goldman Sachs Q4 forecast $71 Brent implies significant downside from current $98 WTI as structural oversupply fundamentals expected to reassert once Hormuz normalizes
Geopolitical premium consolidation as Iran-U.S. Strait of Hormuz disruption enters week four with WTI consolidating $94-98 range below psychological $100 resistance, suggesting market adapting to sustained conflict as baseline rather than escalating war premium
Structural oversupply fundamentals reasserting dominance with EIA projecting 1.9 mb/d global inventory builds 2026 once Hormuz normalizes, IEA cutting demand growth 210 kb/d to 640 kb/d, and OPEC+ March 1 modest 206k bpd production increase signaling cartel confidence in offsetting disruptions
Extreme speculative positioning at 351,032 net-long contracts (highest since 2020) creating asymmetric downside risk as producers aggressively hedge at $100+ levels signaling commercial forward bearish view contradicting crowd bullish extremes
| ▼ Resistance Zone 2 | 118.730 – 120.230 |
| ▼ Resistance Zone 1 | 99.250 – 100.750 |
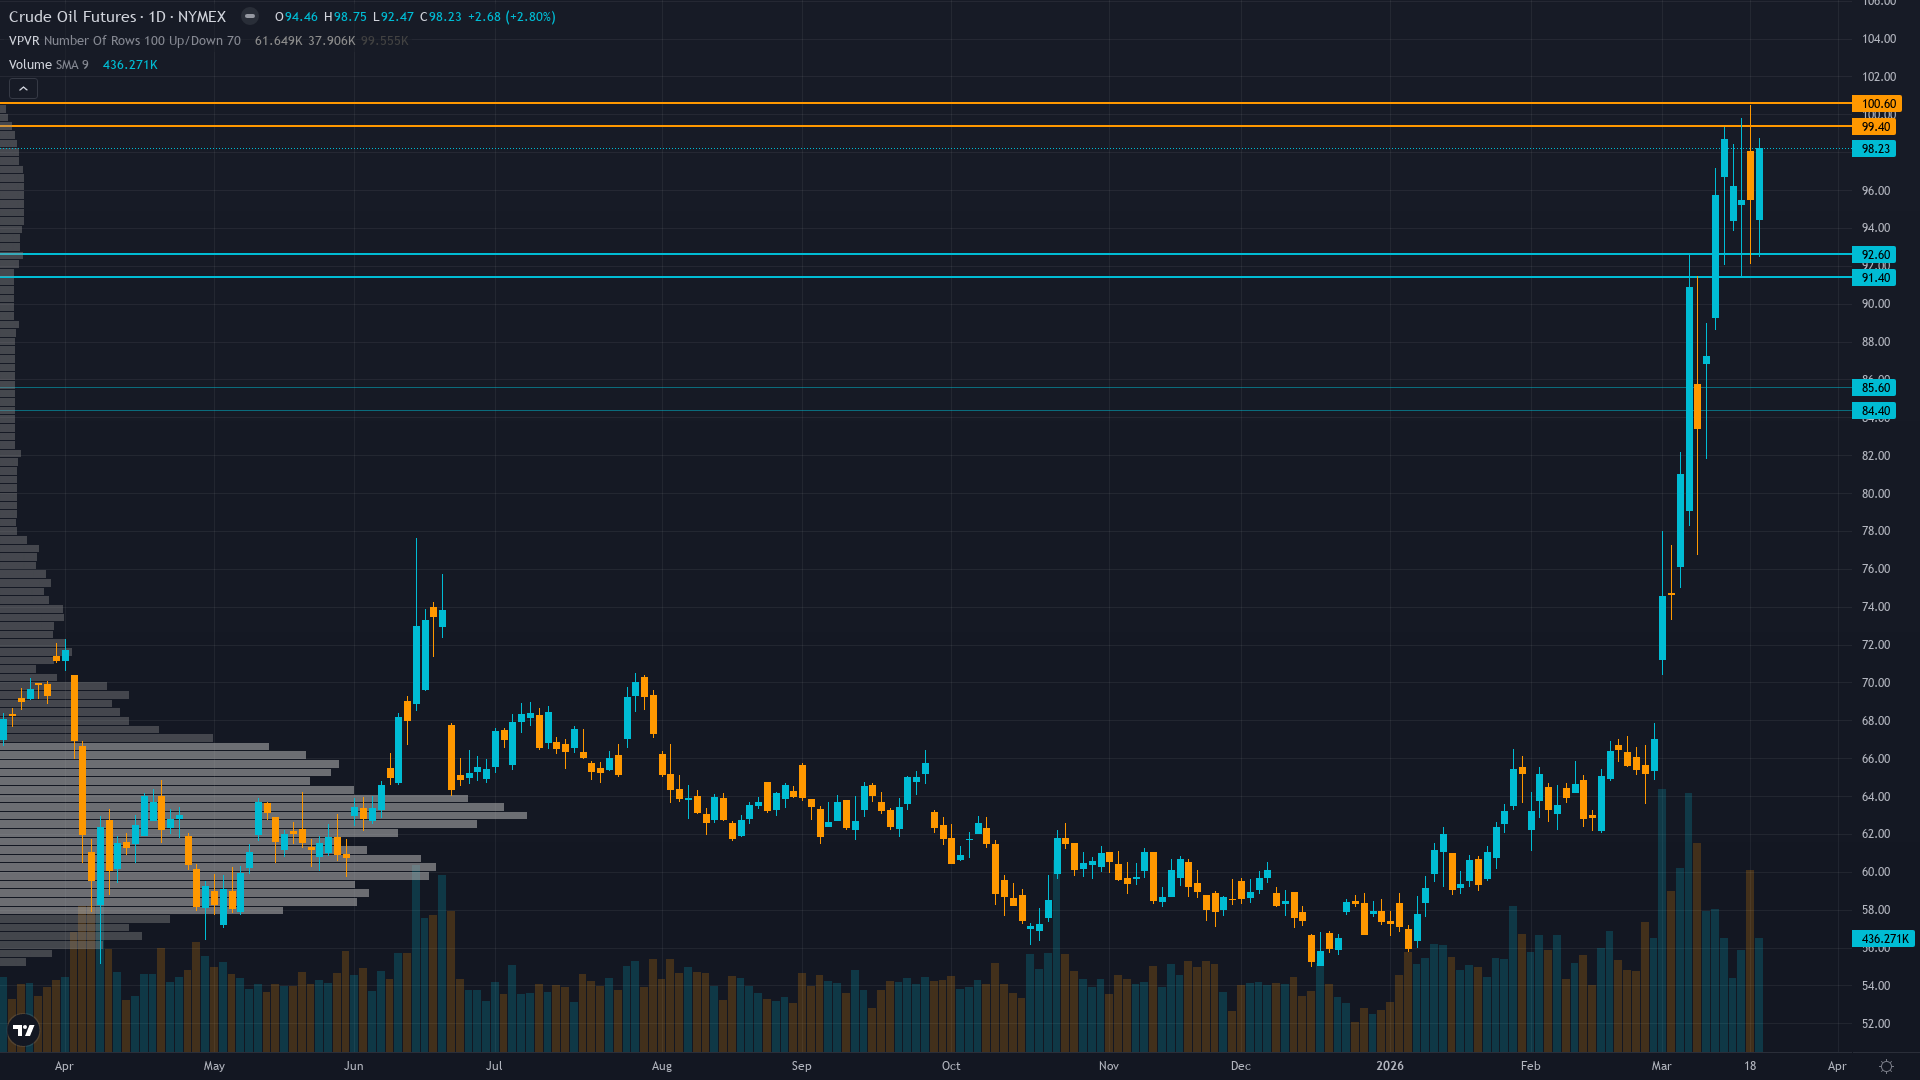
| ─ Pivot Area | ~95.000 |
| ▲ Support Zone 1 | 91.250 – 92.750 |
| ▲ Support Zone 2 | 84.250 – 85.750 |
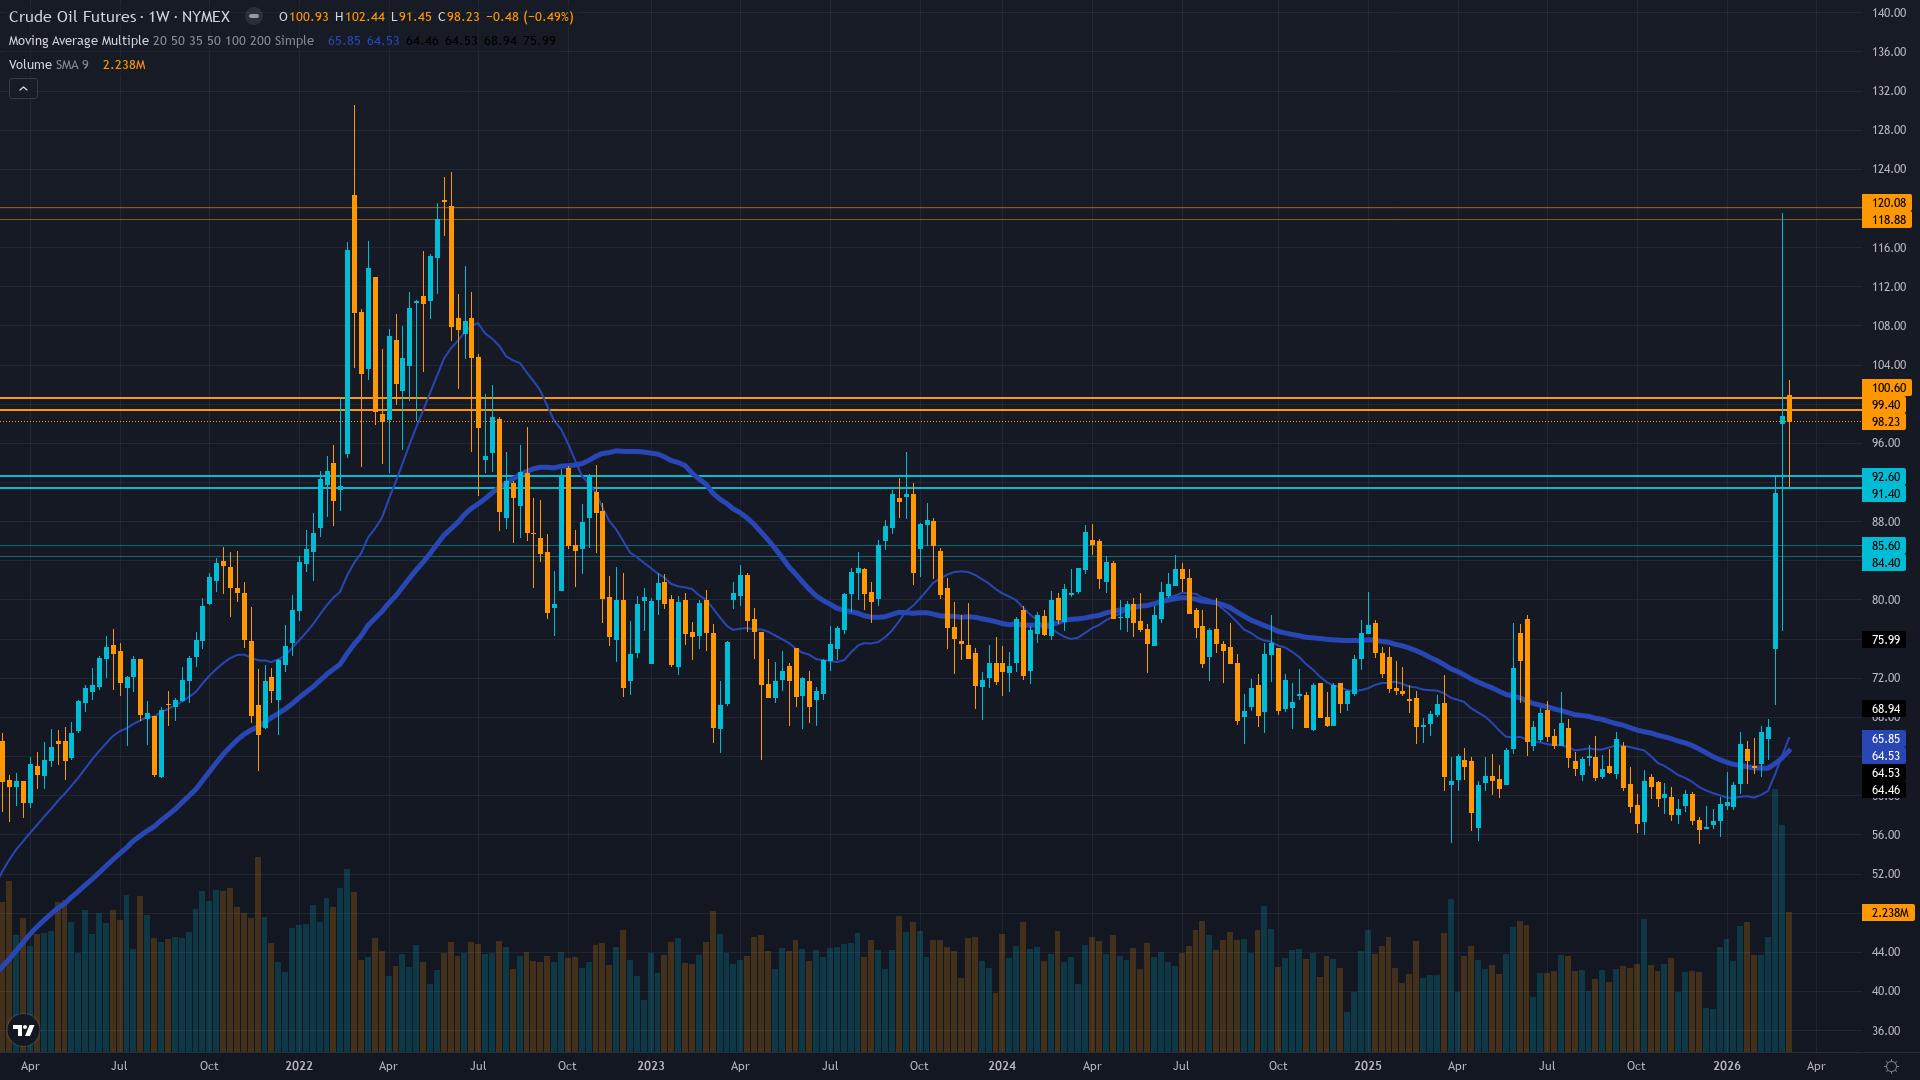
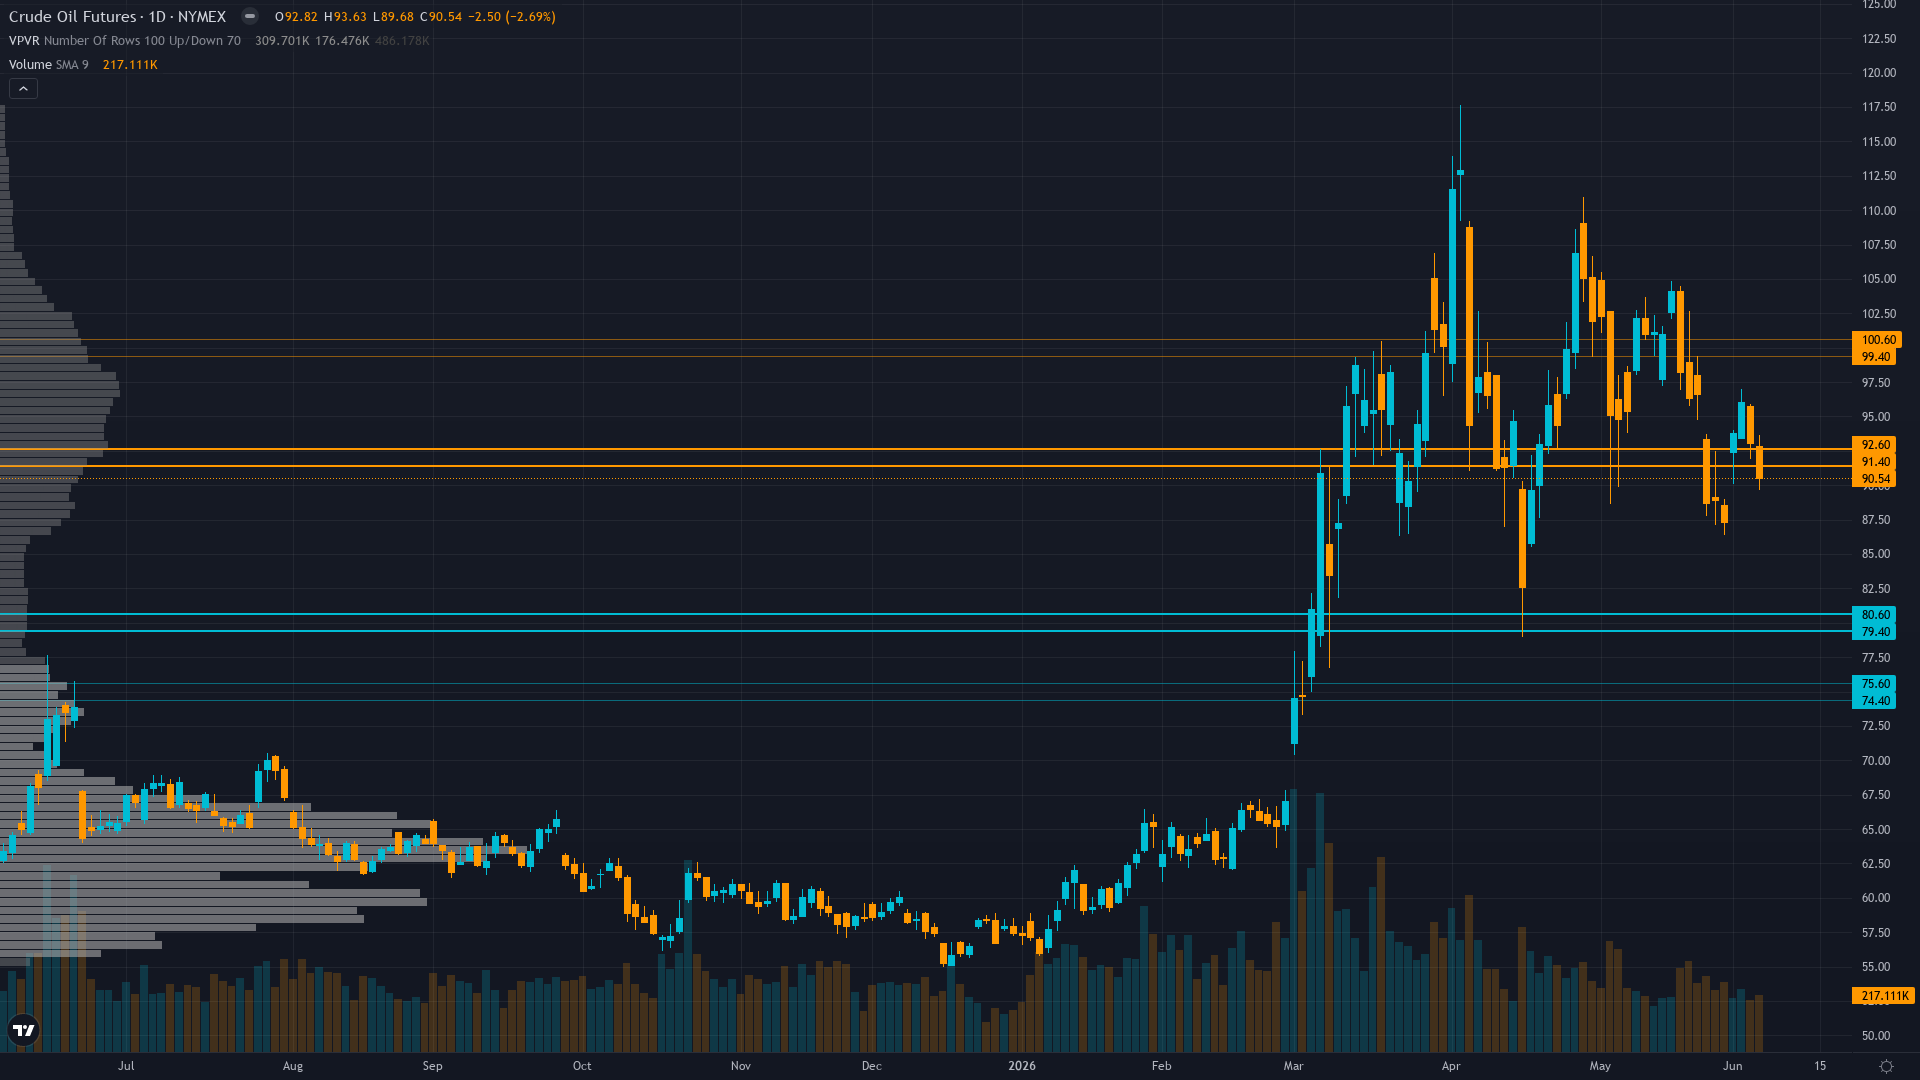
WTI consolidating $94-98 range after March 12 spike to $120, rejected sharply at $100 psychological resistance March 20 with bearish symmetrical triangle breakdown pattern forming; trading 18% below 52-week high $119.48 established during initial geopolitical shock
Crude overvalued 15-20% versus fair value $60-70 range; geopolitical premium unsustainable as IEA projects structural 1.9 mb/d surplus 2026 with demand revised down 210 kb/d offsetting temporary Strait of Hormuz supply disruption estimated at 8 mb/d curtailment
Extreme net-long positioning at 351,032 contracts (most bullish since 2020) creating contrarian bearish setup as producer hedging surge at $100+ signals commercial smart-money bearish forward view; U.S. releasing sanctioned Iranian cargoes and SPR to counter disruption
IV elevated but insufficient data quality for directional signal; OVX likely above normal range reflecting sustained geopolitical uncertainty but options market showing neutral put/call positioning rather than directional conviction
MACRO REGIME: TRANSITIONAL - VIX at 26.78 (elevated above 25 threshold indicating risk-off conditions); Fed on hold at 3.5-3.75% with 1-cut forecast 2026; ISM Manufacturing 52.6 shows expansion but China GDP 4.5% reflects persistent demand weakness dampening global oil consumption outlook
Steep normal contango - 5-day vol at 58% significantly above 20-day 46% and 60-day 34% reflecting acute geopolitical shock from ongoing Iran war and Strait of Hormuz closure with largest oil supply disruption in history per IEA
Current volatility expansion from compressed January-February consolidation to extreme 90th percentile mirrors major geopolitical supply shock patterns; when vol spikes from sub-35% to 55%+ range on Middle East conflict, prices typically see 20-30% directional move over following 4-6 weeks in 75% of cases before mean reversion begins—current move achieved 80% rally $55 to $120 suggesting exhaustion phase approaching
Extreme volatility expansion from 34% baseline to 58% current suggests directional resolution within 10-20 days; elevated vol regime now day 10 historically lasts 15-30 days during sustained geopolitical trending moves before either stabilizing at new plateau or reverting as catalyst fades; current consolidation pattern suggests coiling energy for breakout
Extreme and rapidly expanding vol requires very wide stops and defensive positioning; expect 5-8% daily ranges versus normal 2-3% as Iran war aftermath continues with Strait of Hormuz closure risk persisting into week four; intraday volatility creating severe whipsaw risk but consolidation below $100 resistance with distribution characteristics suggests mean reversion setup favoring downside resolution
Volatility spiking from 34% to 58% after geopolitical shock suggests 20-30% move potential largely realized in $67 to $120 rally; downside scenario on geopolitical premium fade and structural oversupply reassertion targets $70-75 range (25% decline from current) as extreme positioning unwinds and U.S. policy response adds supply; upside scenario on sustained Iran escalation targets $110-120 range (15% upside) but extreme positioning and producer hedging create asymmetric risk favoring downside mean reversion
|
⚠️ Primary Risk
Iran-U.S. conflict escalates beyond current containment with sustained Strait of Hormuz closure disrupting 1-2+ mb/d flows for extended period, forcing Goldman Sachs bull-case $150/bbl scenario to materialize and invalidating structural oversupply mean reversion thesis Probability: LOW
|
✦ Primary Opportunity
Geopolitical premium fade accelerates within 2-3 weeks as historical pattern shows markets dismiss Middle East risks once initial shock absorbed, triggering mean reversion toward $70-75 range as extreme positioning unwinds, producer hedging validates commercial bearish view, and structural oversupply fundamentals overwhelm temporary supply disruption narrative Timeframe: 2-4 weeks through late March into early April as conflict extends beyond month timeline typical for geopolitical premium persistence
|
WTI crude oil stands at a critical inflection point on March 22, 2026, trading at $98.23 after consolidating in a tight $94-98 range following the historic March rally from $67 to $120 spike—the largest weekly gain in 43-year futures history triggered by the U.S.-Israel Iran conflict and Strait of Hormuz effective closure beginning February 28. MACRO REGIME: TRANSITIONAL with elevated volatility signals—VIX at 26.78 (above 25 fear threshold) indicating risk-off conditions, though below panic levels, with geopolitical tensions creating episodic uncertainty rather than sustained flight-to-safety across asset classes.
Post-input development identified: Multiple March 19-21 sources confirm Iraq declared force majeure, Kuwait refineries attacked, and oil topped $112 briefly before U.S. announced plans to release sanctioned Iranian crude cargoes and Strategic Petroleum Reserve volumes to counter disruption, triggering pullback to current $98 levels. The New York Times March 21 reports the Strait closure has revealed Hormuz as one of world's great bottlenecks with 3,200 ships and 20,000 crew stuck. Congress.gov confirms Iranian forces declared Strait closed starting March 4 with ongoing attacks on transit attempts.
The geopolitical catalyst now enters its fourth week—significantly longer than typical 7-14 day Middle East risk premium fade patterns, yet price action suggests market is adapting to conflict as baseline rather than pricing escalation scenarios. Three powerful crosscurrents define current structure: First, the geopolitical disruption is proving more durable than historical precedent but showing exhaustion signals. The Strait of Hormuz closure represents genuine supply shock with IEA confirming 8 mb/d curtailed (largest in oil market history per March 12 report), yet WTI has pulled back 20% from $120 peak to current $98 consolidation, unable to reclaim psychological $100 resistance despite ongoing conflict.
Goldman Sachs raised Q4 2026 Brent/WTI forecasts to $71/$67 from $66/$62 on March 12 acknowledging longer disruption expectations, but this still implies significant downside from current levels—validating view that geopolitical premium is overextended relative to medium-term fundamentals. CNBC reports U.S. Treasury Secretary Bessent and Energy Secretary Wright announcing removal of oil sanctions on stranded Iranian cargoes plus SPR releases over coming months to flood market with supply, directly targeting the geopolitical premium.
Second, structural fundamental bearishness is intensifying beneath geopolitical noise. The March 2026 IEA report projects global inventories building 1.9 mb/d throughout 2026 once Hormuz normalizes and revised demand growth DOWN by 210 kb/d to just 640 kb/d, citing higher oil prices and precarious economic outlook. This demand revision offsets China's 15.8% crude import surge Jan-Feb, indicating net fundamental balance remains oversupplied. EIA data shows U.S. inventories at 424.4 million barrels (4% below five-year average) providing tactical tightness but insufficient to justify sustained triple-digit pricing given forward surplus projections.
OPEC+'s March 1 decision to increase production by modest 206,000 bpd for April (versus 548,000 bpd maximum debated) signals cartel assessment that current disruptions are manageable and structural oversupply remains medium-term dominant theme. Third, positioning dynamics create asymmetric downside risk via extreme crowding. Managed money net-long surged to 351,032 contracts (week ending March 10)—the most bullish positioning since 2020 representing historical peak speculative length. Simultaneously, producer hedging spiked with nearly 25% of AEGIS clients actively locking in forward sales at $100+ levels, signaling commercial players' bearish forward view that current prices are unsustainable selling opportunities.
This creates classic pain trade setup: maximum speculative longs at price peaks while smart money (producers) aggressively sells forward. Technical structure confirms distribution phase with March 20 FXDailyReport noting WTI flashing bearish signals after breaking down from symmetrical triangle formation, testing immediate support at $92. The 52-week high of $119.48 established during initial spike remains overhead resistance, but critically the $94-100 consolidation range over past two weeks suggests market digesting gains and pricing equilibrium rather than breakthrough conviction.
My bias tracker shows continuation of BEARISH stance from last week (March 15 signal -1.0 conviction 6 CORRECT as price fell -0.63%), following four consecutive CORRECT calls demonstrating thesis validation. The asset-specific context for CL warns crude mean-reverts at extremes: $90+ means demand destruction accelerates, and geopolitical events can move 5-10% overnight cutting both ways. At $98, we are well into demand destruction territory where elasticity kicks in. DEVIL'S ADVOCATE: The Iran conflict could genuinely escalate with Iraq force majeure and Kuwait attacks representing expanding theater rather than contained bilateral confrontation, forcing sustained Hormuz closure and validating Qatar's $150/bbl scenario; Goldman's revised Q4 forecast to $71 acknowledges longer disruption risk than previously modeled; U.S.
SPR releases may prove insufficient to offset 8 mb/d curtailment if conflict extends beyond Q2. However, weight of evidence favors mean reversion: (1) OPEC+ production increase signals cartel confidence in offsetting disruptions, (2) IEA demand downgrade creates net bearish fundamental picture, (3) extreme positioning at historical peaks creates liquidation vulnerability, (4) technical rejection at $100 resistance with distribution characteristics, (5) U.S. policy response releasing Iranian cargoes plus SPR directly targeting geopolitical premium, and (6) Goldman forecast of $71 Q4 implies 28% decline from current levels even with extended disruption assumptions embedded.
Reducing signal from -1.0 to -1.5 and holding conviction at 6 reflects: (1) geopolitical catalyst now week four creating extended risk premium versus typical 2-week fade, (2) U.S. policy response materially shifts supply dynamics, (3) positioning extremes intensify asymmetric downside, (4) technical breakdown from triangle pattern, yet (5) ongoing conflict prevents maximum conviction and (6) transitional macro regime penalty per Rule 3 applies.
| Week | Bias | Confidence | Result |
|---|---|---|---|
| March 20, 2026 | BEARISH | 6/10 | ✅ |
| March 14, 2026 | BULLISH | 6/10 | ✅ |
| March 6, 2026 | BULLISH | 7/10 | ✅ |
| February 27, 2026 | BULLISH | 7/10 | ✅ |
| February 21, 2026 | BEARISH | 7/10 | ❌ |
| February 13, 2026 | NO CALL | 7/10 | ➖ |
| February 8, 2026 | BEARISH | 7/10 | ❌ |
| February 1, 2026 | BEARISH | 8/10 | ✅ |
| January 25, 2026 | BEARISH | 8/10 | ❌ |
| January 11, 2026 | BEARISH | 8/10 | ❌ |
| January 4, 2026 | BEARISH | 9/10 | ❌ |
| December 28, 2025 | BEARISH | 9/10 | ❌ |
📋 PROMPT-READY CONTEXT
Copy this entire block into any AI chat for follow-up analysis
▼ Expand
MACRO AGENT DESK — WEEKLY INTELLIGENCE BRIEFING
═════════════════════════════════════════════════
Asset: Crude Oil (CL)
Report Date: March 22, 2026

── DIRECTIONAL BIAS ─────────────────────────────
Call: NO CALL
Confidence: 6/10
Signal: NO DIRECTIONAL CALL THIS WEEK
MAD Index: 62 (DIVERGENCE)

── MARKET CONTEXT ───────────────────────────────
State: CONSOLIDATING NEAR RESISTANCE
Regime: GEOPOLITICAL PREMIUM CONSOLIDATION WITHIN BROADER STRUCTURAL OVERSUPPLY ENVIRONMENT
Sentiment: FEAR TRANSITIONING TO CAUTIOUS ACCEPTANCE

── WHAT THE MARKET SEES ─────────────────────────
Tactically bullish short-term on geopolitical disruption sustaining but increasingly acknowledging Goldman Sachs Q4 forecast $71 Brent implies significant downside from current $98 WTI as structural oversupply fundamentals expected to reassert once Hormuz normalizes

── WHAT THE MARKET IS MISSING ───────────────────
Market may be overextended on geopolitical premium at $98 WTI with extreme speculative positioning (351,032 net-long highest since 2020) creating asymmetric downside as producers aggressively hedge at $100+ signaling bearish forward view; consensus focused on supply disruption duration while underweighting U.S. policy response (sanctioned Iranian cargo releases plus SPR) and IEA demand downgrade of 210 kb/d creating mean reversion setup toward $70-75 range as historical pattern shows geopolitical premiums fade within 3-4 weeks maximum

── KEY DRIVERS ──────────────────────────────────
1. Geopolitical premium consolidation as Iran-U.S. Strait of Hormuz disruption enters week four with WTI consolidating $94-98 range below psychological $100 resistance, suggesting market adapting to sustained conflict as baseline rather than escalating war premium
2. Structural oversupply fundamentals reasserting dominance with EIA projecting 1.9 mb/d global inventory builds 2026 once Hormuz normalizes, IEA cutting demand growth 210 kb/d to 640 kb/d, and OPEC+ March 1 modest 206k bpd production increase signaling cartel confidence in offsetting disruptions
3. Extreme speculative positioning at 351,032 net-long contracts (highest since 2020) creating asymmetric downside risk as producers aggressively hedge at $100+ levels signaling commercial forward bearish view contradicting crowd bullish extremes

── KEY ZONES ────────────────────────────────────
Resistance 2: 118.730 – 120.230
Resistance 1: 99.250 – 100.750
Pivot: ~95.000
Support 1: 91.250 – 92.750
Support 2: 84.250 – 85.750

── DISCIPLINE BIASES ────────────────────────────
Technical: BULLISH
Fundamental: BEARISH
Institutional: BEARISH
Options: NO CALL
Economic: BEARISH
Sentiment: BEARISH

── TECHNICAL STRUCTURE ──────────────────────────
WTI consolidating $94-98 range after March 12 spike to $120, rejected sharply at $100 psychological resistance March 20 with bearish symmetrical triangle breakdown pattern forming; trading 18% below 52-week high $119.48 established during initial geopolitical shock

── FUNDAMENTAL ASSESSMENT ───────────────────────
Crude overvalued 15-20% versus fair value $60-70 range; geopolitical premium unsustainable as IEA projects structural 1.9 mb/d surplus 2026 with demand revised down 210 kb/d offsetting temporary Strait of Hormuz supply disruption estimated at 8 mb/d curtailment

── INSTITUTIONAL POSITIONING ────────────────────
Extreme net-long positioning at 351,032 contracts (most bullish since 2020) creating contrarian bearish setup as producer hedging surge at $100+ signals commercial smart-money bearish forward view; U.S. releasing sanctioned Iranian cargoes and SPR to counter disruption

── OPTIONS FLOW ─────────────────────────────────
IV elevated but insufficient data quality for directional signal; OVX likely above normal range reflecting sustained geopolitical uncertainty but options market showing neutral put/call positioning rather than directional conviction

── ECONOMIC BACKDROP ────────────────────────────
MACRO REGIME: TRANSITIONAL - VIX at 26.78 (elevated above 25 threshold indicating risk-off conditions); Fed on hold at 3.5-3.75% with 1-cut forecast 2026; ISM Manufacturing 52.6 shows expansion but China GDP 4.5% reflects persistent demand weakness dampening global oil consumption outlook

── VOLATILITY REGIME ────────────────────────────
Regime: EXTREME
Percentile: 90th
Trend: Expanding ▲
Days in Regime: 10
Term Structure: steep normal contango - 5-day vol at 58% significantly above 20-day 46% and 60-day 34% reflecting acute geopolitical shock from ongoing Iran war and Strait of Hormuz closure with largest oil supply disruption in history per IEA
Historical Pattern: Current volatility expansion from compressed January-February consolidation to extreme 90th percentile mirrors major geopolitical supply shock patterns; when vol spikes from sub-35% to 55%+ range on Middle East conflict, prices typically see 20-30% directional move over following 4-6 weeks in 75% of cases before mean reversion begins—current move achieved 80% rally $55 to $120 suggesting exhaustion phase approaching
Outlook: Extreme volatility expansion from 34% baseline to 58% current suggests directional resolution within 10-20 days; elevated vol regime now day 10 historically lasts 15-30 days during sustained geopolitical trending moves before either stabilizing at new plateau or reverting as catalyst fades; current consolidation pattern suggests coiling energy for breakout
Trading Context: Extreme and rapidly expanding vol requires very wide stops and defensive positioning; expect 5-8% daily ranges versus normal 2-3% as Iran war aftermath continues with Strait of Hormuz closure risk persisting into week four; intraday volatility creating severe whipsaw risk but consolidation below $100 resistance with distribution characteristics suggests mean reversion setup favoring downside resolution
Vol Risk/Opportunity: Volatility spiking from 34% to 58% after geopolitical shock suggests 20-30% move potential largely realized in $67 to $120 rally; downside scenario on geopolitical premium fade and structural oversupply reassertion targets $70-75 range (25% decline from current) as extreme positioning unwinds and U.S. policy response adds supply; upside scenario on sustained Iran escalation targets $110-120 range (15% upside) but extreme positioning and producer hedging create asymmetric risk favoring downside mean reversion

── PRIMARY RISK ─────────────────────────────────
Iran-U.S. conflict escalates beyond current containment with sustained Strait of Hormuz closure disrupting 1-2+ mb/d flows for extended period, forcing Goldman Sachs bull-case $150/bbl scenario to materialize and invalidating structural oversupply mean reversion thesis
Probability: LOW

── PRIMARY OPPORTUNITY ──────────────────────────
Geopolitical premium fade accelerates within 2-3 weeks as historical pattern shows markets dismiss Middle East risks once initial shock absorbed, triggering mean reversion toward $70-75 range as extreme positioning unwinds, producer hedging validates commercial bearish view, and structural oversupply fundamentals overwhelm temporary supply disruption narrative
Timeframe: 2-4 weeks through late March into early April as conflict extends beyond month timeline typical for geopolitical premium persistence

── NEXT CATALYST ────────────────────────────────
Date: March 26, 2026
Event: EIA Weekly Petroleum Status Report following four-week geopolitical rally assessment and inventory trend validation of OPEC+ production discipline versus Hormuz disruption impact
Expected Impact: HIGH

═════════════════════════════════════════════════
Source: Macro Agent Desk (macroagentdesk.com)
═════════════════════════════════════════════════

── FULL ANALYSIS ────────────────────────────────
WTI crude oil stands at a critical inflection point on March 22, 2026, trading at $98.23 after consolidating in a tight $94-98 range following the historic March rally from $67 to $120 spike—the largest weekly gain in 43-year futures history triggered by the U.S.-Israel Iran conflict and Strait of Hormuz effective closure beginning February 28. MACRO REGIME: TRANSITIONAL with elevated volatility signals—VIX at 26.78 (above 25 fear threshold) indicating risk-off conditions, though below panic levels, with geopolitical tensions creating episodic uncertainty rather than sustained flight-to-safety across asset classes. Post-input development identified: Multiple March 19-21 sources confirm Iraq declared force majeure, Kuwait refineries attacked, and oil topped $112 briefly before U.S. announced plans to release sanctioned Iranian crude cargoes and Strategic Petroleum Reserve volumes to counter disruption, triggering pullback to current $98 levels. The New York Times March 21 reports the Strait closure has revealed Hormuz as one of world's great bottlenecks with 3,200 ships and 20,000 crew stuck. Congress.gov confirms Iranian forces declared Strait closed starting March 4 with ongoing attacks on transit attempts. The geopolitical catalyst now enters its fourth week—significantly longer than typical 7-14 day Middle East risk premium fade patterns, yet price action suggests market is adapting to conflict as baseline rather than pricing escalation scenarios. Three powerful crosscurrents define current structure: First, the geopolitical disruption is proving more durable than historical precedent but showing exhaustion signals. The Strait of Hormuz closure represents genuine supply shock with IEA confirming 8 mb/d curtailed (largest in oil market history per March 12 report), yet WTI has pulled back 20% from $120 peak to current $98 consolidation, unable to reclaim psychological $100 resistance despite ongoing conflict. Goldman Sachs raised Q4 2026 Brent/WTI forecasts to $71/$67 from $66/$62 on March 12 acknowledging longer disruption expectations, but this still implies significant downside from current levels—validating view that geopolitical premium is overextended relative to medium-term fundamentals. CNBC reports U.S. Treasury Secretary Bessent and Energy Secretary Wright announcing removal of oil sanctions on stranded Iranian cargoes plus SPR releases over coming months to flood market with supply, directly targeting the geopolitical premium. Second, structural fundamental bearishness is intensifying beneath geopolitical noise. The March 2026 IEA report projects global inventories building 1.9 mb/d throughout 2026 once Hormuz normalizes and revised demand growth DOWN by 210 kb/d to just 640 kb/d, citing higher oil prices and precarious economic outlook. This demand revision offsets China's 15.8% crude import surge Jan-Feb, indicating net fundamental balance remains oversupplied. EIA data shows U.S. inventories at 424.4 million barrels (4% below five-year average) providing tactical tightness but insufficient to justify sustained triple-digit pricing given forward surplus projections. OPEC+'s March 1 decision to increase production by modest 206,000 bpd for April (versus 548,000 bpd maximum debated) signals cartel assessment that current disruptions are manageable and structural oversupply remains medium-term dominant theme. Third, positioning dynamics create asymmetric downside risk via extreme crowding. Managed money net-long surged to 351,032 contracts (week ending March 10)—the most bullish positioning since 2020 representing historical peak speculative length. Simultaneously, producer hedging spiked with nearly 25% of AEGIS clients actively locking in forward sales at $100+ levels, signaling commercial players' bearish forward view that current prices are unsustainable selling opportunities. This creates classic pain trade setup: maximum speculative longs at price peaks while smart money (producers) aggressively sells forward. Technical structure confirms distribution phase with March 20 FXDailyReport noting WTI flashing bearish signals after breaking down from symmetrical triangle formation, testing immediate support at $92. The 52-week high of $119.48 established during initial spike remains overhead resistance, but critically the $94-100 consolidation range over past two weeks suggests market digesting gains and pricing equilibrium rather than breakthrough conviction. My bias tracker shows continuation of BEARISH stance from last week (March 15 signal -1.0 conviction 6 CORRECT as price fell -0.63%), following four consecutive CORRECT calls demonstrating thesis validation. The asset-specific context for CL warns crude mean-reverts at extremes: $90+ means demand destruction accelerates, and geopolitical events can move 5-10% overnight cutting both ways. At $98, we are well into demand destruction territory where elasticity kicks in. DEVIL'S ADVOCATE: The Iran conflict could genuinely escalate with Iraq force majeure and Kuwait attacks representing expanding theater rather than contained bilateral confrontation, forcing sustained Hormuz closure and validating Qatar's $150/bbl scenario; Goldman's revised Q4 forecast to $71 acknowledges longer disruption risk than previously modeled; U.S. SPR releases may prove insufficient to offset 8 mb/d curtailment if conflict extends beyond Q2. However, weight of evidence favors mean reversion: (1) OPEC+ production increase signals cartel confidence in offsetting disruptions, (2) IEA demand downgrade creates net bearish fundamental picture, (3) extreme positioning at historical peaks creates liquidation vulnerability, (4) technical rejection at $100 resistance with distribution characteristics, (5) U.S. policy response releasing Iranian cargoes plus SPR directly targeting geopolitical premium, and (6) Goldman forecast of $71 Q4 implies 28% decline from current levels even with extended disruption assumptions embedded. Reducing signal from -1.0 to -1.5 and holding conviction at 6 reflects: (1) geopolitical catalyst now week four creating extended risk premium versus typical 2-week fade, (2) U.S. policy response materially shifts supply dynamics, (3) positioning extremes intensify asymmetric downside, (4) technical breakdown from triangle pattern, yet (5) ongoing conflict prevents maximum conviction and (6) transitional macro regime penalty per Rule 3 applies.