Crude Oil (CL) — Market underestimates OPEC+ commitment to defend sub-$60 prices combined with…
Cautiously bearish expecting structural oversupply and weak Chinese demand to push prices toward $55-58 range over 2026 despite OPEC+ Q1 production freeze providing temporary support

Cautiously bearish expecting structural oversupply and weak Chinese demand to push prices toward $55-58 range over 2026 despite OPEC+ Q1 production freeze providing temporary support
OPEC+ January 4 Q1 2026 production freeze (zero increases Jan-Mar) creating fragile floor against relentless structural oversupply with IEA projecting 3.8-4.0 mb/d global surplus
Chinese oil demand structurally peaked at 15.4-16 mb/d in 2025 with accelerating EV adoption displacing 1.3 mb/d in 2024 alone and expected to destroy 5 mb/d globally by 2030
February seasonal strength pattern historically positive continuing January recovery from December 52-week low of $54.98 with historical data showing modest positive returns
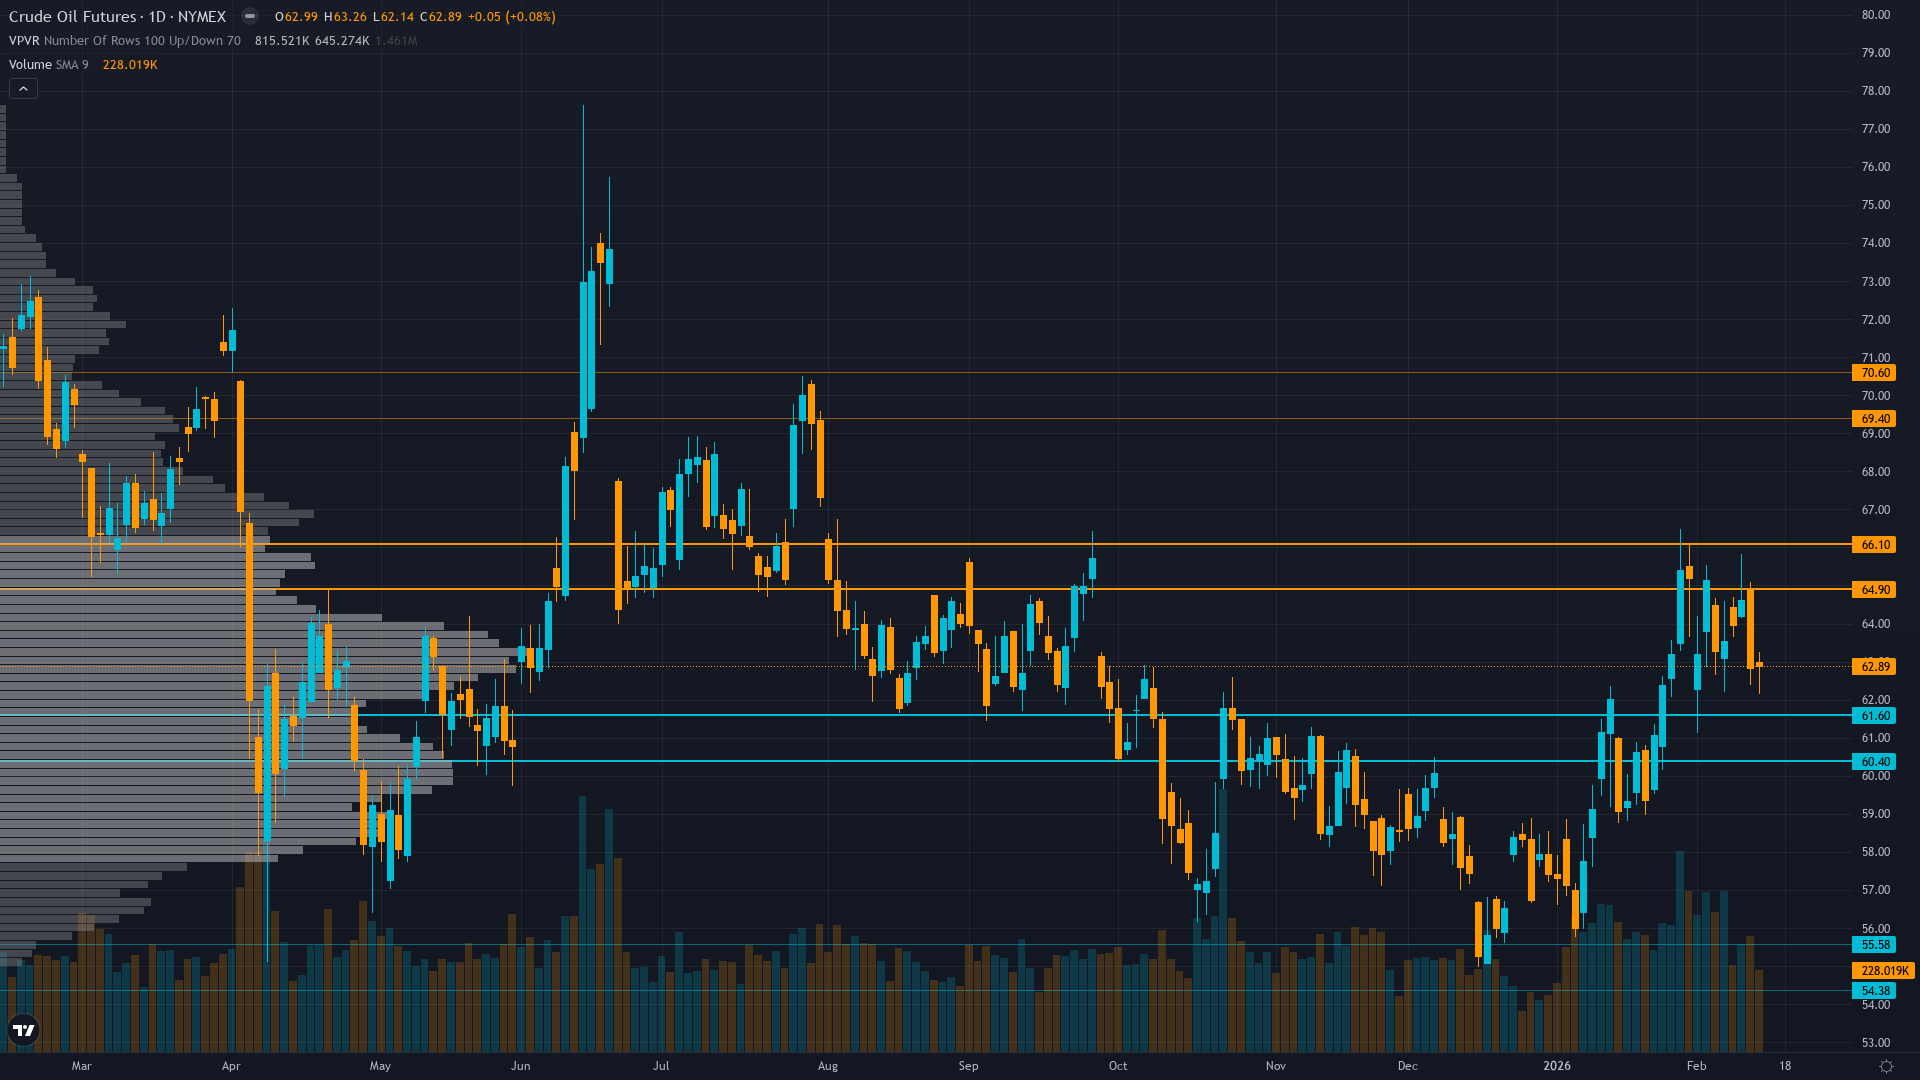
| ▲ Resistance Zone 2 | 69.250 – 70.750 |
| ▲ Resistance Zone 1 | 64.750 – 66.250 |
| ─ Pivot Area | ~63.500 |
| ▼ Support Zone 1 | 60.250 – 61.750 |
| ▼ Support Zone 2 | 54.230 – 55.730 |
Trading 15.6% above December 52-week low of $54.98 in consolidation after recovering from year-end capitulation, testing $65.50 resistance zone
Structural oversupply dominates with IEA projecting 3.8-4.0 mb/d surplus 2026, Chinese demand peaked, US production near record 13.6 mb/d, but OPEC+ Q1 freeze providing temporary relief
Defensive net short bias moderating after January recovery from 52-week lows but no fundamental conviction shift given persistent structural headwinds
OVX volatility index at elevated 42-53 range in 52-week context of 23.59-74.41 reflecting uncertainty about OPEC+ credibility versus oversupply reality
Weak global growth particularly China dampening energy demand, EIA forecasts Brent averaging $55-56/bbl in 2026, Fed easing cycle providing modest commodity support insufficient to offset structural headwinds
Normal with near-term elevation - 5-day vol at 32% modestly above 20-day 30.5% reflecting post-recovery uncertainty from December lows and OPEC+ credibility questions
Current elevated volatility following year-end capitulation to 52-week lows while remaining below 60th percentile is constructive; historically when vol stabilizes in 55-60th percentile range after extreme declines, markets either coil for 8-12% breakout moves within 2-4 weeks or grind in consolidation
Volatility normalizing at 58th percentile after Q4 2025 extremes where August reached 72nd percentile; current modest elevation suggests balanced risk environment with potential for expansion on catalyst resolution within 2-3 weeks around inventory trends or geopolitical developments
Elevated vol environment suggests wider stops appropriate; expect 3-5% daily ranges currently with potential expansion to 6-8% if seasonal reversal accelerates or breakdown below $61 triggers cascade; current vol expansion from December compression indicates directional resolution approaching
Volatility at 30.5% 20-day average after touching extremes in Q4 2025 suggests coiling energy for breakout from current $61-$65.50 consolidation range; historical precedent when vol stabilizes in mid-range after 20%+ annual declines shows subsequent 10-15% directional moves within 3-4 weeks, targeting either $54-56 downside on OPEC+ freeze failure or $70-73 upside on seasonal strength, production discipline validation, and short squeeze from extreme 2025 positioning
|
⚠️ Primary Risk
Breakdown below $61 support triggering retest of December $54.98 lows as structural oversupply narrative and inventory builds overwhelm OPEC+ freeze rhetoric heading into massive projected 2026 surplus Probability: MEDIUM
|
✦ Primary Opportunity
January-February seasonal strength pattern combined with extreme 2025 positioning (-22% YoY worst in 5 years) and OPEC+ production discipline creating short squeeze toward $68-70 resistance if inventory data validates effectiveness Timeframe: 2-4 weeks through late February into March seasonal window
|
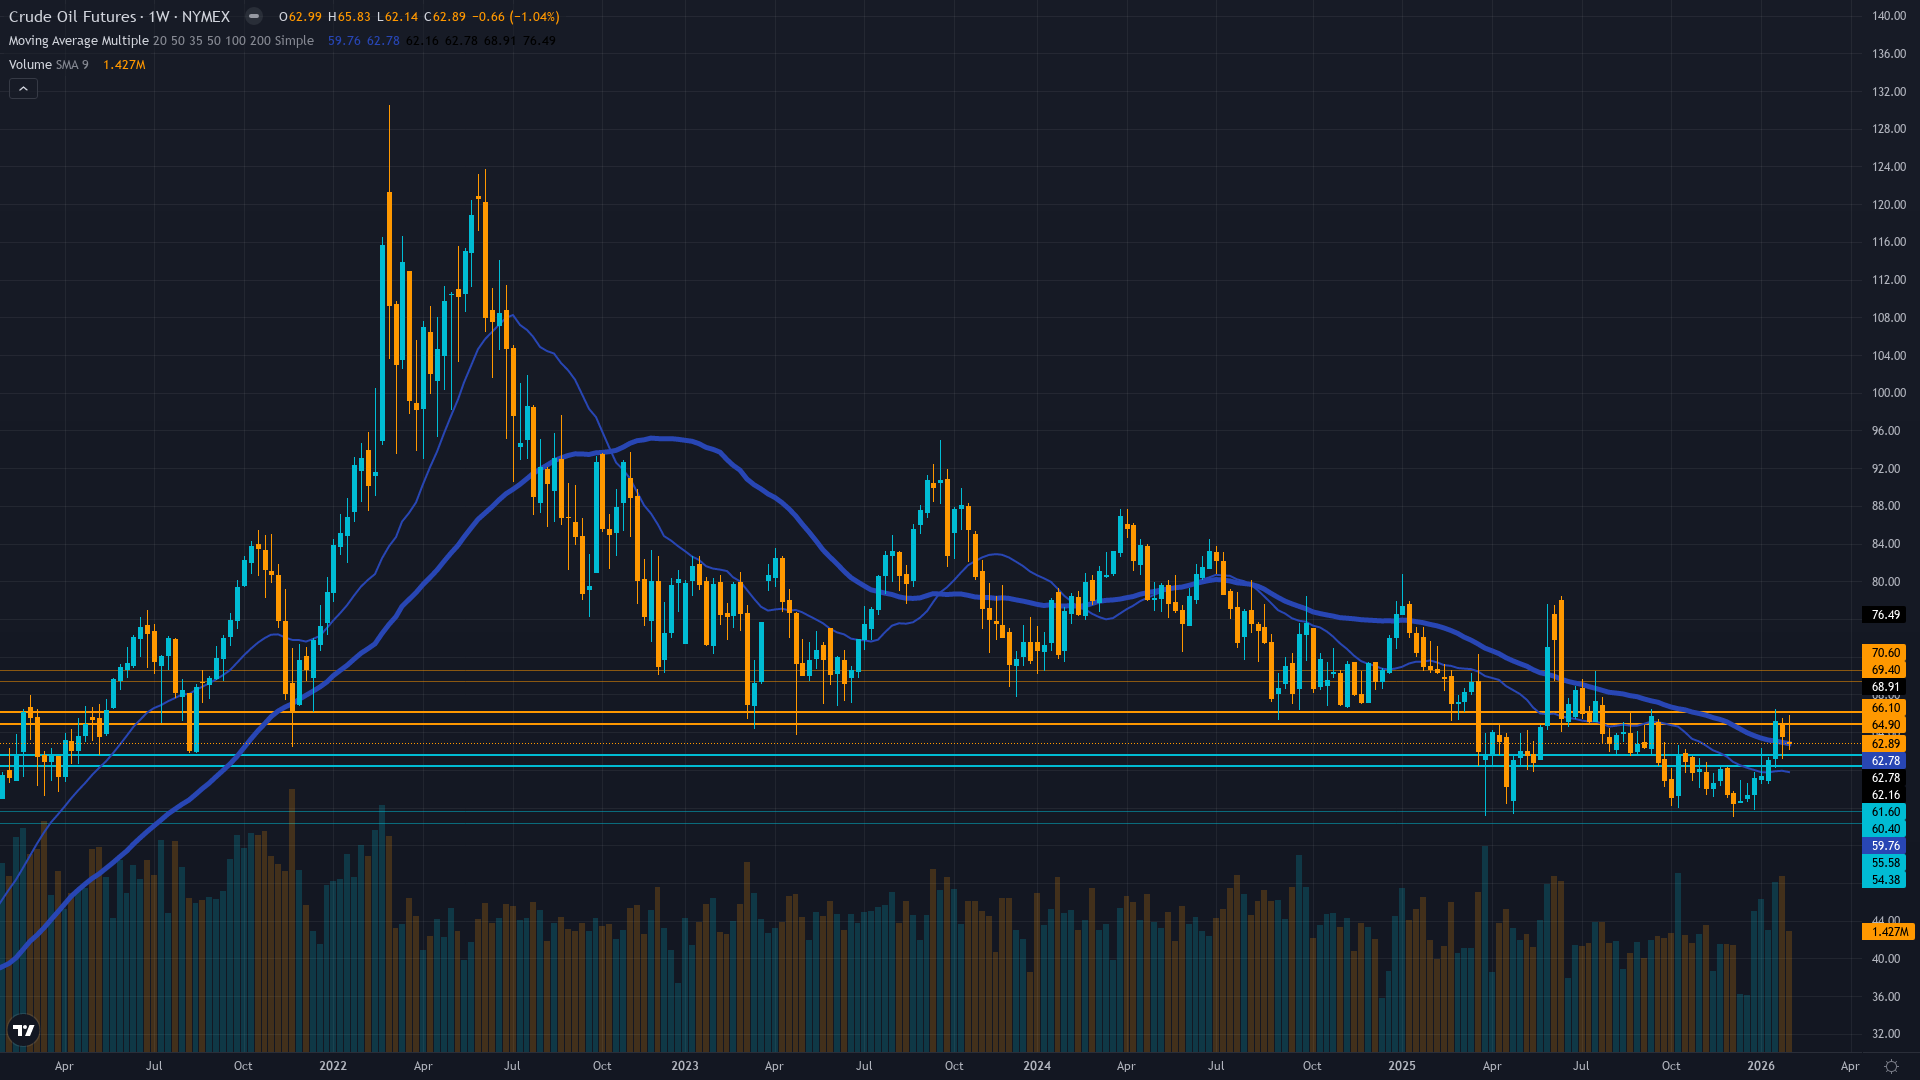
WTI crude oil stands at a critical inflection point on February 15, 2026, trading at $63.55 after recovering 15.6% from the December 52-week low of $54.98 that marked the nadir of 2025's brutal 22% annual decline—the worst performance in five years. The market faces a fundamental tug-of-war between seasonal tailwinds and structural headwinds that will determine the path forward. On the constructive side, crude has benefited from historical January-February seasonal strength patterns showing +39.26% annualized returns from late December through August over 20 years.
OPEC+'s January 4 reaffirmation of their November 3 production freeze—maintaining ZERO increases for Q1 2026 (January-March)—has provided critical support, preventing the feared cascade below $55 that dominated December sentiment. However, formidable structural forces persist: the IEA projects massive global supply surpluses of 3.8-4.0 million bpd in 2026, driven by three converging forces. First, Chinese oil demand has structurally peaked at 15.4-16 million bpd with major state refiners confirming the consumption turning point as EV adoption accelerates—displacing 1.3 mb/d in 2024 alone and expected to destroy 5 mb/d globally by 2030, with China accounting for half that impact.
Second, US production approaches record 13.6 million bpd with Brazil, Guyana and non-OPEC supply rising. Third, OPEC+ credibility remains questioned after consistent underdelivery on announced production targets throughout 2025. The EIA forecasts Brent averaging just $55-56/bbl in 2026, reflecting persistent oversupply expectations. The volatility structure reveals market ambivalence with the OVX crude oil volatility index elevated at 42-53 range within a 52-week range of 23.59-74.41, suggesting neither extreme panic nor breakthrough conviction.
Technical structure shows WTI consolidating in a critical $61-$65.50 range, having rejected December lows but unable to reclaim the $70 psychological level. Current valuation at approximately 37th percentile of 52-week range suggests partial recovery from extreme oversold but significant overhead resistance. The binary setup facing crude through February-March: either seasonal strength continues combining with OPEC+ discipline validation and extreme positioning unwind to drive tactical rally toward $68-70, or structural oversupply narrative reasserts dominance with inventory builds signaling freeze ineffectiveness, triggering retest of $54.98 lows.
My bias tracker shows MISSED call last week (BEARISH at -1.5 signal while price rose 1.35%), creating mandatory conviction reduction and heightened vigilance for continued contrary price action. This represents my second consecutive miss on CL after correct BEARISH call week of Feb 1. The devil's advocate case: seasonal patterns may prove more powerful than anticipated given extreme positioning exhaustion from 2025's worst annual performance, while OPEC+ pain threshold at sub-$60 prices could trigger more aggressive defense than market expects.
| Week | Bias | Confidence | Result |
|---|---|---|---|
| February 8, 2026 | BEARISH | 7/10 | ❌ |
| February 1, 2026 | BEARISH | 8/10 | ✅ |
| January 25, 2026 | BEARISH | 8/10 | ❌ |
| January 11, 2026 | BEARISH | 8/10 | ❌ |
| January 4, 2026 | BEARISH | 9/10 | ❌ |
| December 28, 2025 | BEARISH | 9/10 | ❌ |
| December 21, 2025 | BEARISH | 9/10 | ❌ |
| December 14, 2025 | BEARISH | 9/10 | ✅ |
| December 7, 2025 | NO CALL | 8/10 | ➖ |
| November 30, 2025 | BEARISH | 8/10 | ❌ |
| November 23, 2025 | BEARISH | 8/10 | ❌ |


