Crude Oil (CL) — January seasonal strength and geopolitical tensions providing fragile support…
Cautiously bearish expecting structural oversupply and weak Chinese demand to push prices toward $55-58 range over 2026 despite OPEC+ Q1 production freeze providing temporary support

Cautiously bearish expecting structural oversupply and weak Chinese demand to push prices toward $55-58 range over 2026 despite OPEC+ Q1 production freeze providing temporary support
January seasonal strength and geopolitical tensions providing fragile support against structural oversupply headwinds with IEA projecting 3.8-4.0 mb/d global surplus in 2026
OPEC+ January 4 reaffirmation of Q1 2026 production freeze (zero increases Jan-Mar) creating temporary floor but market skeptical of compliance and sustainability
Chinese oil demand structurally peaked at 15.4-16 mb/d in 2025 with accelerating EV adoption expected to destroy 5 mb/d globally by 2030, fundamentally altering demand trajectory
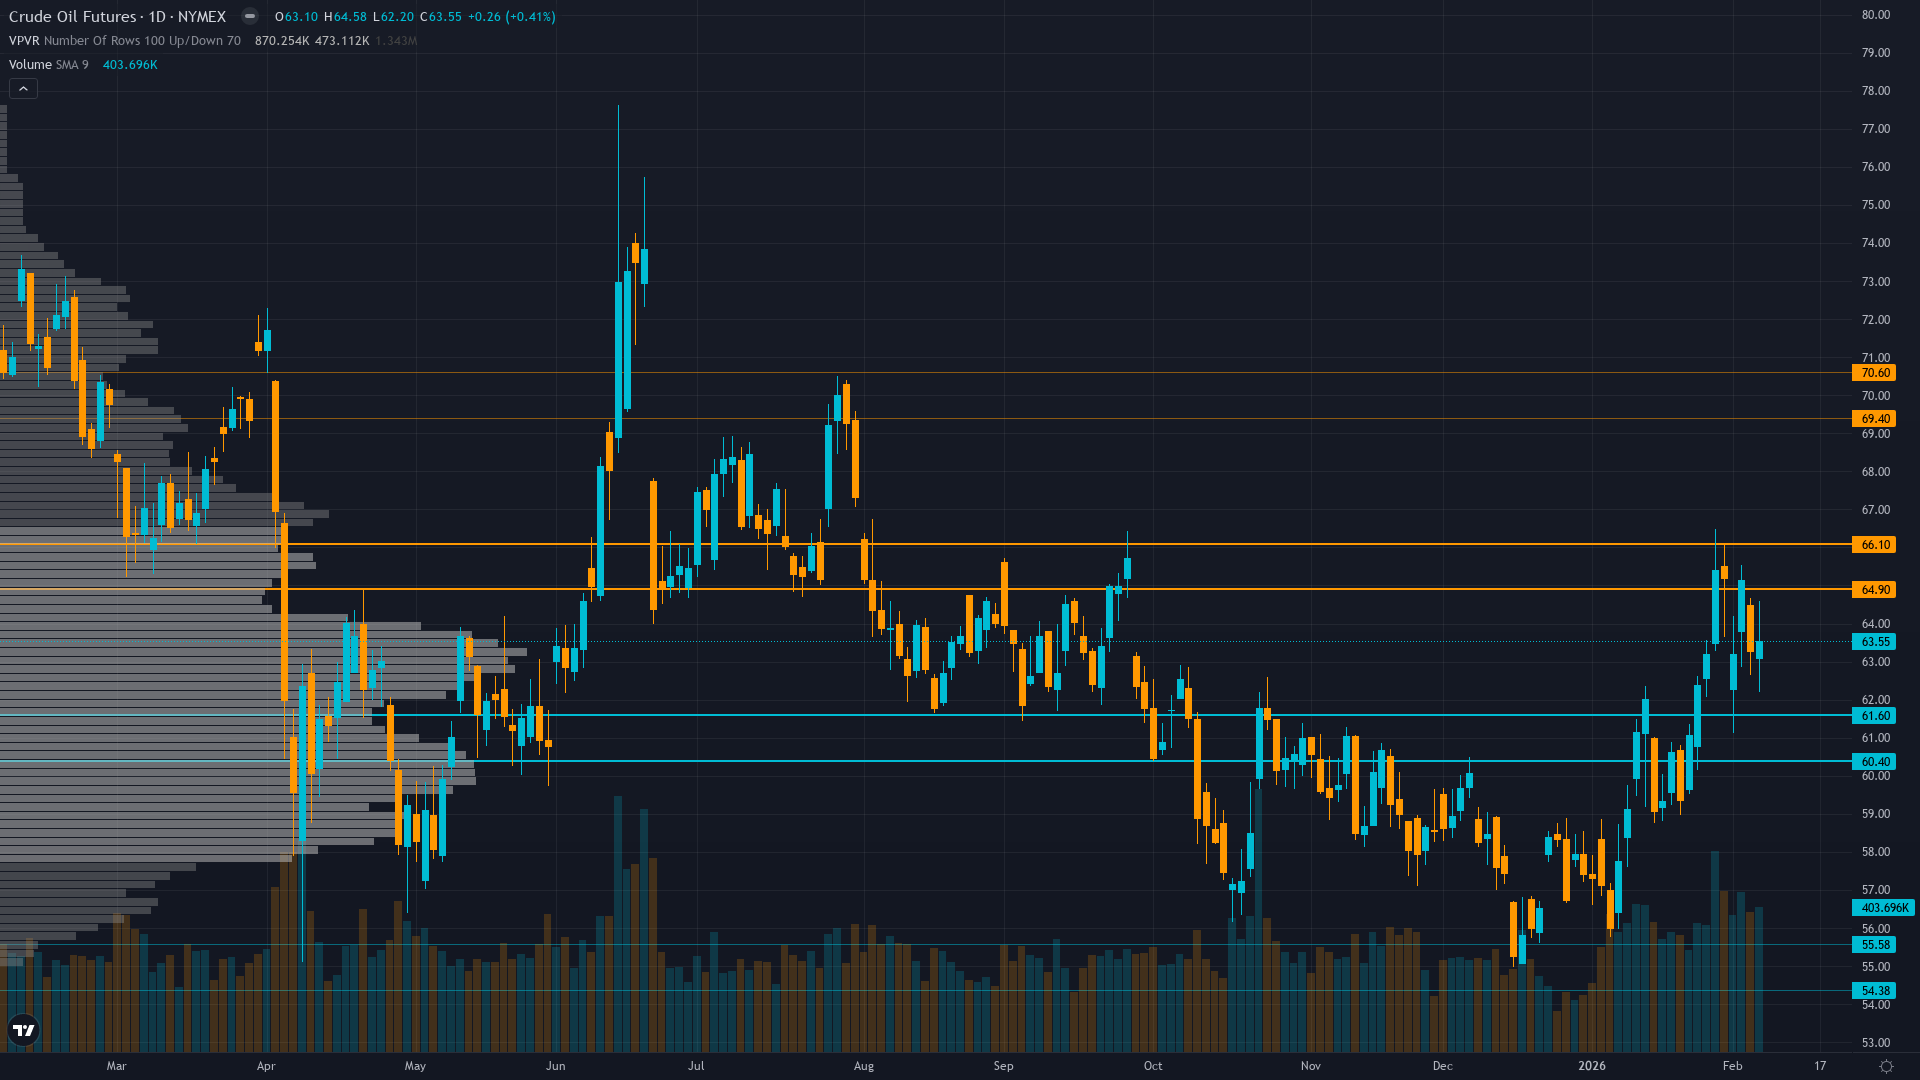
| ▲ Resistance Zone 2 | 69.250 – 70.750 |
| ▲ Resistance Zone 1 | 64.750 – 66.250 |
| ─ Pivot Area | ~63.500 |
| ▼ Support Zone 1 | 60.250 – 61.750 |
| ▼ Support Zone 2 | 54.230 – 55.730 |
Trading 15.6% above December 52-week low of $54.98, in consolidation after recovering from year-end capitulation, testing $65.50 resistance zone
Structural oversupply dominates with IEA projecting 3.8-4.0 mb/d surplus 2026, Chinese demand peaked, US production near record 13.6 mb/d, but OPEC+ Q1 freeze providing temporary relief
Defensive net short bias moderating after January recovery from 52-week lows, but no fundamental conviction shift given structural headwinds
OVX volatility index at elevated 42-53 range in 52-week context of 23.59-74.41, reflecting uncertainty about OPEC+ credibility versus oversupply reality
Weak global growth particularly China dampening energy demand, EIA forecasts Brent averaging $55-56/bbl in 2026, Fed easing cycle providing modest commodity support insufficient to offset structural headwinds
Normal with near-term elevation - 5-day vol at 32% modestly above 20-day 30.5% reflecting post-recovery uncertainty from December lows and OPEC+ credibility questions
Current elevated volatility following year-end capitulation to 52-week lows while remaining below 60th percentile is constructive; historically when vol stabilizes in 55-60th percentile range after extreme declines, markets either coil for 8-12% breakout moves within 2-4 weeks or grind in consolidation
Volatility normalizing at 58th percentile after Q4 2025 extremes where August reached 72nd percentile; current modest elevation suggests balanced risk environment with potential for expansion on catalyst resolution within 2-3 weeks around inventory trends or geopolitical developments
Elevated vol environment suggests wider stops appropriate; expect 3-5% daily ranges currently with potential expansion to 6-8% if seasonal reversal accelerates or breakdown below $61 triggers cascade; current vol expansion from December compression indicates directional resolution approaching
Volatility at 30.5% 20-day average after touching extremes in Q4 2025 suggests coiling energy for breakout from current $61-$65.50 consolidation range; historical precedent when vol stabilizes in mid-range after 20%+ annual declines shows subsequent 10-15% directional moves within 3-4 weeks, targeting either $54-56 downside on OPEC+ freeze failure or $70-73 upside on seasonal strength, production discipline validation, and short squeeze from extreme 2025 positioning
|
⚠️ Primary Risk
Breakdown below $61 support triggering retest of December $54.98 lows as structural oversupply narrative and inventory builds overwhelm OPEC+ freeze rhetoric heading into massive projected 2026 surplus Probability: MEDIUM
|
✦ Primary Opportunity
January-February seasonal strength pattern combined with extreme 2025 positioning (-22% YoY) and OPEC+ production discipline creating short squeeze toward $68-70 resistance if inventory data validates effectiveness Timeframe: 2-4 weeks through late February into March seasonal window
|
WTI crude oil stands at a critical inflection point on February 8, 2026, trading at $63.55 after recovering 15.6% from the December 52-week low of $54.98 that marked the nadir of 2025's brutal 22% annual decline—the worst performance in five years. The market faces a fundamental tug-of-war between seasonal tailwinds and structural headwinds. On the positive side, crude has benefited from historical January-February seasonal strength patterns that show +39.26% annualized returns from late December through August over the past 20 years.
OPEC+'s January 4 reaffirmation of their November 3 production freeze—maintaining ZERO increases for Q1 2026 (January-March)—has provided critical support, preventing the feared cascade below $55 that dominated December sentiment. Early January geopolitical tensions including renewed US-Iran confrontation and Trump's Venezuela oil blockade executive order briefly spiked prices, demonstrating latent upside sensitivity despite year-long dismissal of risk premiums. However, formidable structural headwinds persist.
The IEA projects massive global supply surpluses of 3.8-4.0 million bpd in 2026, driven by three converging forces: (1) Chinese oil demand has structurally peaked at 15.4-16 million bpd, with major state refiners confirming consumption turning points as EV adoption accelerates—displacing 1.3 mb/d in 2024 alone and expected to destroy 5 mb/d globally by 2030; (2) US production approaches record 13.6 million bpd with Brazil, Guyana and non-OPEC supply rising; (3) OPEC+ credibility remains questioned after consistent underdelivery on announced production targets throughout 2025. The EIA forecasts Brent averaging just $55-56/bbl in 2026, reflecting persistent oversupply expectations.
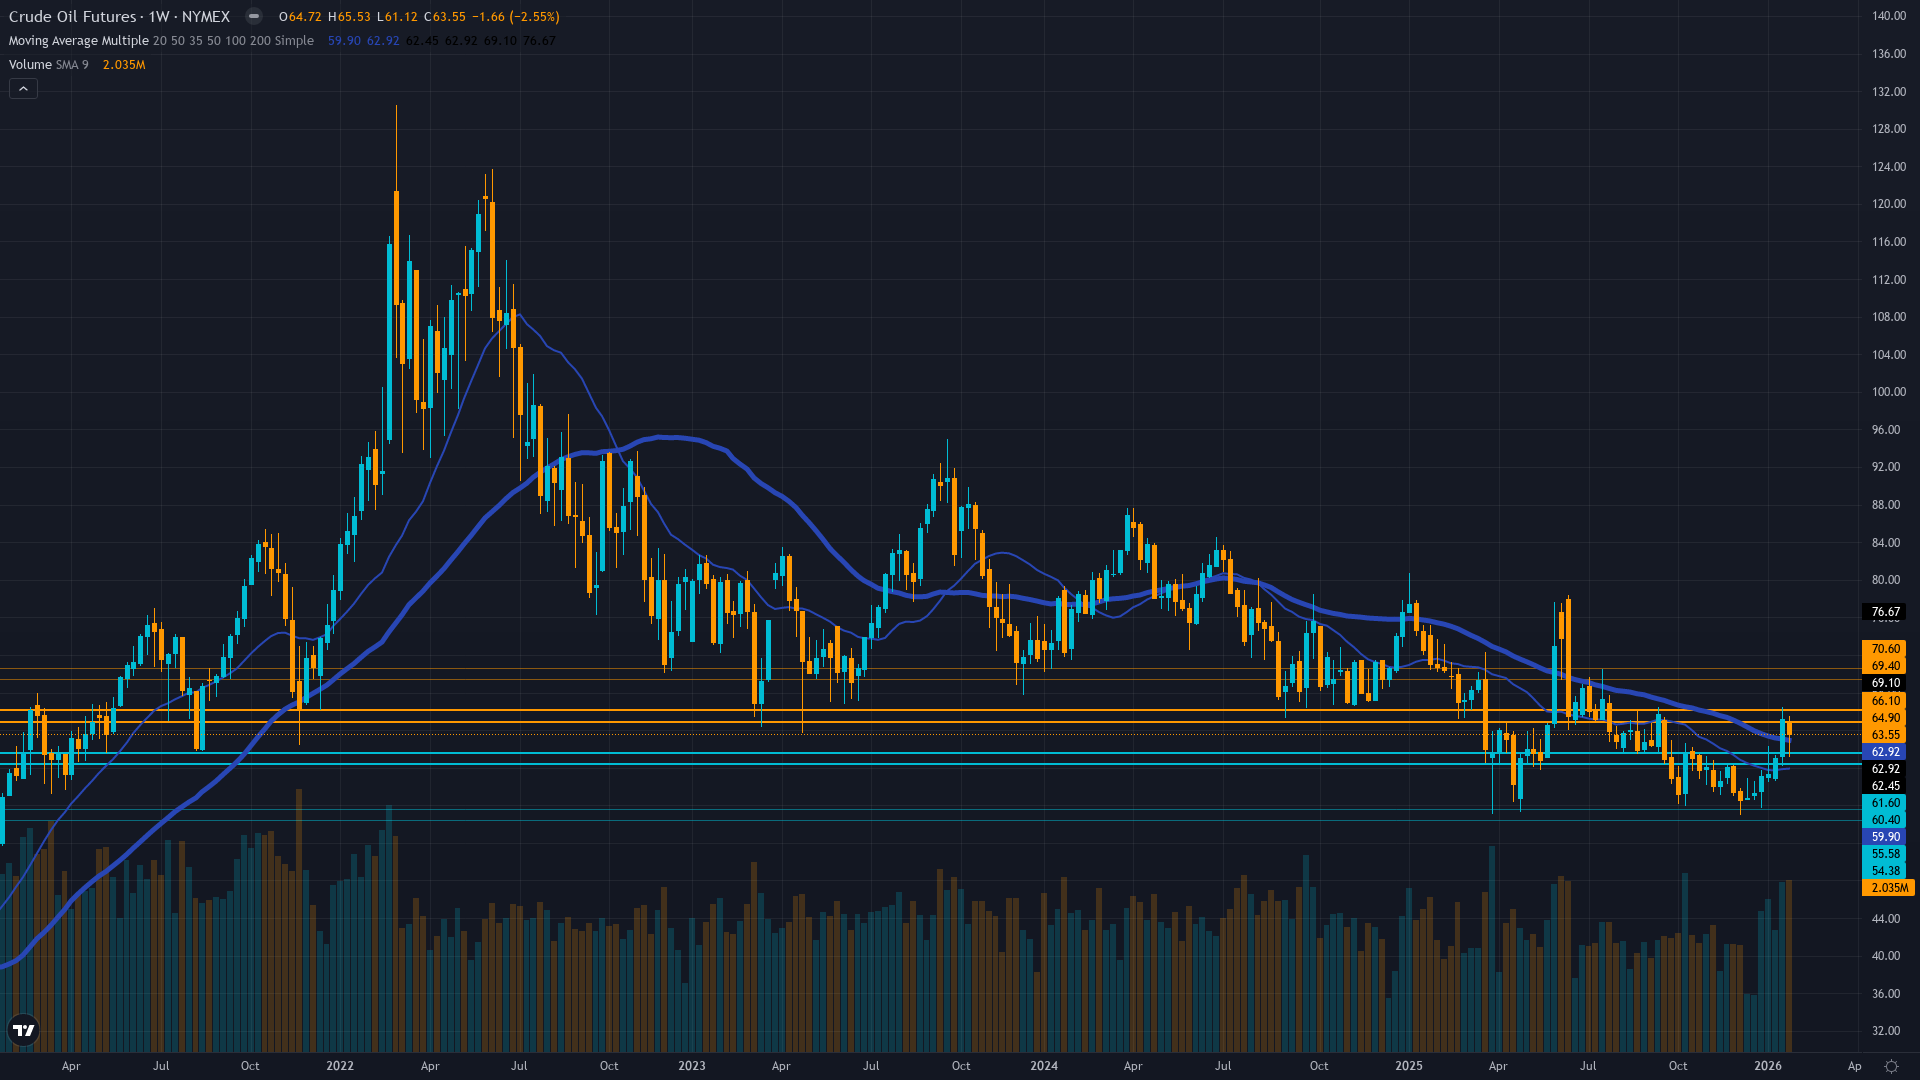
Volatility dynamics reveal market ambivalence with the OVX crude oil volatility index elevated at 42-53 range within a 52-week range of 23.59-74.41, suggesting neither extreme panic nor breakthrough conviction. February seasonality shows historical positive performance averaging +1.6% over 35 years, providing modest continuation of January's recovery. The technical structure shows WTI consolidating in a critical $61-$65.50 range, having rejected December lows but unable to reclaim the $70 psychological level that marked June 2025 highs before the brutal autumn breakdown.
Current valuation places WTI at approximately 37th percentile of its 52-week range, suggesting partial recovery from extreme oversold conditions but significant overhead resistance. The 52-week range of $54.98 to $78.40 represents a massive 30% band, with current price in the lower third reflecting persistent bearish fundamental bias. Institutional positioning shows defensive sentiment moderating from year-end extremes as January seasonal patterns and OPEC+ freeze prevented worst-case scenarios, yet no fundamental conviction shift has occurred given structural demand destruction and supply abundance.
The binary setup facing crude through February-March: either January-February seasonal strength continues combining with OPEC+ production discipline validation and extreme positioning unwind to drive a tactical rally toward $68-70 resistance as deeply positioned bears from 2025's -22% collapse are forced to cover, or the structural oversupply narrative reasserts dominance with inventory builds signaling OPEC+ freeze ineffectiveness, triggering retest of $54.98 December lows as fundamental deterioration and bearish positioning overwhelm temporary seasonal and geopolitical support factors heading into 2026's projected massive 4 mb/d surplus. The consensus view remains cautiously bearish expecting eventual drift toward $55-58 range over coming quarters, yet this creates potential edge: the market may underestimate OPEC+ pain threshold at sub-$60 prices given fiscal breakevens and willingness to defend current levels more aggressively than anticipated, while extreme positioning from 2025's worst annual performance in five years and historical seasonal strength patterns create asymmetric short squeeze potential if February data validates production discipline.
| Week | Bias | Confidence |
|---|---|---|
| February 8, 2026 | BEARISH | 7/10 |
| February 1, 2026 | BEARISH | 8/10 |
| January 25, 2026 | BEARISH | 8/10 |
| January 18, 2026 | BEARISH | 8/10 |
| January 11, 2026 | BEARISH | 8/10 |
| January 4, 2026 | BEARISH | 9/10 |
| December 28, 2025 | BEARISH | 9/10 |
| December 21, 2025 | BEARISH | 9/10 |
| December 14, 2025 | BEARISH | 9/10 |
| December 7, 2025 | NEUTRAL | 8/10 |
| November 30, 2025 | BEARISH | 8/10 |
| November 23, 2025 | BEARISH | 8/10 |


