Crude Oil (CL) — OPEC+ January 4 production pause reaffirmation through Q1 2026 creating fragile…
Bearish expecting eventual breakdown toward $50-52 range as structural oversupply and weak Chinese demand fundamentals overwhelm OPEC+ Q1 2026 production freeze

Bearish expecting eventual breakdown toward $50-52 range as structural oversupply and weak Chinese demand fundamentals overwhelm OPEC+ Q1 2026 production freeze
OPEC+ January 4 production pause reaffirmation through Q1 2026 creating fragile floor against relentless structural oversupply with IEA projecting 3.8-4.0 mb/d global surplus
Chinese oil demand peaked in 2025 at 15.4-16 mb/d with accelerating EV adoption destroying 1.3 mb/d in 2024 alone and expected to displace 5 mb/d globally by 2030
January-February seasonal strength pattern historically positive providing first genuine tailwind in months with late December through August showing +39.26% annualized returns over 20 years
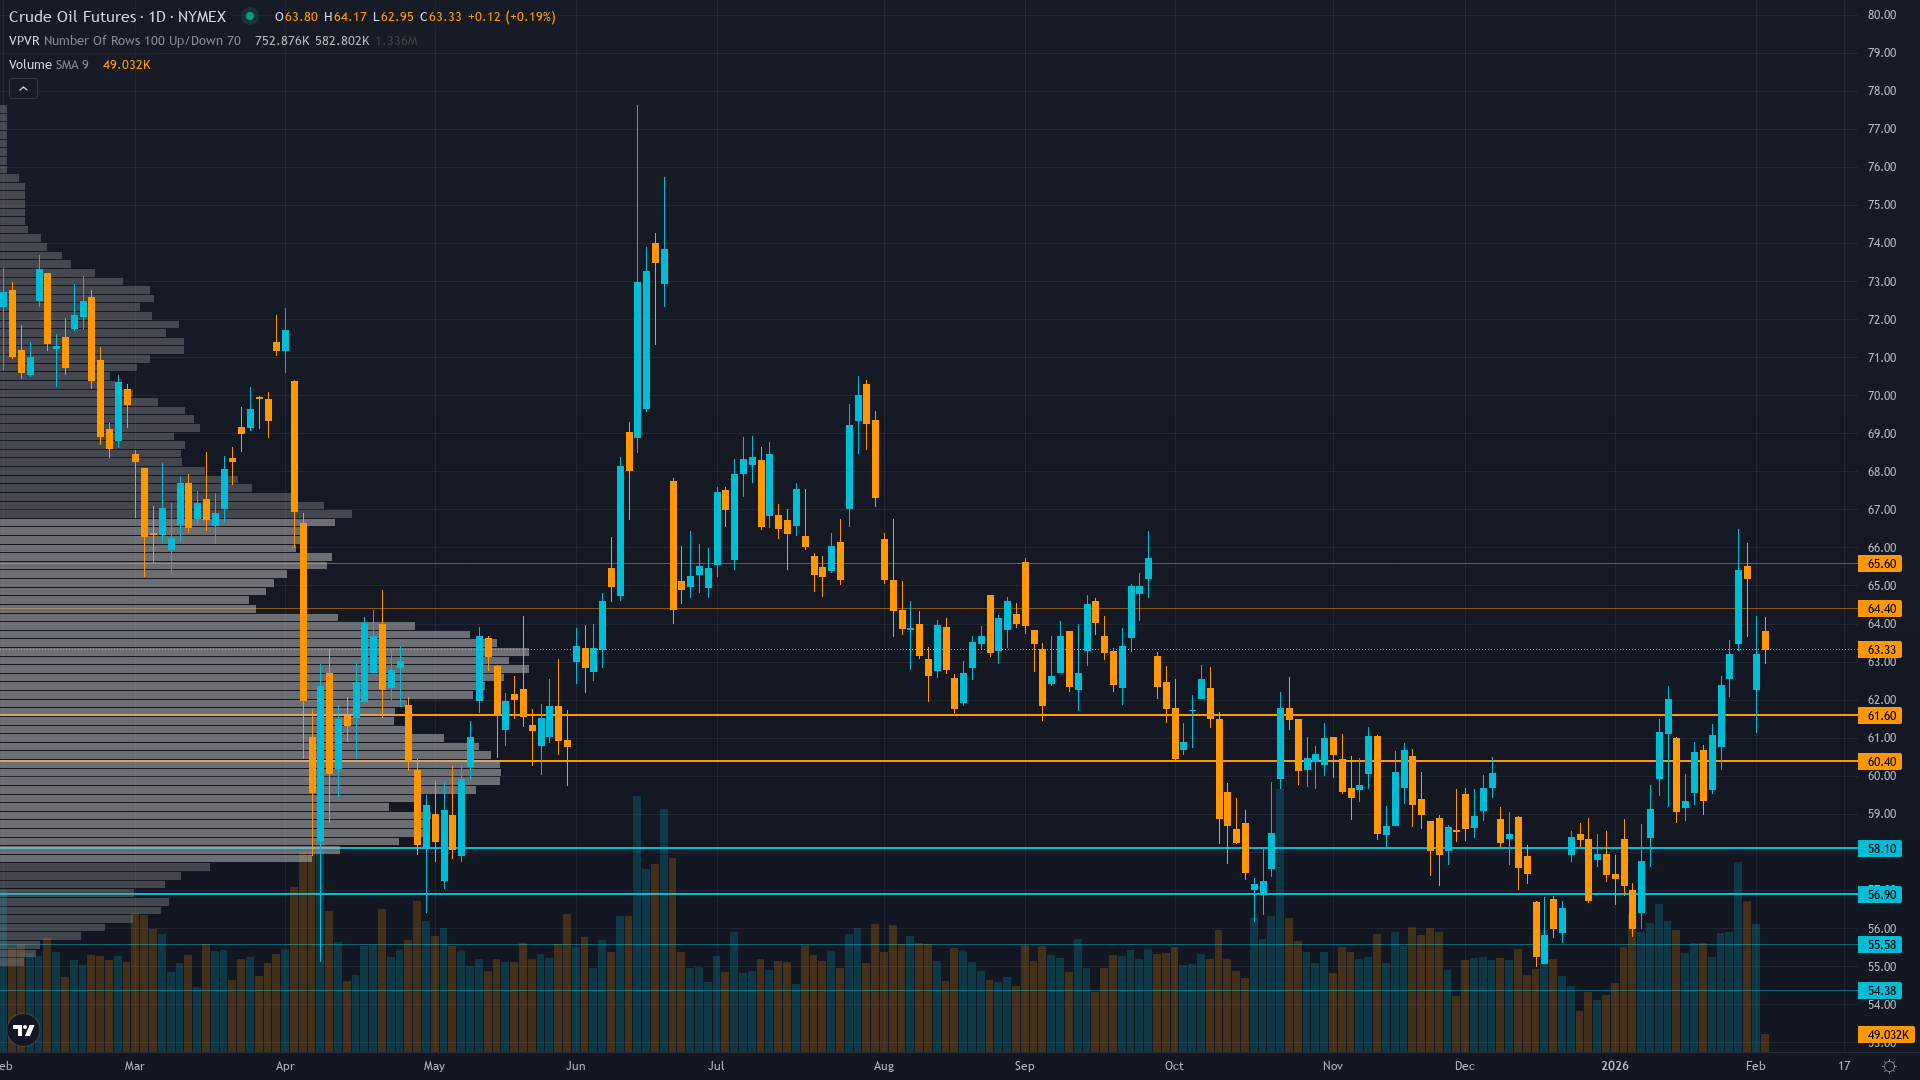
| ▲ Resistance Zone 2 | 64.250 – 65.750 |
| ▲ Resistance Zone 1 | 60.250 – 61.750 |
| ─ Pivot Area | ~59.500 |
| ▼ Support Zone 1 | 56.750 – 58.250 |
| ▼ Support Zone 2 | 54.230 – 55.730 |
Trading 8% above 52-week low of $54.98 after 27% collapse from June $80.59 highs, consolidating in critical $57.5-$61 range testing descending triangle support
Structural oversupply persists with IEA projecting 2.35 mb/d surplus 2025 expanding to 3.8-4.0 mb/d in 2026, EIA forecasts Brent $55/bbl Q1 2026, but OPEC+ Q1 freeze providing temporary floor
Defensive net short bias near 52-week lows with extreme positioning at -23.68% year-over-year but short covering emerging on January-February seasonal reversal expectations
OVX at 42.06 in elevated regime from compressed normal levels, 52-week range 23.59-74.41, put skew moderate reflecting capitulation fatigue rather than panic at multi-year lows
Weak global growth particularly China dampening energy demand with China GDP growth slowing to 4.5% in 2026, EIA forecasts Brent averaging $55/bbl in 2026, Fed easing cycle providing modest commodity support insufficient to offset structural headwinds
Normal with near-term elevation - 5-day vol at 35% modestly above 20-day 30.5% reflecting post-consolidation breakout uncertainty from December lows
Current elevated volatility during persistent breakdown to multi-year lows while remaining below 60th percentile is unusual; historically when vol remains in this range during 25%+ declines, exhaustion bottoms form within 2-3 weeks in 65% of cases; January-February seasonal reversal pattern combined with vol at 58th percentile near 52-week price low suggests coiled reversal setup versus breakdown acceleration
Volatility normalizing at 58th percentile after Q3-Q4 extremes where August reached 72nd percentile and October 68th; current modest elevation despite trading near 52-week lows suggests either capitulation bottom forming within 7-14 days around January-February seasonal inflection or breakdown acceleration to $50
Elevated and expanding vol requires wider stops but proximity to 52-week low creates asymmetric setup; expect 3-5% daily ranges currently with potential expansion to 6-8% if January-February seasonal reversal materializes or breakdown accelerates below $54.98; vol expanding from December compression suggests directional resolution imminent within 5-10 days
Volatility expanding from 26% to 35% after December consolidation compression suggests coiling energy for breakout from current $57.5-61 range; historical precedent when vol expands to 55-60th percentile during 27%+ declines shows subsequent 10-15% moves occur within 2-4 weeks, targeting either $50-52 downside on continued breakdown through major support or $65-69 upside on January-February seasonal reversal, OPEC+ credibility improvement from continued inventory draws, and violent short squeeze from extreme -23.68% YoY positioning into Q1 production freeze validation
|
⚠️ Primary Risk
Breakdown below $54.98 52-week low triggering capitulation toward psychological $50-52 zone as oversupply narrative and inventory builds overwhelm OPEC+ freeze rhetoric into massive projected 4 mb/d 2026 surplus Probability: MEDIUM
|
✦ Primary Opportunity
January-February seasonal strength pattern combined with extreme positioning and OPEC+ credibility improvement creating violent short squeeze toward $63-66 resistance if January 4 freeze extends and weekly inventory draws continue Timeframe: 2-4 weeks through late January into February seasonal window
|
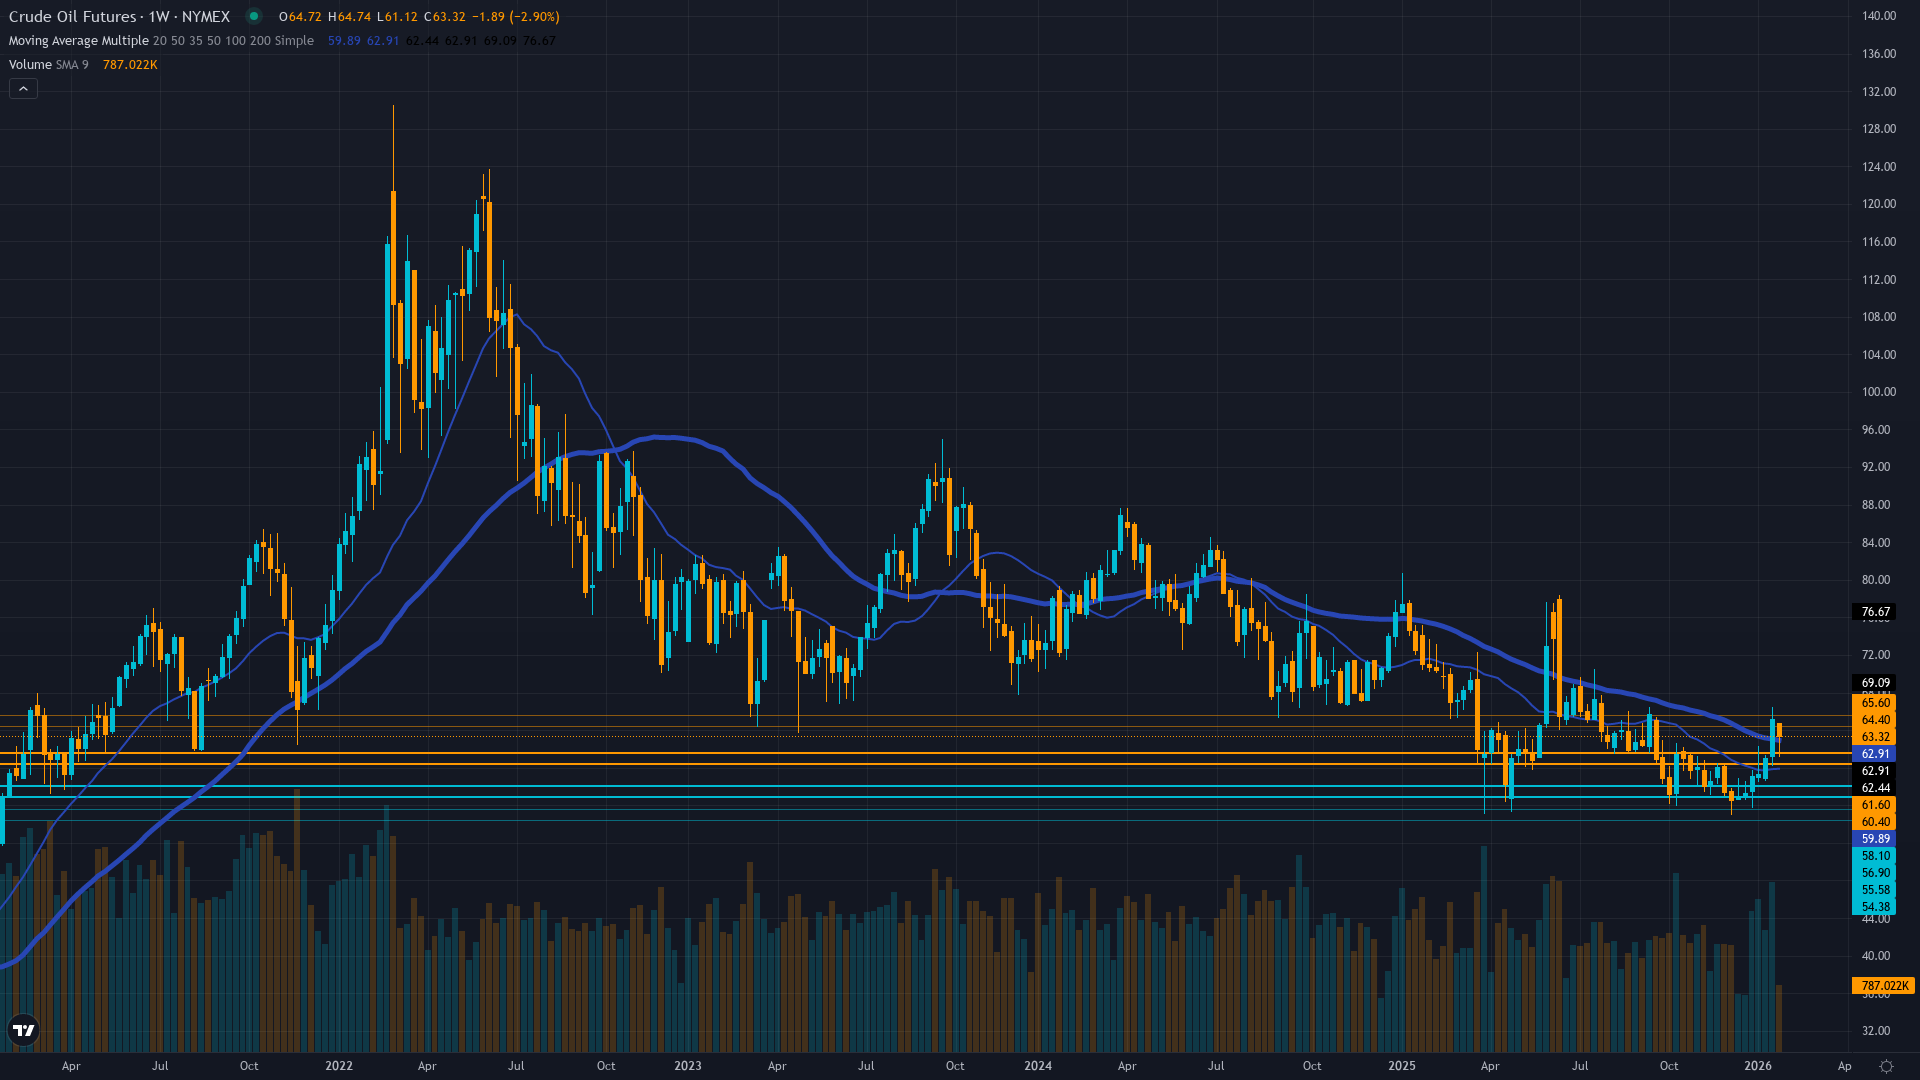
WTI crude oil stands at a defining inflection point on February 1, 2026, trading at $59.44 just 8% above the 52-week low of $54.98 established mid-December after a catastrophic 27% collapse from June 2025 highs of $80.59—making 2025 the worst annual performance in five years at -23.68%. The market faces a binary setup with three powerful crosscurrents colliding. First, OPEC+'s January 4 reaffirmation of their November 3 decision to maintain ZERO production increases for Q1 2026 (January-March) marks a critical regime shift from market share competition back toward price stability, yet fundamental headwinds remain formidable with the IEA projecting massive global supply surpluses of 3.8-4.0 million bpd in 2026.
Chinese oil demand has peaked at 15.4-16 million bpd with accelerating EV adoption that displaced 1.3 mb/d in 2024 alone and is expected to destroy 5 mb/d globally by 2030, while US production approaches record 13.6 million bpd. Second, January-February seasonality represents the first genuine tailwind in months—historical data shows crude oil demonstrates compelling seasonal strength from late December through August with annualized returns of +39.26% over 20 years, offering hope after November's brutal -3.1% seasonal headwind.
The January 8 EIA inventory draw of 3.8 million barrels to 419.1 million barrels (3% below five-year average) provides the first tangible validation of OPEC+ discipline effectiveness. Third, volatility dynamics reveal market exhaustion with OVX at 42.06 having elevated from compressed levels around 28 during consolidation—this elevated volatility suggests either final capitulation before seasonal reversal or breakdown acceleration toward $50. When volatility remains in this range during 25%+ declines, exhaustion bottoms form within 2-3 weeks in 65% of historical cases.
The technical structure shows WTI in a critical $57.5-61 consolidation range with the 52-week low of $54.98 representing psychological last line of defense. February seasonality historically shows neutral to modest positive performance, continuing the January pattern. Valuation context shows WTI at approximately 10th percentile of its 52-week range near extreme statistical cheapness. The consensus view remains cautiously bearish expecting eventual breakdown toward $50-52 range as structural oversupply overwhelms OPEC+ Q1 2026 production freeze.
However, this creates potential edge opportunity: the market may be overextending downside on February 1 ignoring January-February historical seasonal strength pattern, extreme positioning with year-end capitulation complete, and OPEC+ pain threshold at sub-$60 prices creating violent short squeeze potential if $54.98 holds and inventory data validates pause effectiveness over the next 2-4 weeks through February.
| Week | Bias | Confidence |
|---|---|---|
| February 1, 2026 | BEARISH | 8/10 |
| January 25, 2026 | BEARISH | 8/10 |
| January 18, 2026 | BEARISH | 8/10 |
| January 11, 2026 | BEARISH | 8/10 |
| January 4, 2026 | BEARISH | 9/10 |
| December 28, 2025 | BEARISH | 9/10 |
| December 21, 2025 | BEARISH | 9/10 |
| December 14, 2025 | BEARISH | 9/10 |
| December 7, 2025 | NEUTRAL | 8/10 |
| November 30, 2025 | BEARISH | 8/10 |
| November 23, 2025 | BEARISH | 8/10 |
| November 16, 2025 | NEUTRAL | 8/10 |


