AUD/USD (6A) — RBA February 3 rate hike to 3.85% reversing entire 2025 easing cycle creating…
Rapidly shifting from bearish expecting continued RBA cuts toward aggressive bullish recognizing inflation-driven hawkish pivot creates unprecedented multi-month support with February 3 hike validating transformation

Rapidly shifting from bearish expecting continued RBA cuts toward aggressive bullish recognizing inflation-driven hawkish pivot creates unprecedented multi-month support with February 3 hike validating transformation
RBA February 3 rate hike to 3.85% reversing entire 2025 easing cycle creating unprecedented policy divergence as Fed holds at 3.50-3.75%
Q4 CPI shock at 3.9% substantially above 2-3% target forcing complete reversal of market expectations from 80% cut probability in November to delivered February hike reality
China manufacturing PMI at 50.1 barely in expansion but commodity correlation weakening as monetary policy divergence dominates price action overwhelming traditional China linkage
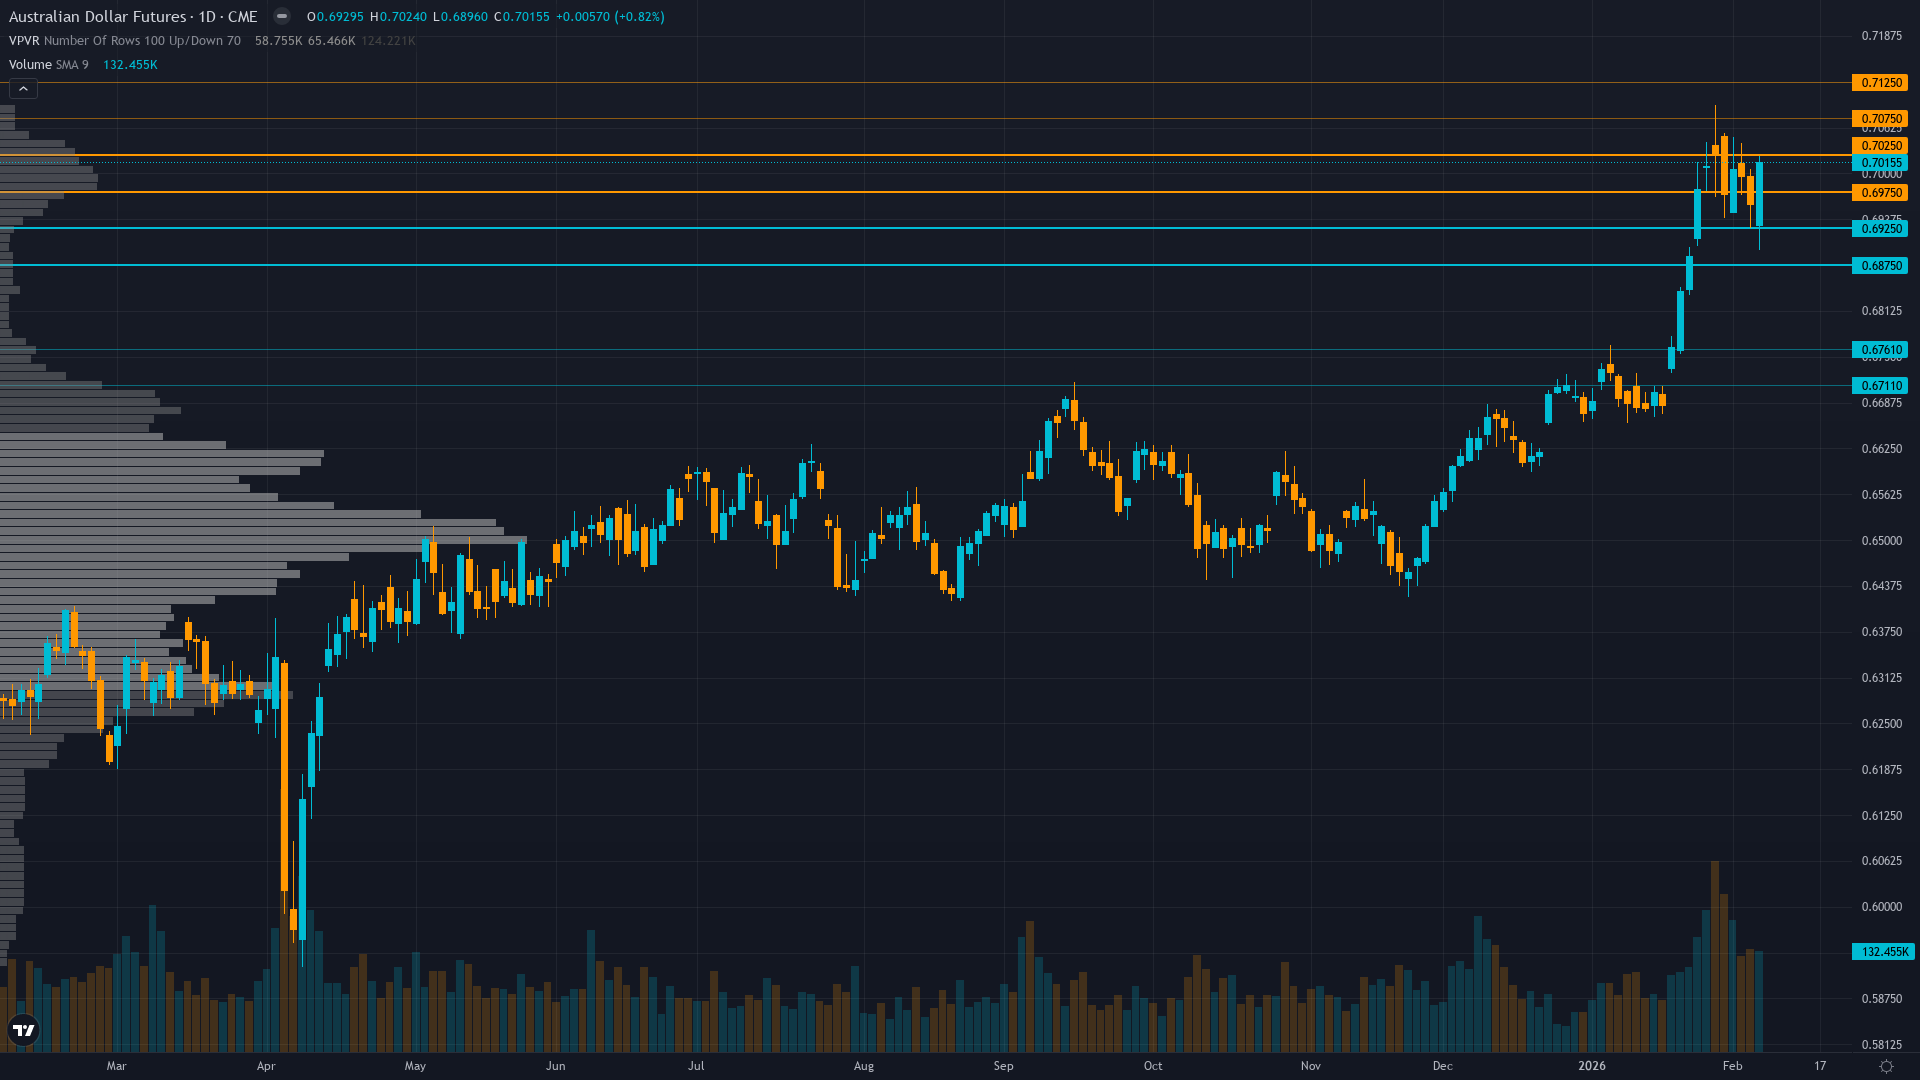
| ▲ Resistance Zone 2 | 0.7080 – 0.7120 |
| ▲ Resistance Zone 1 | 0.6980 – 0.7020 |
| ─ Pivot Area | ~0.6959 |
| ▼ Support Zone 1 | 0.6880 – 0.6920 |
| ▼ Support Zone 2 | 0.6716 – 0.6756 |
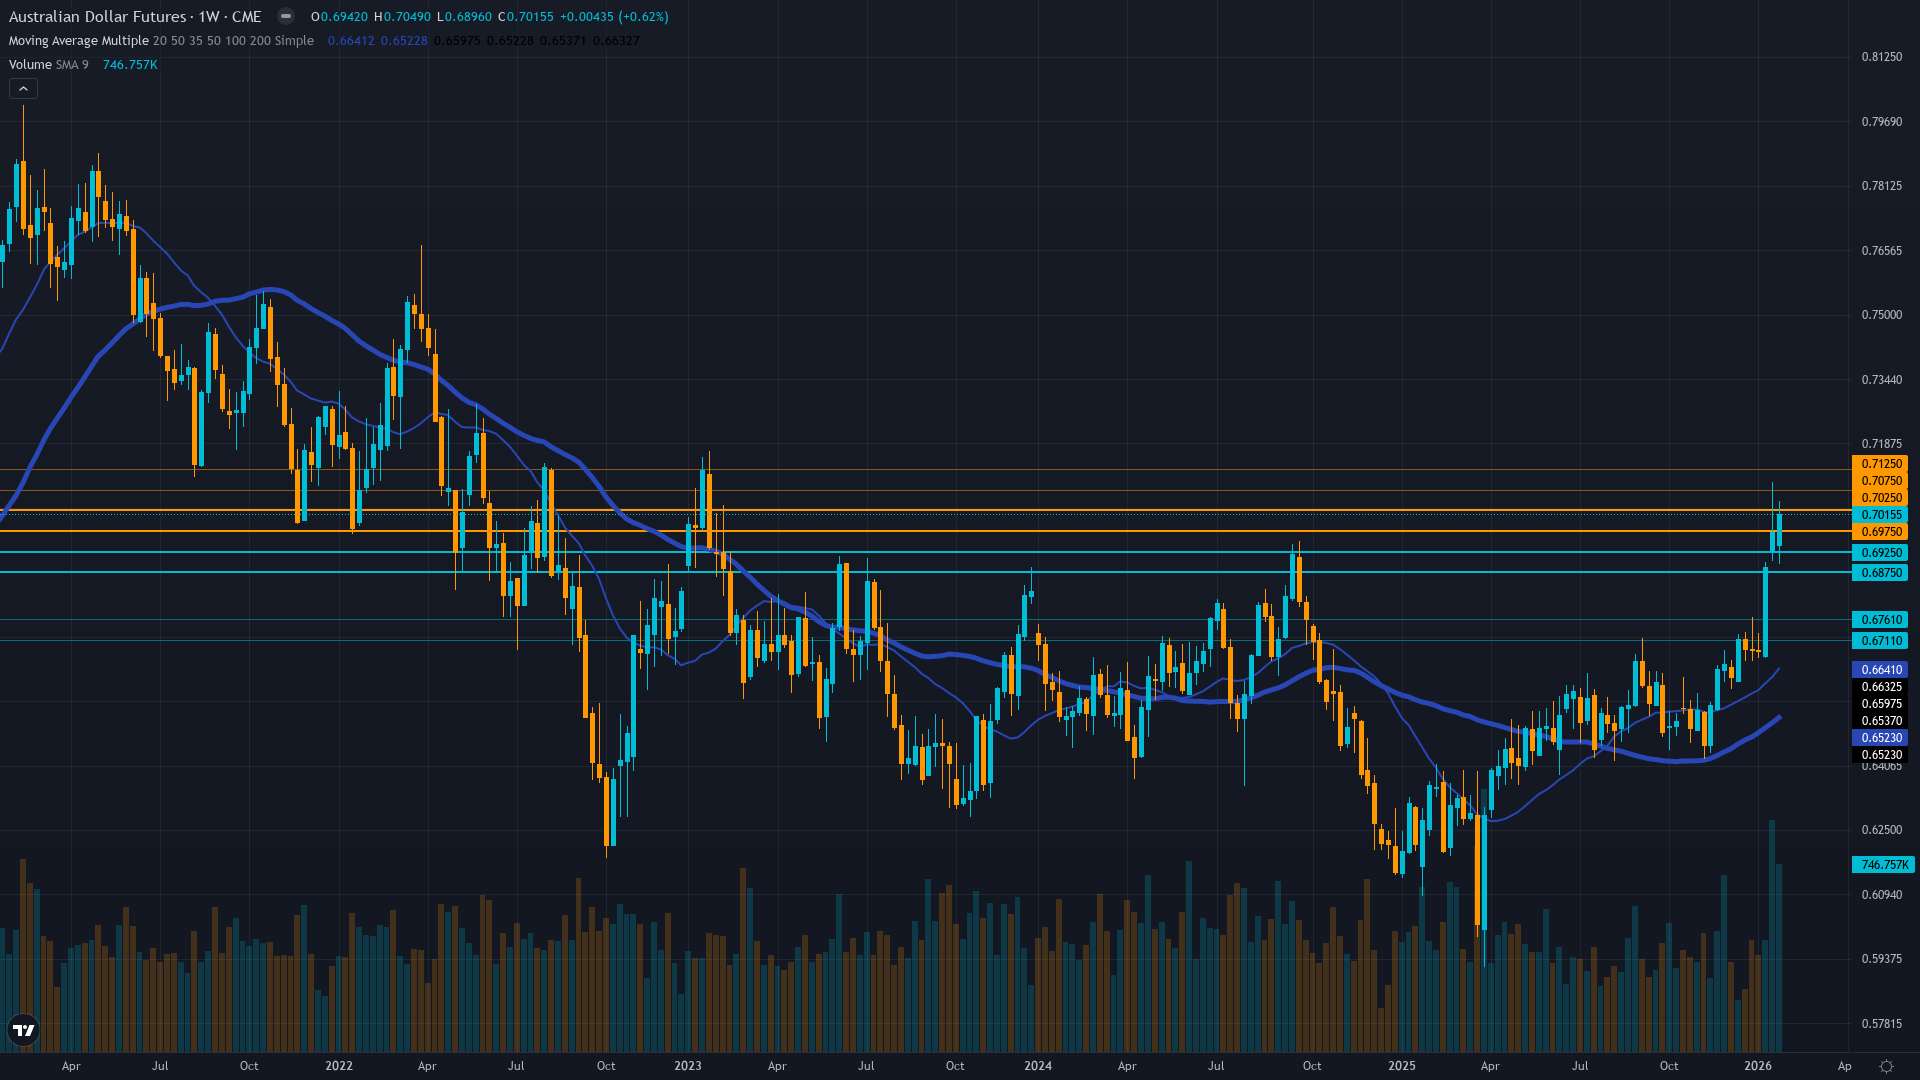
Trading at 14-month highs near 0.6959 after 501bp rally from November 23 low at 0.6458, decisively above psychological 0.6900 level approaching critical 0.7000 round number resistance
Policy divergence inverted with RBA at 3.85% after February hike while Fed at 3.50-3.75% creating 10-35bp gap favoring AUD, potential for 60-85bp advantage if Fed cuts while RBA holds/hikes again
Violently repositioned from 80%+ November cut expectations to February hike reality creating short squeeze from 0.6458 lows; now constructive but not extreme at 14-month highs allowing further upside
Implied volatility normalized from October-November 72nd percentile elevated regime to current 54-56th percentile as major binary catalysts resolved, further mean reversion likely barring fresh inflation surprises
Unprecedented monetary policy divergence with Fed easing cycle at 3.50-3.75% contrasting RBA tightening at 3.85% creating strongest AUD fundamental backdrop since 2022, offset by China PMI 50.1 weakness
Normal with short-term contracting toward long-term baseline after October-November elevated regime resolved post-RBA and Fed catalysts creating stable environment
High volatility regimes around RBA meetings and inflation surprises typically persist 30-50 days then revert sharply to baseline; current normalization at day 97 since October peak suggesting stable 60-80bp daily ranges through mid-February before CPI catalyst potentially triggers new elevated regime
Strong 80% probability volatility continues normalizing toward 50th percentile over next 10-14 days as December-February catalysts fully digested before February 25 CPI potentially reignites volatility with 100-150bp move within 24-48 hours if inflation surprises
Normalizing volatility suggests 60-80bp daily ranges versus October's 100-150bp creating more stable environment for directional positioning; breakouts above 0.7000 or breakdown below 0.6900 require sustained follow-through in lower vol environment providing clearer conviction signals
Volatility compression from 72nd to 54th percentile reduces tail risk but February 25 CPI could trigger 100-150bp move within 24-48 hours if inflation surprises either direction creating asymmetric opportunity; expect 150-200bp monthly range February versus 250-300bp in October-November catalyst period
|
⚠️ Primary Risk
China PMI deterioration below 50.0 into deeper contraction threatening 30% of Australian export demand or Fed hawkish pause reversing easing cycle eliminating policy divergence advantage Probability: MEDIUM
|
✦ Primary Opportunity
RBA delivers second consecutive hike March-April 2026 to 4.10% while Fed continues measured easing to 3.25-3.50% creating 60-100bp policy inversion driving sustained rally toward 0.7100-0.7200 into Q2 Timeframe: 4-8 weeks through February 25 CPI and potential March 17-18 RBA meeting as multi-hike cycle gains conviction
|
The Australian Dollar stands at a transformative inflection point trading at 14-month highs of 0.6959 following the most dramatic fundamental regime shift in the currency's modern history. On February 3, just 5 days ago, the RBA delivered a stunning 25bp rate hike to 3.85%, marking the shortest easing cycle on record after only three cuts in 2025 and reversing policy direction in response to Q4 CPI shocking at 3.9% versus consensus 3.5%. This represents a complete repudiation of the dovish consensus that dominated November when markets priced 80%+ probability of continued easing.
AUD has surged 501 basis points from the November 23 capitulation low of 0.6458 to current levels, breaking decisively through 0.6900 and approaching the psychologically critical 0.7000 round number. The policy divergence dynamics are unprecedented: the Fed holds at 3.50-3.75% with measured easing expected to continue, while the RBA not only halted easing but actively tightened, creating a 10-35bp differential favoring AUD that could expand to 60-100bp if the divergence persists through H1 2026. Markets now price 55% probability of additional RBA tightening if the January CPI (released February 25) confirms inflation persistence above 3.5%.
Critical crosscurrents persist—China's manufacturing PMI at 50.1 barely crosses expansion territory but remains substantially below September's 51.2 peak, threatening Australia's largest trading partner accounting for 30% of exports. However, the traditional commodity correlation has materially weakened as monetary policy divergence overwhelms China linkage. February seasonality shows historically weak patterns for AUD with average losses of -0.2% since 1971, suggesting limited seasonal tailwinds from current elevated levels.
The currency trades at approximately 73rd percentile of 1-year range, elevated but not at extremes given the magnitude of fundamental shift. Technically, consolidation between 0.6900-0.7000 defines the immediate battleground following the powerful November-February rally, with the psychologically important 0.7000 level representing critical resistance. Volatility has normalized substantially from the elevated 72nd percentile during October-November catalyst period to current 54-56th percentile as binary events resolve, suggesting stable 60-80bp daily ranges versus prior 100-150bp.
The February 25 monthly CPI emerges as the next major catalyst—if it confirms inflation persistence above 3.5%, markets will violently reprice March RBA hike odds from current 35% toward 65-70%, potentially triggering another explosive leg higher toward 0.7100-0.7200. This represents the most significant fundamental transformation since the August 2025 RBA cut initiated the now-reversed easing cycle—a genuine regime change from structural 6-month bearishness to aggressive bullishness that could persist through H1 2026 if inflation validates the hawkish pivot and the Fed continues its measured easing path.
| Week | Bias | Confidence |
|---|---|---|
| February 8, 2026 | BULLISH | 8/10 |
| February 1, 2026 | BULLISH | 8/10 |
| January 25, 2026 | BULLISH | 8/10 |
| January 18, 2026 | BULLISH | 8/10 |
| January 11, 2026 | BULLISH | 8/10 |
| January 4, 2026 | BULLISH | 8/10 |
| December 28, 2025 | BULLISH | 8/10 |
| December 21, 2025 | BULLISH | 7/10 |
| December 14, 2025 | BULLISH | 8/10 |
| December 7, 2025 | BULLISH | 8/10 |
| November 30, 2025 | NEUTRAL | 7/10 |
| November 23, 2025 | NEUTRAL | 7/10 |


