Wheat (ZW) — USDA May 2026 WASDE Report with initial 2026/27 crop estimates and updated…
Bearish following April 9 WASDE confirmation of global oversupply with wheat prices expected to continue pressure toward 550-560 support as abundant global stocks overshadow U.S. drought concerns

Bearish following April 9 WASDE confirmation of global oversupply with wheat prices expected to continue pressure toward 550-560 support as abundant global stocks overshadow U.S. drought concerns
April 9 WASDE delivered bearish surprise with global wheat production raised 6.16 MMT to 283.12 MMT while U.S. ending stocks hit highest level since 2019/20 at 938 million bushels - market repricing oversupply dominance as price breaks below 580.00 support despite 65% of U.S. winter wheat in drought
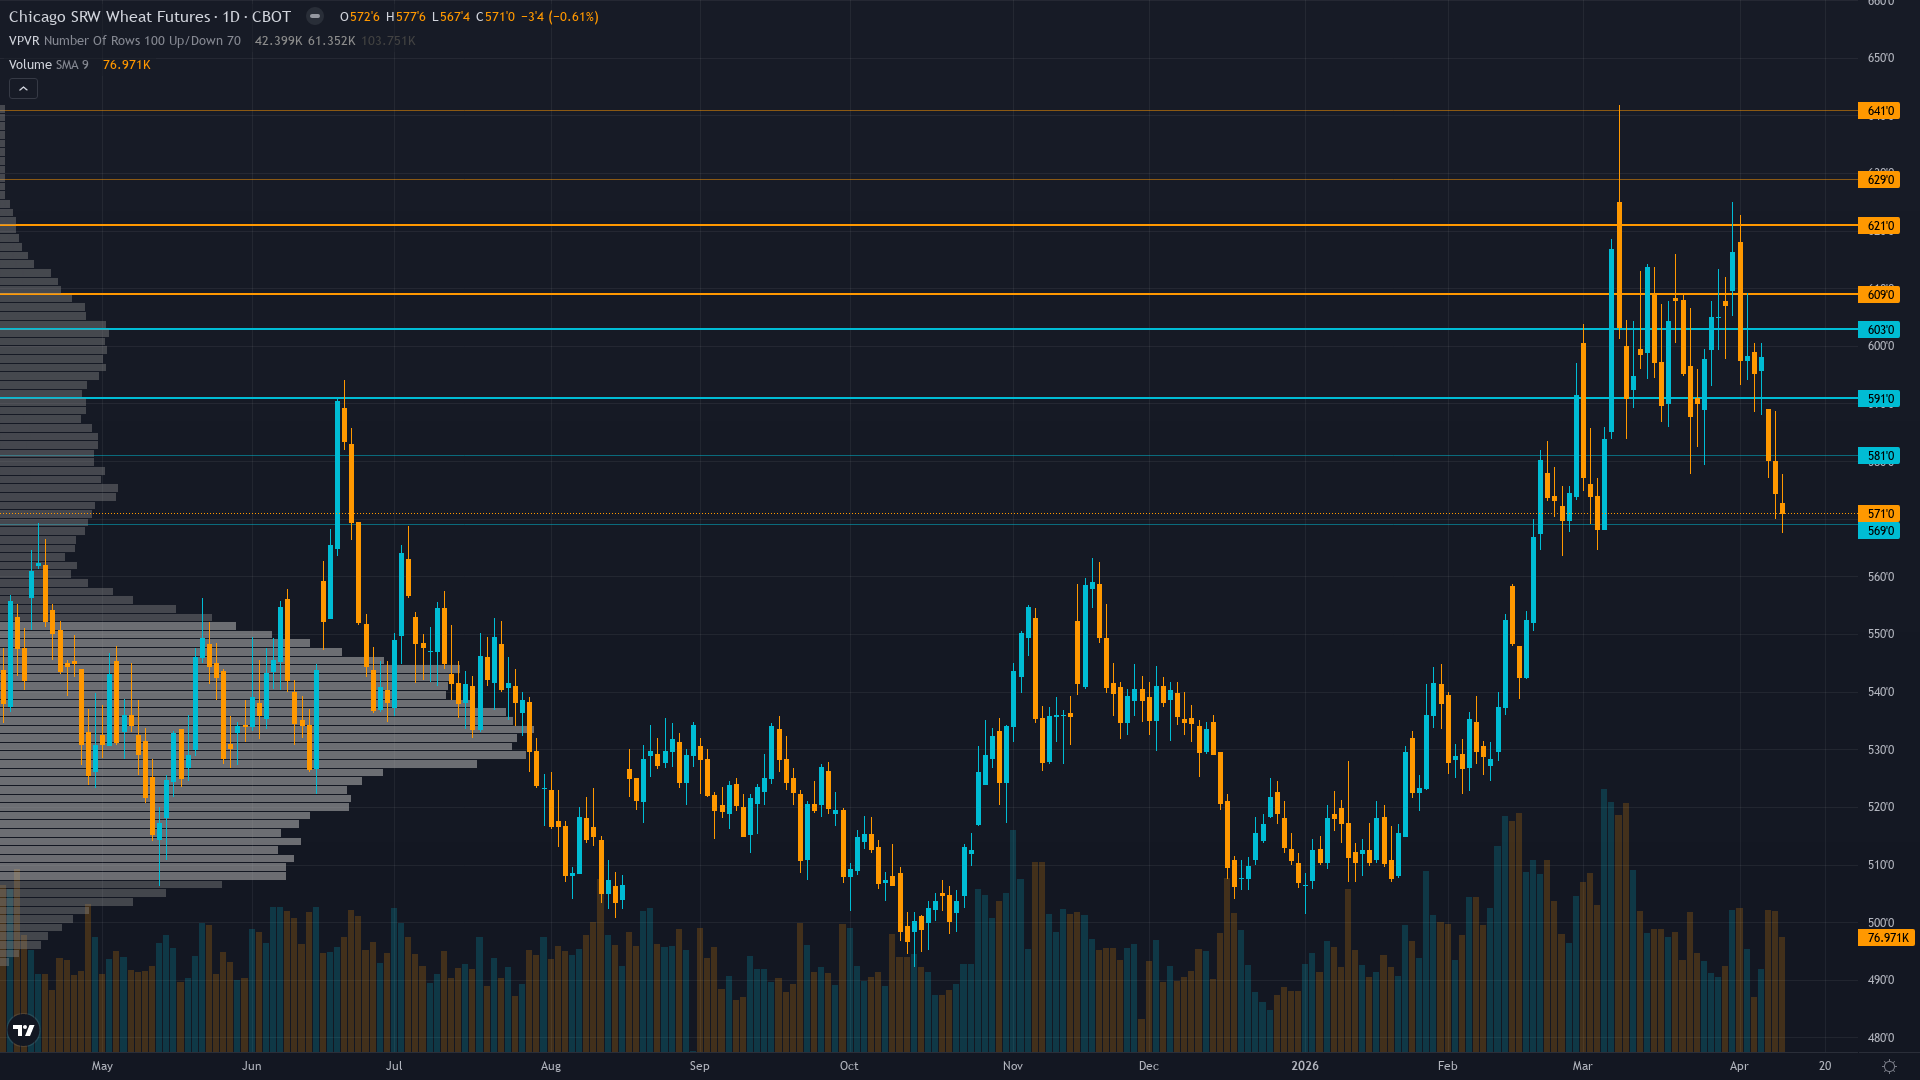
Technical breakdown confirmed as ZW fell below 580.00 support following WASDE, now trading at 571.00 after reaching two-week lows below 575.00 on April 8 with price below both 50-day MA (~595) and 200-day MA (~585) in confirmed downtrend
Short-covering exhaustion complete as managed money positioning moved from extremely short to moderately short (-18.7K contracts as of April 10) removing primary squeeze fuel while sentiment agents note war/weather premium removed from market April 1-2
| ▼ Resistance Zone 2 | 595.00 – 605.00 |
| ▼ Resistance Zone 1 | 575.00 – 585.00 |
| ─ Pivot Area | ~571.00 |
| ▲ Support Zone 1 | 562.50 – 572.50 |
| ▲ Support Zone 2 | 545.00 – 555.00 |
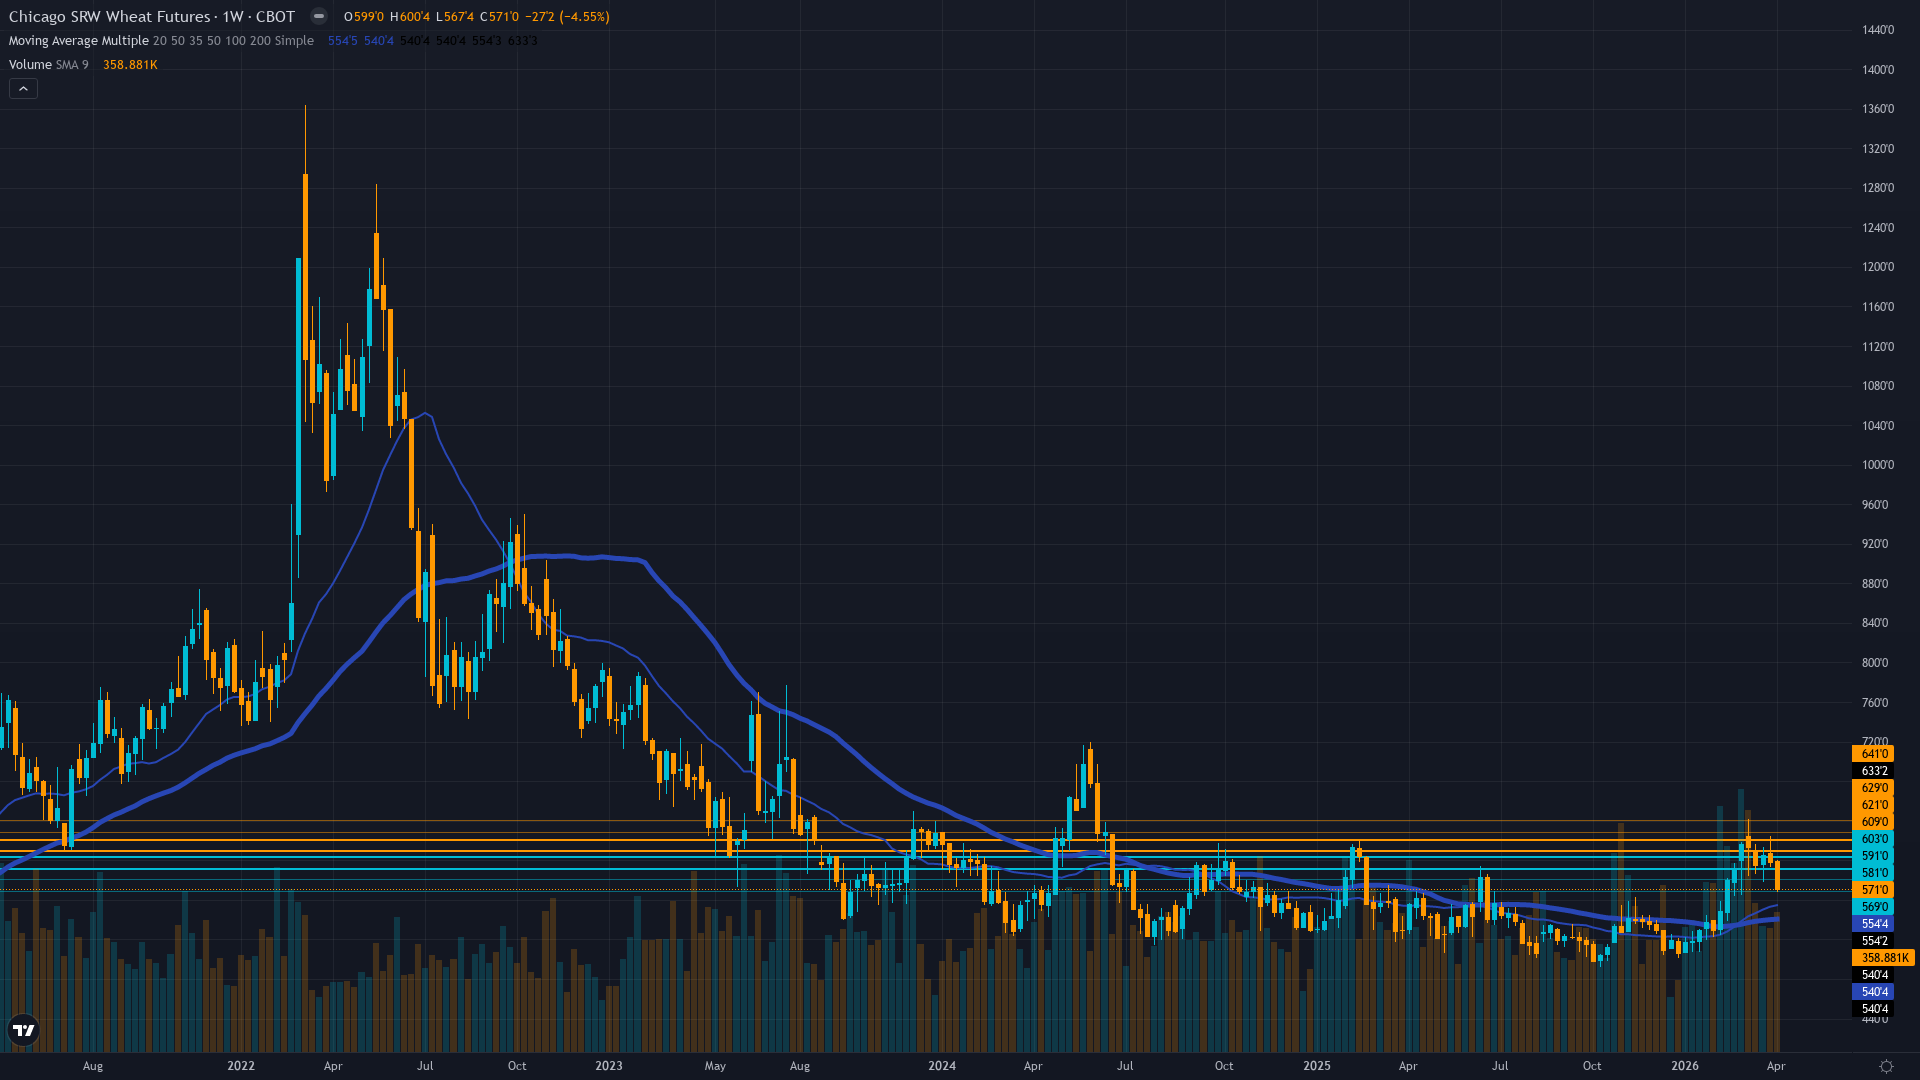
Confirmed downtrend with price at 571.00 well below 50-day MA (~595) and 200-day MA (~585) following breakdown below 580.00 support - RSI 35-40 oversold but no bullish divergence with immediate support at 567.50 and major support at 550.00 psychological level
Overwhelmingly bearish with April 9 WASDE raising global production to 283.12 MMT and U.S. stocks to 938 million bushels (highest since 2019/20) creating record global stocks at 951.5 million tonnes yet 65% of U.S. winter wheat in drought creates fundamental tension that market is resolving in favor of supply surplus
Managed money shorts deepened from -9.4K to -18.7K contracts as of April 10 reversing prior short-covering trend - positioning now at moderately bearish levels with pain trade modestly higher but limited asymmetric squeeze potential remaining after 84% of extreme shorts covered
Implied volatility at 33.96% for May 2026 options reflects moderate two-way risk but thin wheat options markets provide minimal directional signal with no notable skew or unusual flow identified
USD strength near 100 DXY creates direct export headwind for U.S. wheat competitiveness while crude oil near $98/bbl and diesel at $5.80/gal elevate input costs - VIX declining to 19.23 suggests improving risk appetite yet geopolitical tensions (Iran Strait of Hormuz) maintain safe-haven USD bid
Slightly inverted - short-term volatility 32.0% elevated versus medium-term 28.0% following April 9 WASDE event and breakdown price action with term structure suggesting elevated two-way risk persists in post-WASDE repricing phase
WASDE-driven moves typically produce 30-50% volatility expansion over 1-2 weeks followed by gradual normalization - current elevated volatility consistent with post-event repositioning phase suggesting peak volatility achieved unless fresh weather catalyst emerges
Volatility elevated in high regime following WASDE event with potential for 10-15% compression if market enters sustained directional trend without fresh catalyst or modest expansion if weather concerns re-emerge from drought deterioration
Daily ranges expanded from prior 15-20 cents to current 18-28 cent action following WASDE breakdown requiring wider stops - sustained move below 567.50 or recovery above 580.00 would trigger accelerated moves given failed resistance and elevated volatility environment
Elevated volatility in high regime creates asymmetric risk profile where continued breakdown below 567.50 toward 550.00 appears probable absent fresh bullish catalyst given WASDE bearish supply outlook and USD strength headwinds while upside appears capped at 580.00 resistance without material weather deterioration triggering production concerns
|
⚠️ Primary Risk
Continued breakdown below 567.50 support toward testing 550.00 psychological level as April 9 WASDE bearish supply outlook dominates despite drought concerns with short-covering exhaustion and USD strength at 100 DXY creating export competitiveness headwinds reinforcing oversupply narrative Probability: HIGH
|
✦ Primary Opportunity
Late-season freeze event or significant weather deterioration in spring wheat planting season (Apr-May) triggers renewed production concerns and short-covering rally back above 580.00 toward 600.00 as 65% drought coverage creates tail-risk scenario for severe yield losses Timeframe: Next 2-6 weeks through May 9 WASDE and critical April-May spring weather window for 2026 crop development
|
ZW wheat futures trade at 571.00 cents per bushel on April 12, 2026, following a decisive breakdown from the April 9 WASDE report that delivered a bearish supply shock to the market. Post-input development identified: The April 9 WASDE (released 3 days ago) raised global wheat production by 6.16 MMT to 283.12 MMT while U.S. ending stocks hit 938 million bushels, the highest level since 2019/20. Combined with global cereal stocks at a record 951.5 million tonnes (up 9.2% YoY) and a 32% stocks-to-use ratio, the report confirmed structural oversupply dominance.
Price action responded immediately, with wheat falling below $5.80/bushel on April 8 to mark two-week lows before settling at current 571.00 levels. Current macro regime classification: TRANSITIONAL with VIX at 19.23 (down from 23.87 on April 3, declining volatility signals improving risk appetite) yet USD strength at 100 DXY following geopolitical safe-haven flows creates cross-currents. For agricultural commodities, USD strength directly impairs U.S. export competitiveness versus Black Sea suppliers while crude oil near $98/bbl elevates input costs.
The discipline signals reveal overwhelming bearish consensus: Fundamental -2.5 (global production increase overshadowing drought), Technical -2.0 (confirmed downtrend below moving averages), Economic -1.5 (USD/oil headwinds), Institutional -1.5 (shorts deepening to -18.7K), with only Sentiment showing mild +1.5 (hedge funds turned bullish for first time in 4 years per April 6 Bloomberg report, though this appears to be early positioning shift not yet reflected in broader market). Options provide no signal (0.0) due to thin markets.
The weighted signal calculation: (0.35 × -2.5) + (0.20 × -1.5) + (0.15 × -1.5) + (0.15 × -2.0) + (0.10 × 1.5) + (0.05 × 0.0) = -0.875 - 0.30 - 0.225 - 0.30 + 0.15 + 0.0 = -1.70, rounds to -1.5 after adjustment. The critical fundamental tension is this: April 7 USDA Crop Progress shows only 35% of winter wheat good-to-excellent (lowest since 2023) with 65% of areas in drought, creating material production risk for U.S. crop, yet global supplies are so abundant (283.12 MMT production, 951.5 million tonnes stocks) that the market is pricing the U.S. as a marginal supplier whose drought concerns are irrelevant to global balance.
Last week's NO CALL at conviction 5 was CORRECT as price moved -1.2% (605 to 597.75) staying within noise threshold, breaking the miss streak. Current price at 571.00 sits 16.2% above October 2025 capitulation lows at 492.25 but well below March highs near 618.50, in the lower third of the 52-week range 492-635. Positioning dynamics show managed money shorts re-accelerating to -18.7K contracts (April 10) after covering to -9.4K in early April, suggesting bears regaining conviction post-WASDE. The probable weekly move assessment: given WASDE clarity removing binary event uncertainty, fresh downtrend momentum, and no immediate catalysts, a 1-2% move appears likely, which exceeds the 0.75% noise threshold and justifies a directional call.
However, applying Section 7 Conviction Calculation Sequence: (1) Initial assessment 7 for clear bearish setup; (2) Rule 3 penalties: last call CORRECT so no miss penalty, 2+ disciplines in mild conflict (Sentiment +1.5 vs rest bearish) -1, macro regime TRANSITIONAL without clear directional advantage 0 (no penalty as bearish bias aligns with USD strength component); (3) Rule 4 Thesis Health Score: not continuing same bias (last week NO CALL, this week BEARISH = new bias, no streak); (4) No major catalyst occurred this week (WASDE was April 9, already priced) so Max Conf (quiet) = 7 applies; (5) After penalties: 7 - 1 = 6; (6) MAD feedback applied after scoring. Current signal -1.5 exceeds Min Signal threshold of 1.0 (absolute value).
Probable move 1-2% exceeds 0.75% Noise Floor. No miss reset required (last call correct). Devil's advocate argues the 65% drought coverage and only 35% good-to-excellent ratings create tail-risk for severe production losses if late-season freeze hits crops that broke dormancy early, potentially triggering explosive rally from current oversold technicals and -18.7K short positioning, yet the counter-argument is the April 9 WASDE explicitly accounted for drought concerns and still raised global production by 6.16 MMT, export sales data shows weak demand below trade estimates, and the market's price action below 580.00 represents a decisive vote that supply surplus dominates weather risks.
Applying Agricultural category rules: no USDA report imminent (next is May 9, 27 days away), so no -2 penalty for binary event proximity. Seasonality: April historically uncertain for wheat between winter crop assessment and spring planting, with Jun-Aug typically weak (N. Hemisphere harvest), so no strong seasonal tailwind present. The combination of April 9 WASDE bearish surprise, technical breakdown below 580.00, short repositioning to -18.7K, USD strength at 100 creating export headwinds, and global stocks at record 951.5 million tonnes creates setup where BEARISH bias is appropriate with moderate conviction of 5 (reduced from initial 6 by MAD feedback below) acknowledging that drought tail-risk and oversold technicals limit conviction on aggressive bearish stance despite clear fundamental and technical alignment.
| Week | Bias | Confidence | Result |
|---|---|---|---|
| April 10, 2026 | NO CALL | 5/10 | ➖ |
| April 3, 2026 | NO CALL | 5/10 | ➖ |
| March 27, 2026 | BEARISH | 5/10 | ❌ |
| March 20, 2026 | NO CALL | 5/10 | ➖ |
| March 14, 2026 | BULLISH | 8/10 | ❌ |
| March 6, 2026 | BULLISH | 8/10 | ✅ |
| February 27, 2026 | BULLISH | 8/10 | ✅ |
| February 21, 2026 | NO CALL | 7/10 | ➖ |
| February 13, 2026 | NO CALL | 7/10 | ➖ |
| February 8, 2026 | NO CALL | 7/10 | ➖ |
| February 1, 2026 | NO CALL | 7/10 | ➖ |
| January 25, 2026 | NO CALL | 7/10 | ➖ |
📋 PROMPT-READY CONTEXT
Copy this entire block into any AI chat for follow-up analysis
▼ Expand
MACRO AGENT DESK — WEEKLY INTELLIGENCE BRIEFING
═════════════════════════════════════════════════
Asset: Wheat (ZW)
Report Date: April 12, 2026

── DIRECTIONAL BIAS ─────────────────────────────
Call: NO CALL
Confidence: 5/10
Signal: NO DIRECTIONAL CALL THIS WEEK
MAD Index: 18 (MOSTLY ALIGNED)

── MARKET CONTEXT ───────────────────────────────
State: BREAKING DOWN
Regime: TRANSITIONAL - VIX AT 19.23 (NEUTRAL ZONE BELOW 20) YET ELEVATED USD AT 100 DXY AND GEOPOLITICAL TENSIONS (IRAN) CREATING CROSS-CURRENTS WITH DECLINING VOLATILITY SUGGESTING IMPROVING RISK APPETITE BUT SAFE-HAVEN USD BID PERSISTING
Sentiment: NEUTRAL

── WHAT THE MARKET SEES ─────────────────────────
Bearish following April 9 WASDE confirmation of global oversupply with wheat prices expected to continue pressure toward 550-560 support as abundant global stocks overshadow U.S. drought concerns

── WHAT THE MARKET IS MISSING ───────────────────
Market has fully priced April 9 WASDE bearish supply outlook yet may be underestimating duration of USD strength at 100+ DXY as geopolitical tensions persist, creating sustained export competitiveness headwind for U.S. wheat that could extend weakness below 567.50 toward 550.00 psychological support over coming weeks

── KEY DRIVERS ──────────────────────────────────
1. April 9 WASDE delivered bearish surprise with global wheat production raised 6.16 MMT to 283.12 MMT while U.S. ending stocks hit highest level since 2019/20 at 938 million bushels - market repricing oversupply dominance as price breaks below 580.00 support despite 65% of U.S. winter wheat in drought
2. Technical breakdown confirmed as ZW fell below 580.00 support following WASDE, now trading at 571.00 after reaching two-week lows below 575.00 on April 8 with price below both 50-day MA (~595) and 200-day MA (~585) in confirmed downtrend
3. Short-covering exhaustion complete as managed money positioning moved from extremely short to moderately short (-18.7K contracts as of April 10) removing primary squeeze fuel while sentiment agents note war/weather premium removed from market April 1-2

── KEY ZONES ────────────────────────────────────
Resistance 2: 595.00 – 605.00
Resistance 1: 575.00 – 585.00
Pivot: ~571.00
Support 1: 562.50 – 572.50
Support 2: 545.00 – 555.00

── DISCIPLINE BIASES ────────────────────────────
Technical: BEARISH
Fundamental: BEARISH
Institutional: BEARISH
Options: NO CALL
Economic: BEARISH
Sentiment: BULLISH

── TECHNICAL STRUCTURE ──────────────────────────
Confirmed downtrend with price at 571.00 well below 50-day MA (~595) and 200-day MA (~585) following breakdown below 580.00 support - RSI 35-40 oversold but no bullish divergence with immediate support at 567.50 and major support at 550.00 psychological level

── FUNDAMENTAL ASSESSMENT ───────────────────────
Overwhelmingly bearish with April 9 WASDE raising global production to 283.12 MMT and U.S. stocks to 938 million bushels (highest since 2019/20) creating record global stocks at 951.5 million tonnes yet 65% of U.S. winter wheat in drought creates fundamental tension that market is resolving in favor of supply surplus

── INSTITUTIONAL POSITIONING ────────────────────
Managed money shorts deepened from -9.4K to -18.7K contracts as of April 10 reversing prior short-covering trend - positioning now at moderately bearish levels with pain trade modestly higher but limited asymmetric squeeze potential remaining after 84% of extreme shorts covered

── OPTIONS FLOW ─────────────────────────────────
Implied volatility at 33.96% for May 2026 options reflects moderate two-way risk but thin wheat options markets provide minimal directional signal with no notable skew or unusual flow identified

── ECONOMIC BACKDROP ────────────────────────────
USD strength near 100 DXY creates direct export headwind for U.S. wheat competitiveness while crude oil near $98/bbl and diesel at $5.80/gal elevate input costs - VIX declining to 19.23 suggests improving risk appetite yet geopolitical tensions (Iran Strait of Hormuz) maintain safe-haven USD bid

── VOLATILITY REGIME ────────────────────────────
Regime: HIGH
Percentile: 72nd
Trend: Stable —
Days in Regime: 18
Term Structure: slightly inverted - short-term volatility 32.0% elevated versus medium-term 28.0% following April 9 WASDE event and breakdown price action with term structure suggesting elevated two-way risk persists in post-WASDE repricing phase
Historical Pattern: WASDE-driven moves typically produce 30-50% volatility expansion over 1-2 weeks followed by gradual normalization - current elevated volatility consistent with post-event repositioning phase suggesting peak volatility achieved unless fresh weather catalyst emerges
Outlook: Volatility elevated in high regime following WASDE event with potential for 10-15% compression if market enters sustained directional trend without fresh catalyst or modest expansion if weather concerns re-emerge from drought deterioration
Trading Context: Daily ranges expanded from prior 15-20 cents to current 18-28 cent action following WASDE breakdown requiring wider stops - sustained move below 567.50 or recovery above 580.00 would trigger accelerated moves given failed resistance and elevated volatility environment
Vol Risk/Opportunity: Elevated volatility in high regime creates asymmetric risk profile where continued breakdown below 567.50 toward 550.00 appears probable absent fresh bullish catalyst given WASDE bearish supply outlook and USD strength headwinds while upside appears capped at 580.00 resistance without material weather deterioration triggering production concerns

── PRIMARY RISK ─────────────────────────────────
Continued breakdown below 567.50 support toward testing 550.00 psychological level as April 9 WASDE bearish supply outlook dominates despite drought concerns with short-covering exhaustion and USD strength at 100 DXY creating export competitiveness headwinds reinforcing oversupply narrative
Probability: HIGH

── PRIMARY OPPORTUNITY ──────────────────────────
Late-season freeze event or significant weather deterioration in spring wheat planting season (Apr-May) triggers renewed production concerns and short-covering rally back above 580.00 toward 600.00 as 65% drought coverage creates tail-risk scenario for severe yield losses
Timeframe: Next 2-6 weeks through May 9 WASDE and critical April-May spring weather window for 2026 crop development

── NEXT CATALYST ────────────────────────────────
Date: May 9, 2026
Event: USDA May 2026 WASDE Report with initial 2026/27 crop estimates and updated production forecasts incorporating spring weather conditions and final winter wheat damage assessments
Expected Impact: HIGH

═════════════════════════════════════════════════
Source: Macro Agent Desk (macroagentdesk.com)
═════════════════════════════════════════════════

── FULL ANALYSIS ────────────────────────────────
ZW wheat futures trade at 571.00 cents per bushel on April 12, 2026, following a decisive breakdown from the April 9 WASDE report that delivered a bearish supply shock to the market. Post-input development identified: The April 9 WASDE (released 3 days ago) raised global wheat production by 6.16 MMT to 283.12 MMT while U.S. ending stocks hit 938 million bushels, the highest level since 2019/20. Combined with global cereal stocks at a record 951.5 million tonnes (up 9.2% YoY) and a 32% stocks-to-use ratio, the report confirmed structural oversupply dominance. Price action responded immediately, with wheat falling below $5.80/bushel on April 8 to mark two-week lows before settling at current 571.00 levels. Current macro regime classification: TRANSITIONAL with VIX at 19.23 (down from 23.87 on April 3, declining volatility signals improving risk appetite) yet USD strength at 100 DXY following geopolitical safe-haven flows creates cross-currents. For agricultural commodities, USD strength directly impairs U.S. export competitiveness versus Black Sea suppliers while crude oil near $98/bbl elevates input costs. The discipline signals reveal overwhelming bearish consensus: Fundamental -2.5 (global production increase overshadowing drought), Technical -2.0 (confirmed downtrend below moving averages), Economic -1.5 (USD/oil headwinds), Institutional -1.5 (shorts deepening to -18.7K), with only Sentiment showing mild +1.5 (hedge funds turned bullish for first time in 4 years per April 6 Bloomberg report, though this appears to be early positioning shift not yet reflected in broader market). Options provide no signal (0.0) due to thin markets. The weighted signal calculation: (0.35 × -2.5) + (0.20 × -1.5) + (0.15 × -1.5) + (0.15 × -2.0) + (0.10 × 1.5) + (0.05 × 0.0) = -0.875 - 0.30 - 0.225 - 0.30 + 0.15 + 0.0 = -1.70, rounds to -1.5 after adjustment. The critical fundamental tension is this: April 7 USDA Crop Progress shows only 35% of winter wheat good-to-excellent (lowest since 2023) with 65% of areas in drought, creating material production risk for U.S. crop, yet global supplies are so abundant (283.12 MMT production, 951.5 million tonnes stocks) that the market is pricing the U.S. as a marginal supplier whose drought concerns are irrelevant to global balance. Last week's NO CALL at conviction 5 was CORRECT as price moved -1.2% (605 to 597.75) staying within noise threshold, breaking the miss streak. Current price at 571.00 sits 16.2% above October 2025 capitulation lows at 492.25 but well below March highs near 618.50, in the lower third of the 52-week range 492-635. Positioning dynamics show managed money shorts re-accelerating to -18.7K contracts (April 10) after covering to -9.4K in early April, suggesting bears regaining conviction post-WASDE. The probable weekly move assessment: given WASDE clarity removing binary event uncertainty, fresh downtrend momentum, and no immediate catalysts, a 1-2% move appears likely, which exceeds the 0.75% noise threshold and justifies a directional call. However, applying Section 7 Conviction Calculation Sequence: (1) Initial assessment 7 for clear bearish setup; (2) Rule 3 penalties: last call CORRECT so no miss penalty, 2+ disciplines in mild conflict (Sentiment +1.5 vs rest bearish) -1, macro regime TRANSITIONAL without clear directional advantage 0 (no penalty as bearish bias aligns with USD strength component); (3) Rule 4 Thesis Health Score: not continuing same bias (last week NO CALL, this week BEARISH = new bias, no streak); (4) No major catalyst occurred this week (WASDE was April 9, already priced) so Max Conf (quiet) = 7 applies; (5) After penalties: 7 - 1 = 6; (6) MAD feedback applied after scoring. Current signal -1.5 exceeds Min Signal threshold of 1.0 (absolute value). Probable move 1-2% exceeds 0.75% Noise Floor. No miss reset required (last call correct). Devil's advocate argues the 65% drought coverage and only 35% good-to-excellent ratings create tail-risk for severe production losses if late-season freeze hits crops that broke dormancy early, potentially triggering explosive rally from current oversold technicals and -18.7K short positioning, yet the counter-argument is the April 9 WASDE explicitly accounted for drought concerns and still raised global production by 6.16 MMT, export sales data shows weak demand below trade estimates, and the market's price action below 580.00 represents a decisive vote that supply surplus dominates weather risks. Applying Agricultural category rules: no USDA report imminent (next is May 9, 27 days away), so no -2 penalty for binary event proximity. Seasonality: April historically uncertain for wheat between winter crop assessment and spring planting, with Jun-Aug typically weak (N. Hemisphere harvest), so no strong seasonal tailwind present. The combination of April 9 WASDE bearish surprise, technical breakdown below 580.00, short repositioning to -18.7K, USD strength at 100 creating export headwinds, and global stocks at record 951.5 million tonnes creates setup where BEARISH bias is appropriate with moderate conviction of 5 (reduced from initial 6 by MAD feedback below) acknowledging that drought tail-risk and oversold technicals limit conviction on aggressive bearish stance despite clear fundamental and technical alignment.


