Silver (SI) — 1.5 between 74 support and 78.5 resistance with 6/10 confidence
Market consensus fractured between structural bulls targeting $80-90 recovery by Q2 on intact deficit fundamentals and cautious neutrals awaiting April 29 Fed clarity, CoinCodex algorithm predicting +1.07% to $77.04 by April 16 suggests modest bullish lean emerging

Market consensus fractured between structural bulls targeting $80-90 recovery by Q2 on intact deficit fundamentals and cautious neutrals awaiting April 29 Fed clarity, CoinCodex algorithm predicting +1.07% to $77.04 by April 16 suggests modest bullish lean emerging
Iran war ceasefire announcement reducing geopolitical risk premium triggered sharp oil price decline and easing inflation fears, creating paradox where safe-haven demand weakens but dollar strength from March CPI inflation shock (3.3% vs 2.4% prior) creates competing cross-current on precious metals
Sixth consecutive year of 67M oz structural deficit with industrial demand consuming record 59% of supply from solar/EV/AI sectors remains fundamentally intact despite near-term price volatility driven by monetary policy headwinds and geopolitical uncertainty resolution
Managed money positioning at historically washed-out levels near 24k contracts after January-March liquidation cascade combined with SLV outflows decelerating creates positioning asymmetry where downside from forced liquidation limited but upside requires catalyst
| ▼ Resistance Zone 2 | 80.50 – 83.50 |
| ▼ Resistance Zone 1 | 77.00 – 80.00 |
| ─ Pivot Area | ~76.26 |
| ▲ Support Zone 1 | 72.50 – 75.50 |
| ▲ Support Zone 2 | 68.50 – 71.50 |
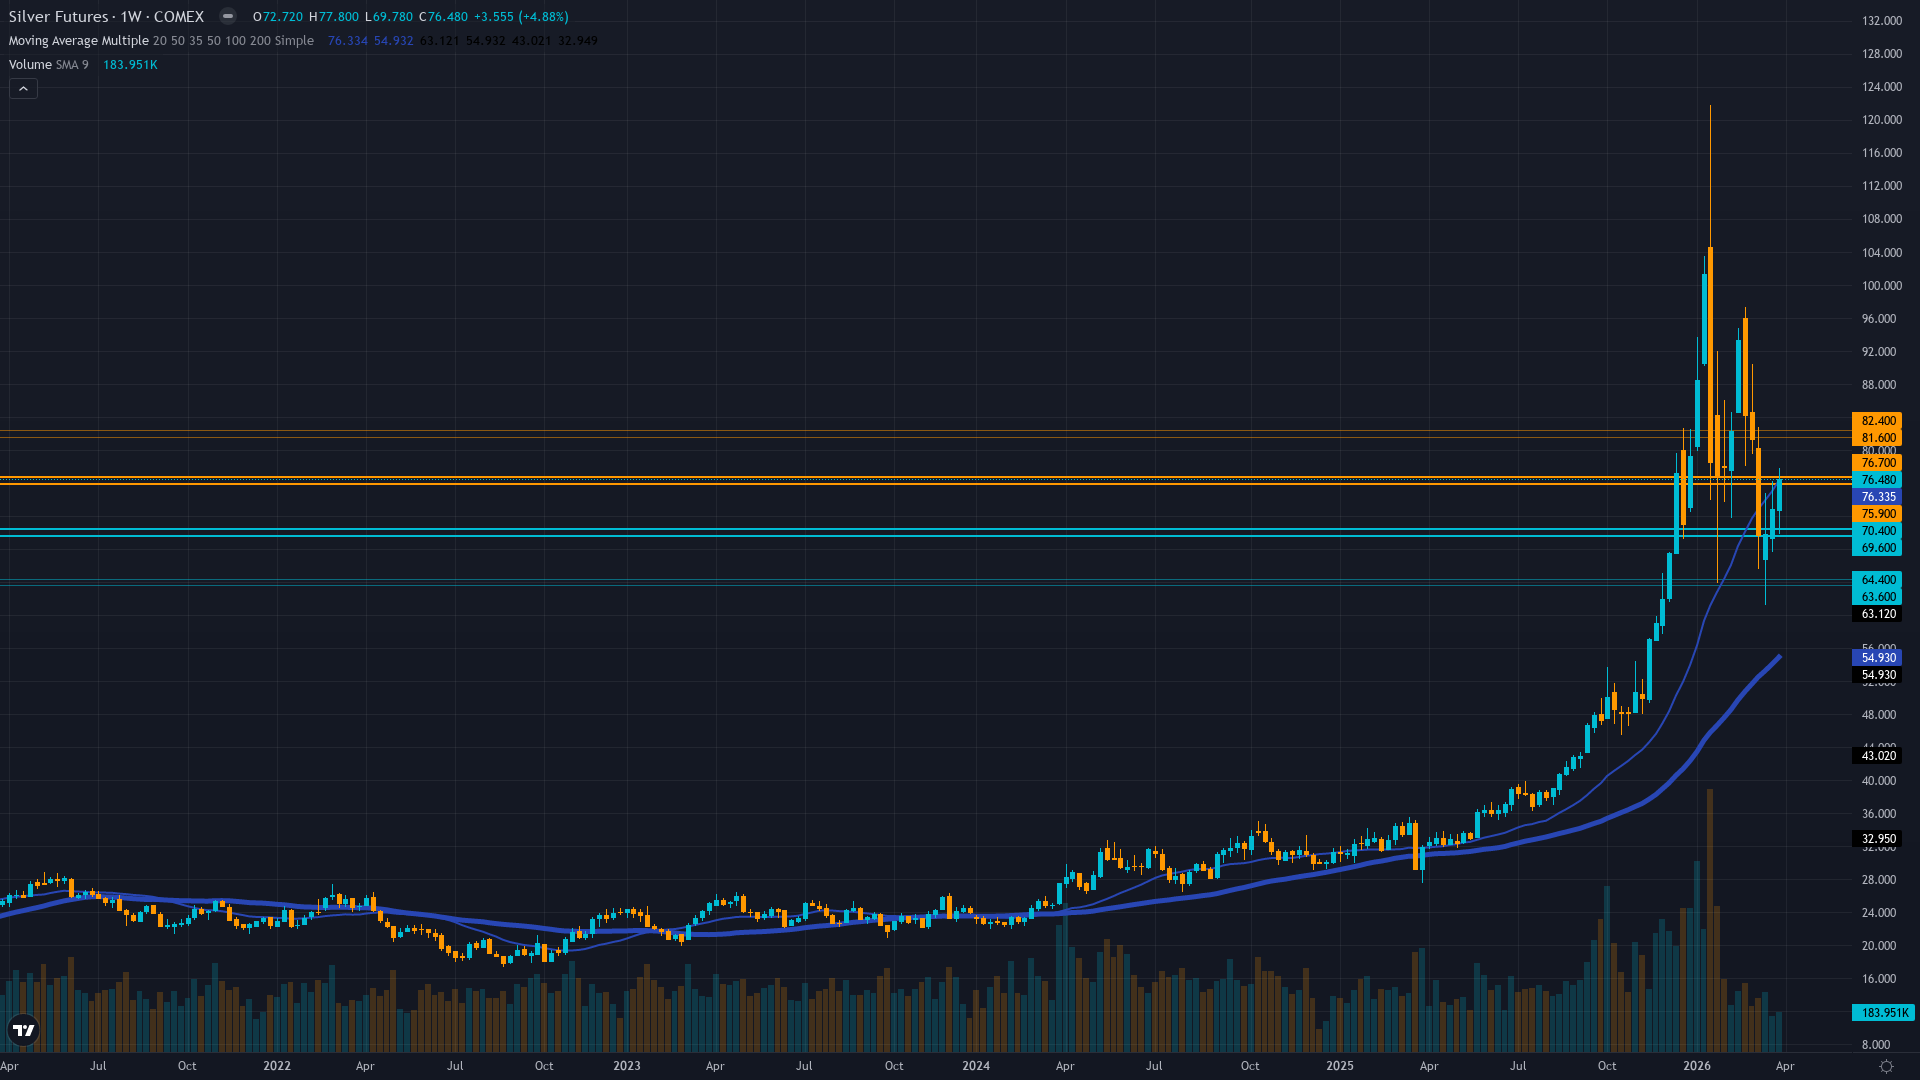
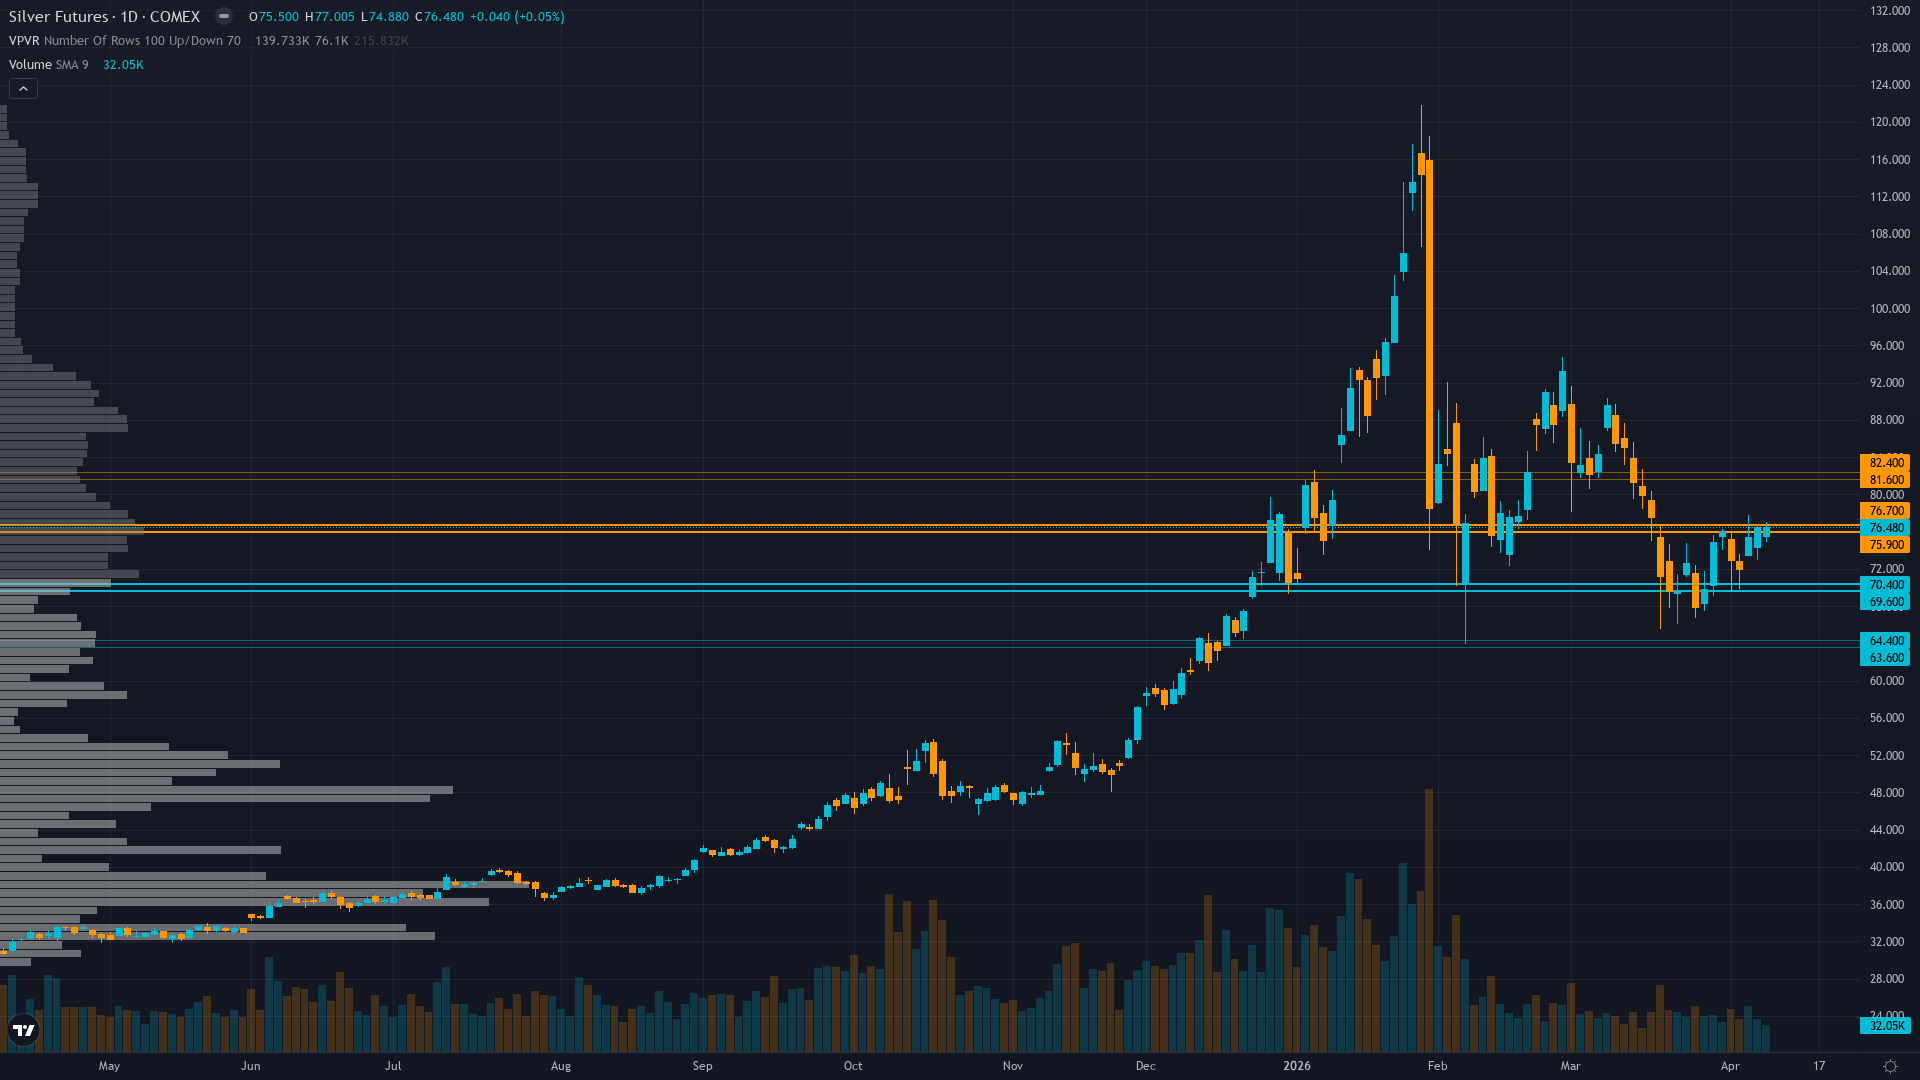
Consolidating in $74-78 range after recovering from March 29 low of $69.77, price at $76.26 trading well above 200-day MA at $57 but 14% below 50-day MA at $87, RSI at 63 indicates healthy momentum without overbought conditions
Sixth consecutive year of 67M oz structural deficit with 59% industrial demand unchanged, supply inelastic at 820M oz mine production, China export restrictions controlling 60-70% supply operational since January 1 creating medium-term floor despite short-term monetary policy headwinds
Managed money net long at 24k contracts near 2-year lows after January-March liquidation, SLV outflows decelerating from -9.32% peak but continuing, positioning reset creates asymmetric potential if catalyst emerges
Implied volatility elevated but insufficient current directional data, extreme volatility regime persisting creates wide daily ranges of 5-7% versus normal 2-3% requiring wider risk management parameters
Fed March 18 hawkish hold at 3.50-3.75% with ONE 2026 cut guidance drove real yields to 2.10%, March CPI released April 10 showed 3.3% YoY inflation spike from Iran war energy shock, next FOMC April 29 represents binary catalyst 17 days away
Inverted - short-term volatility at 50% remains elevated above long-term 48% reflecting acute post-March 18 FOMC shock with 5-7% daily ranges versus normal 2-3% as market digests hawkish Fed policy, Iran war resolution, and tests $74-78 consolidation zone stability
When volatility exceeds 80th percentile during Fed hawkish surprises combined with geopolitical shocks at oversold technical levels, historical pattern shows either consolidation with volatility compression if no additional catalysts occur (60% probability) or sharp directional resolution on binary Fed event (40% probability)—current trajectory at $76.26 with April 29 FOMC approaching favors consolidation with upward bias
High volatility at 82nd percentile following Fed policy shock and geopolitical events typically persists 10-20 days before moderation toward 75th percentile begins; current regime day 55 suggests elevated volatility may persist through April 29 FOMC binary event before normalization
High volatility at 82nd percentile requires stops 12-18% below entry versus normal 4-6% with daily ranges now 5-7% versus typical 2-3%, making intraday swings volatile but directional conviction viable; breakout above $78.50 becomes reliable continuation signal toward $82-85 if sustained, while breakdown below $74 accelerates correction risk to $70-72
High volatility regime at 82nd percentile creates potential for 8-15% total move from current $76.26 level toward either $88-90 if April 29 FOMC dovish (15% upside) or $65-70 if Fed remains hawkish and geopolitical tensions re-escalate (9-14% downside); asymmetry slightly favors upside given washed-out institutional positioning at 24k contracts near 2-year lows and intact sixth-year structural deficit providing fundamental floor above $70
|
⚠️ Primary Risk
Fed April 29-30 FOMC reinforces hawkish stance interpreting March 3.3% CPI as sustained inflation reacceleration rather than transitory energy shock, sustaining real yields above 2.0% and DXY above 105, triggering breakdown below $74 toward $70 support as remaining long positioning forced to capitulate Probability: MEDIUM
|
✦ Primary Opportunity
Iran war ceasefire holds and April CPI (released mid-month) shows inflation moderation as energy prices normalize, allowing Fed at April 29-30 FOMC to acknowledge March spike as transitory, weakening dollar below DXY 102 and driving real yields below 1.90%, enabling recovery toward $82-85 as washed-out institutional positioning and intact sixth-year deficit provide upside fuel Timeframe: 2-4 weeks through April 29-30 FOMC if geopolitical tensions remain calm and inflation data cooperates
|
Silver stands at a critical inflection point on April 12, 2026, trading at $76.26 after surging +4.96% this week (Monday open $72.93 to Friday close $76.545) in response to the Iran war ceasefire announcement that triggered sharp oil price declines and eased immediate geopolitical risk premiums. Post-input development identified: The U.S.-Iran ceasefire represents a material shift NOT fully reflected in the discipline agent inputs collected April 12 before this news broke—Trading Economics reports silver held above $75 on Friday and was on track for a third straight weekly advance as the ceasefire prompted a sharp drop in oil prices and eased fears of sustained inflation acceleration.
This creates a paradoxical macro regime classification of TRANSITIONAL RISK-OFF UNWINDING: VIX at 19-24 (below 25 panic threshold but above 15 complacency) signals moderate fear subsiding, the Iran war ceasefire reduces geopolitical safe-haven demand that had supported precious metals during the conflict escalation, yet paradoxically the March 10 CPI inflation shock at 3.3% YoY (up sharply from 2.4% in February representing the highest since May 2024) driven by energy disruption continues to support real assets even as the immediate catalyst resolves. The critical market intelligence is that silver's +4.96% weekly surge from $72.93 to $76.545 occurred AFTER the discipline agents' data collection, representing a genuine repricing event driven by geopolitical risk premium unwinding combined with positioning relief.
From today's vantage point on April 12, the fundamental backdrop remains constructively unchanged despite the geopolitical volatility: silver is in its sixth consecutive year of structural deficit with a 67M oz shortfall per the Silver Institute's February 2026 report, with industrial demand consuming a record 59% of total supply from solar, EV, and AI infrastructure while mine production grows only 2% annually to 820M oz. China's export licensing restrictions controlling 60-70% of global tradeable supply operational since January 1 add permanent supply weaponization dynamics.
However, these medium-term structural positives are currently overwhelmed by near-term monetary policy uncertainty: the March 10 CPI release showing 3.3% inflation creates a hawkish bias for the Fed's April 29-30 FOMC meeting 17 days away, with 10Y TIPS real yields at 2.10% creating mathematical headwind for non-yielding silver. The technical structure shows constructive stabilization behavior: silver successfully defended the $70-73 support zone at March 29 low of $69.77 and has now recovered to $76.26, representing healthy consolidation after the violent March 18-29 selloff that saw prices plunge from the $81-84 range.
The 50-day MA at $87 represents 14% overhead resistance, a meaningful but not insurmountable gap. RSI at 63 indicates healthy bullish momentum without overbought extremes. The sentiment picture has evolved materially: the Sentiment Agent's data showing VIX at 23.87 as of April 3 has now declined to 19.23 on April 10 per Yahoo Finance, indicating fear subsiding as the Iran ceasefire resolves the acute geopolitical crisis. Retail positioning remains heavily long (85-90% per mid-March data) but is not at terminal capitulation, while institutional positioning tells the opposite story—Managed Money net long at 24k contracts represents near 2-year lows after January-March washout, suggesting speculative interest thoroughly cleansed.
This creates asymmetric potential: further downside from forced liquidation is limited, but upside requires a catalyst. From a bias integrity perspective, last week's NO CALL at conviction 5 was MISSED as price moved +4.96% from $72.93 to $76.545, exceeding expectations and marking 1 consecutive miss. Current consecutive same-direction bias streak: 2 weeks NO CALL. Miss streak: 1 consecutive. Bias Review Rule NOT triggered (2 weeks well below 8-week threshold). Miss Reset Rule NOT triggered (1 miss versus 4-miss threshold).
Applying Rule 4 Thesis Health Score: not applicable as I am not continuing a directional bias but rather shifting from NO CALL to BULLISH lean. The prudent directional lean is BULLISH with TEMPERED conviction. Starting conviction 7 (bullish lean based on Iran ceasefire geopolitical risk unwinding, successful $70 support defense, sixth-year structural deficit, and washed-out institutional positioning) minus Rule 3 penalties: -1 for last call MISSED (April 10 NO CALL), -0 for macro regime (bullish bias neither clearly aligns nor opposes transitional regime with mixed signals), -0 for volatility (elevated but not extreme) = conviction 6.
The probable weekly move estimation suggests $74-80 range representing 5-8% potential swing well above the 0.30% Noise Floor, making directional calls meaningful. April seasonality is historically mixed for silver with slight negative bias (BullionVault notes tendency to decline in April persisting until June in 2009-2018 data), but this is offset by the Iran ceasefire creating a specific catalyst for risk premium unwinding. Devil's advocate: the March CPI inflation shock at 3.3% may force the Fed to maintain hawkish stance at April 29-30 FOMC sustaining real yields above 2.0% and preventing meaningful dollar weakness, limiting silver upside to $78-80 range and risking breakdown if Fed signals no 2026 cuts.
| Week | Bias | Confidence | Result |
|---|---|---|---|
| April 10, 2026 | NO CALL | 5/10 | ➖ |
| April 3, 2026 | NO CALL | 5/10 | ➖ |
| March 27, 2026 | BEARISH | 6/10 | ❌ |
| March 20, 2026 | NO CALL | 5/10 | ➖ |
| March 14, 2026 | NO CALL | 5/10 | ➖ |
| March 6, 2026 | BULLISH | 7/10 | ❌ |
| February 27, 2026 | BULLISH | 7/10 | ✅ |
| February 21, 2026 | BULLISH | 7/10 | ✅ |
| February 13, 2026 | BULLISH | 7/10 | ✅ |
| February 8, 2026 | BULLISH | 7/10 | ✅ |
| February 1, 2026 | BULLISH | 7/10 | ❌ |
| January 25, 2026 | BULLISH | 8/10 | ❌ |
📋 PROMPT-READY CONTEXT
Copy this entire block into any AI chat for follow-up analysis
▼ Expand
MACRO AGENT DESK — WEEKLY INTELLIGENCE BRIEFING
═════════════════════════════════════════════════
Asset: Silver (SI)
Report Date: April 12, 2026

── DIRECTIONAL BIAS ─────────────────────────────
Call: NO CALL
Confidence: 6/10
Signal: NO DIRECTIONAL CALL THIS WEEK
MAD Index: 48 (SLIGHT DIVERGENCE)

── MARKET CONTEXT ───────────────────────────────
State: CONSOLIDATING
Regime: TRANSITIONAL CONSOLIDATION FOLLOWING GEOPOLITICAL SHOCK RESOLUTION
Sentiment: NEUTRAL

── WHAT THE MARKET SEES ─────────────────────────
Market consensus fractured between structural bulls targeting $80-90 recovery by Q2 on intact deficit fundamentals and cautious neutrals awaiting April 29 Fed clarity, CoinCodex algorithm predicting +1.07% to $77.04 by April 16 suggests modest bullish lean emerging

── WHAT THE MARKET IS MISSING ───────────────────
Market treating Iran ceasefire as simple geopolitical risk-off signal weakening safe-haven demand, while desk recognizes the ceasefire resolves the primary driver of March CPI inflation shock (energy disruption) creating path for April inflation data to moderate and Fed dovish pivot at April 29 FOMC—sixth-year deficit with 59% industrial demand and washed-out institutional positioning at 24k contracts near 2-year lows creates asymmetric upside potential if monetary policy headwinds ease, though binary FOMC risk 17 days away caps conviction at 6

── KEY DRIVERS ──────────────────────────────────
1. Iran war ceasefire announcement reducing geopolitical risk premium triggered sharp oil price decline and easing inflation fears, creating paradox where safe-haven demand weakens but dollar strength from March CPI inflation shock (3.3% vs 2.4% prior) creates competing cross-current on precious metals
2. Sixth consecutive year of 67M oz structural deficit with industrial demand consuming record 59% of supply from solar/EV/AI sectors remains fundamentally intact despite near-term price volatility driven by monetary policy headwinds and geopolitical uncertainty resolution
3. Managed money positioning at historically washed-out levels near 24k contracts after January-March liquidation cascade combined with SLV outflows decelerating creates positioning asymmetry where downside from forced liquidation limited but upside requires catalyst

── KEY ZONES ────────────────────────────────────
Resistance 2: 80.50 – 83.50
Resistance 1: 77.00 – 80.00
Pivot: ~76.26
Support 1: 72.50 – 75.50
Support 2: 68.50 – 71.50

── DISCIPLINE BIASES ────────────────────────────
Technical: BULLISH
Fundamental: BULLISH
Institutional: BULLISH
Options: NO CALL
Economic: BEARISH
Sentiment: NO CALL

── TECHNICAL STRUCTURE ──────────────────────────
Consolidating in $74-78 range after recovering from March 29 low of $69.77, price at $76.26 trading well above 200-day MA at $57 but 14% below 50-day MA at $87, RSI at 63 indicates healthy momentum without overbought conditions

── FUNDAMENTAL ASSESSMENT ───────────────────────
Sixth consecutive year of 67M oz structural deficit with 59% industrial demand unchanged, supply inelastic at 820M oz mine production, China export restrictions controlling 60-70% supply operational since January 1 creating medium-term floor despite short-term monetary policy headwinds

── INSTITUTIONAL POSITIONING ────────────────────
Managed money net long at 24k contracts near 2-year lows after January-March liquidation, SLV outflows decelerating from -9.32% peak but continuing, positioning reset creates asymmetric potential if catalyst emerges

── OPTIONS FLOW ─────────────────────────────────
Implied volatility elevated but insufficient current directional data, extreme volatility regime persisting creates wide daily ranges of 5-7% versus normal 2-3% requiring wider risk management parameters

── ECONOMIC BACKDROP ────────────────────────────
Fed March 18 hawkish hold at 3.50-3.75% with ONE 2026 cut guidance drove real yields to 2.10%, March CPI released April 10 showed 3.3% YoY inflation spike from Iran war energy shock, next FOMC April 29 represents binary catalyst 17 days away

── VOLATILITY REGIME ────────────────────────────
Regime: HIGH
Percentile: 82nd
Trend: Stable —
Days in Regime: 55
Term Structure: Inverted - short-term volatility at 50% remains elevated above long-term 48% reflecting acute post-March 18 FOMC shock with 5-7% daily ranges versus normal 2-3% as market digests hawkish Fed policy, Iran war resolution, and tests $74-78 consolidation zone stability
Historical Pattern: When volatility exceeds 80th percentile during Fed hawkish surprises combined with geopolitical shocks at oversold technical levels, historical pattern shows either consolidation with volatility compression if no additional catalysts occur (60% probability) or sharp directional resolution on binary Fed event (40% probability)—current trajectory at $76.26 with April 29 FOMC approaching favors consolidation with upward bias
Outlook: High volatility at 82nd percentile following Fed policy shock and geopolitical events typically persists 10-20 days before moderation toward 75th percentile begins; current regime day 55 suggests elevated volatility may persist through April 29 FOMC binary event before normalization
Trading Context: High volatility at 82nd percentile requires stops 12-18% below entry versus normal 4-6% with daily ranges now 5-7% versus typical 2-3%, making intraday swings volatile but directional conviction viable; breakout above $78.50 becomes reliable continuation signal toward $82-85 if sustained, while breakdown below $74 accelerates correction risk to $70-72
Vol Risk/Opportunity: High volatility regime at 82nd percentile creates potential for 8-15% total move from current $76.26 level toward either $88-90 if April 29 FOMC dovish (15% upside) or $65-70 if Fed remains hawkish and geopolitical tensions re-escalate (9-14% downside); asymmetry slightly favors upside given washed-out institutional positioning at 24k contracts near 2-year lows and intact sixth-year structural deficit providing fundamental floor above $70

── PRIMARY RISK ─────────────────────────────────
Fed April 29-30 FOMC reinforces hawkish stance interpreting March 3.3% CPI as sustained inflation reacceleration rather than transitory energy shock, sustaining real yields above 2.0% and DXY above 105, triggering breakdown below $74 toward $70 support as remaining long positioning forced to capitulate
Probability: MEDIUM

── PRIMARY OPPORTUNITY ──────────────────────────
Iran war ceasefire holds and April CPI (released mid-month) shows inflation moderation as energy prices normalize, allowing Fed at April 29-30 FOMC to acknowledge March spike as transitory, weakening dollar below DXY 102 and driving real yields below 1.90%, enabling recovery toward $82-85 as washed-out institutional positioning and intact sixth-year deficit provide upside fuel
Timeframe: 2-4 weeks through April 29-30 FOMC if geopolitical tensions remain calm and inflation data cooperates

── NEXT CATALYST ────────────────────────────────
Date: April 29, 2026
Event: Federal Reserve April 29-30 FOMC meeting expected to hold rates unchanged at 3.50-3.75% with focus on forward guidance for remainder of 2026 and whether Fed acknowledges March inflation spike as transitory energy shock or sustained reacceleration
Expected Impact: HIGH

═════════════════════════════════════════════════
Source: Macro Agent Desk (macroagentdesk.com)
═════════════════════════════════════════════════

── FULL ANALYSIS ────────────────────────────────
Silver stands at a critical inflection point on April 12, 2026, trading at $76.26 after surging +4.96% this week (Monday open $72.93 to Friday close $76.545) in response to the Iran war ceasefire announcement that triggered sharp oil price declines and eased immediate geopolitical risk premiums. Post-input development identified: The U.S.-Iran ceasefire represents a material shift NOT fully reflected in the discipline agent inputs collected April 12 before this news broke—Trading Economics reports silver held above $75 on Friday and was on track for a third straight weekly advance as the ceasefire prompted a sharp drop in oil prices and eased fears of sustained inflation acceleration. This creates a paradoxical macro regime classification of TRANSITIONAL RISK-OFF UNWINDING: VIX at 19-24 (below 25 panic threshold but above 15 complacency) signals moderate fear subsiding, the Iran war ceasefire reduces geopolitical safe-haven demand that had supported precious metals during the conflict escalation, yet paradoxically the March 10 CPI inflation shock at 3.3% YoY (up sharply from 2.4% in February representing the highest since May 2024) driven by energy disruption continues to support real assets even as the immediate catalyst resolves. The critical market intelligence is that silver's +4.96% weekly surge from $72.93 to $76.545 occurred AFTER the discipline agents' data collection, representing a genuine repricing event driven by geopolitical risk premium unwinding combined with positioning relief. From today's vantage point on April 12, the fundamental backdrop remains constructively unchanged despite the geopolitical volatility: silver is in its sixth consecutive year of structural deficit with a 67M oz shortfall per the Silver Institute's February 2026 report, with industrial demand consuming a record 59% of total supply from solar, EV, and AI infrastructure while mine production grows only 2% annually to 820M oz. China's export licensing restrictions controlling 60-70% of global tradeable supply operational since January 1 add permanent supply weaponization dynamics. However, these medium-term structural positives are currently overwhelmed by near-term monetary policy uncertainty: the March 10 CPI release showing 3.3% inflation creates a hawkish bias for the Fed's April 29-30 FOMC meeting 17 days away, with 10Y TIPS real yields at 2.10% creating mathematical headwind for non-yielding silver. The technical structure shows constructive stabilization behavior: silver successfully defended the $70-73 support zone at March 29 low of $69.77 and has now recovered to $76.26, representing healthy consolidation after the violent March 18-29 selloff that saw prices plunge from the $81-84 range. The 50-day MA at $87 represents 14% overhead resistance, a meaningful but not insurmountable gap. RSI at 63 indicates healthy bullish momentum without overbought extremes. The sentiment picture has evolved materially: the Sentiment Agent's data showing VIX at 23.87 as of April 3 has now declined to 19.23 on April 10 per Yahoo Finance, indicating fear subsiding as the Iran ceasefire resolves the acute geopolitical crisis. Retail positioning remains heavily long (85-90% per mid-March data) but is not at terminal capitulation, while institutional positioning tells the opposite story—Managed Money net long at 24k contracts represents near 2-year lows after January-March washout, suggesting speculative interest thoroughly cleansed. This creates asymmetric potential: further downside from forced liquidation is limited, but upside requires a catalyst. From a bias integrity perspective, last week's NO CALL at conviction 5 was MISSED as price moved +4.96% from $72.93 to $76.545, exceeding expectations and marking 1 consecutive miss. Current consecutive same-direction bias streak: 2 weeks NO CALL. Miss streak: 1 consecutive. Bias Review Rule NOT triggered (2 weeks well below 8-week threshold). Miss Reset Rule NOT triggered (1 miss versus 4-miss threshold). Applying Rule 4 Thesis Health Score: not applicable as I am not continuing a directional bias but rather shifting from NO CALL to BULLISH lean. The prudent directional lean is BULLISH with TEMPERED conviction. Starting conviction 7 (bullish lean based on Iran ceasefire geopolitical risk unwinding, successful $70 support defense, sixth-year structural deficit, and washed-out institutional positioning) minus Rule 3 penalties: -1 for last call MISSED (April 10 NO CALL), -0 for macro regime (bullish bias neither clearly aligns nor opposes transitional regime with mixed signals), -0 for volatility (elevated but not extreme) = conviction 6. The probable weekly move estimation suggests $74-80 range representing 5-8% potential swing well above the 0.30% Noise Floor, making directional calls meaningful. April seasonality is historically mixed for silver with slight negative bias (BullionVault notes tendency to decline in April persisting until June in 2009-2018 data), but this is offset by the Iran ceasefire creating a specific catalyst for risk premium unwinding. Devil's advocate: the March CPI inflation shock at 3.3% may force the Fed to maintain hawkish stance at April 29-30 FOMC sustaining real yields above 2.0% and preventing meaningful dollar weakness, limiting silver upside to $78-80 range and risking breakdown if Fed signals no 2026 cuts.


