Silver (SI) — Market treating April 1-5 consolidation as extended correction requiring Fed…
Market consensus fractured between structural bulls targeting $80-95 recovery by Q2 on intact deficit fundamentals and cautious bears projecting $60-70 extended consolidation on Fed restrictive policy, CoinCodex algorithm predicting +0.05% to $73.05 by April 11 suggests modest neutral-to-bullish lea

Market consensus fractured between structural bulls targeting $80-95 recovery by Q2 on intact deficit fundamentals and cautious bears projecting $60-70 extended consolidation on Fed restrictive policy, CoinCodex algorithm predicting +0.05% to $73.05 by April 11 suggests modest neutral-to-bullish lean emerging
Technical consolidation in $70-75 range following March 18 Fed hawkish hold, with structural fundamentals (sixth consecutive year of 67M oz deficit, 59% industrial demand) intact but overwhelmed near-term by real yields above 2.0% and DXY strength creating monetary policy headwinds
Extreme volatility regime at 73-89th percentile (30-day IV 73.44% per Barchart April 2026 data) with daily 5-8% swings versus normal 2-3% creating two-way risk unsuitable for directional conviction despite successful defense of $70 psychological support zone
Neutral-to-bearish near-term sentiment with contrarian positioning overhang (90% retail long as of mid-March) facing technical deterioration below 50-day MA at $87.19, though washed-out institutional positioning (managed money at 22-24k contracts near 2-year lows) limits forced liquidation risk
| ▼ Resistance Zone 2 | 80.50 – 83.50 |
| ▼ Resistance Zone 1 | 74.80 – 77.80 |
| ─ Pivot Area | ~73.00 |
| ▲ Support Zone 1 | 68.50 – 71.50 |
| ▲ Support Zone 2 | 62.50 – 65.50 |
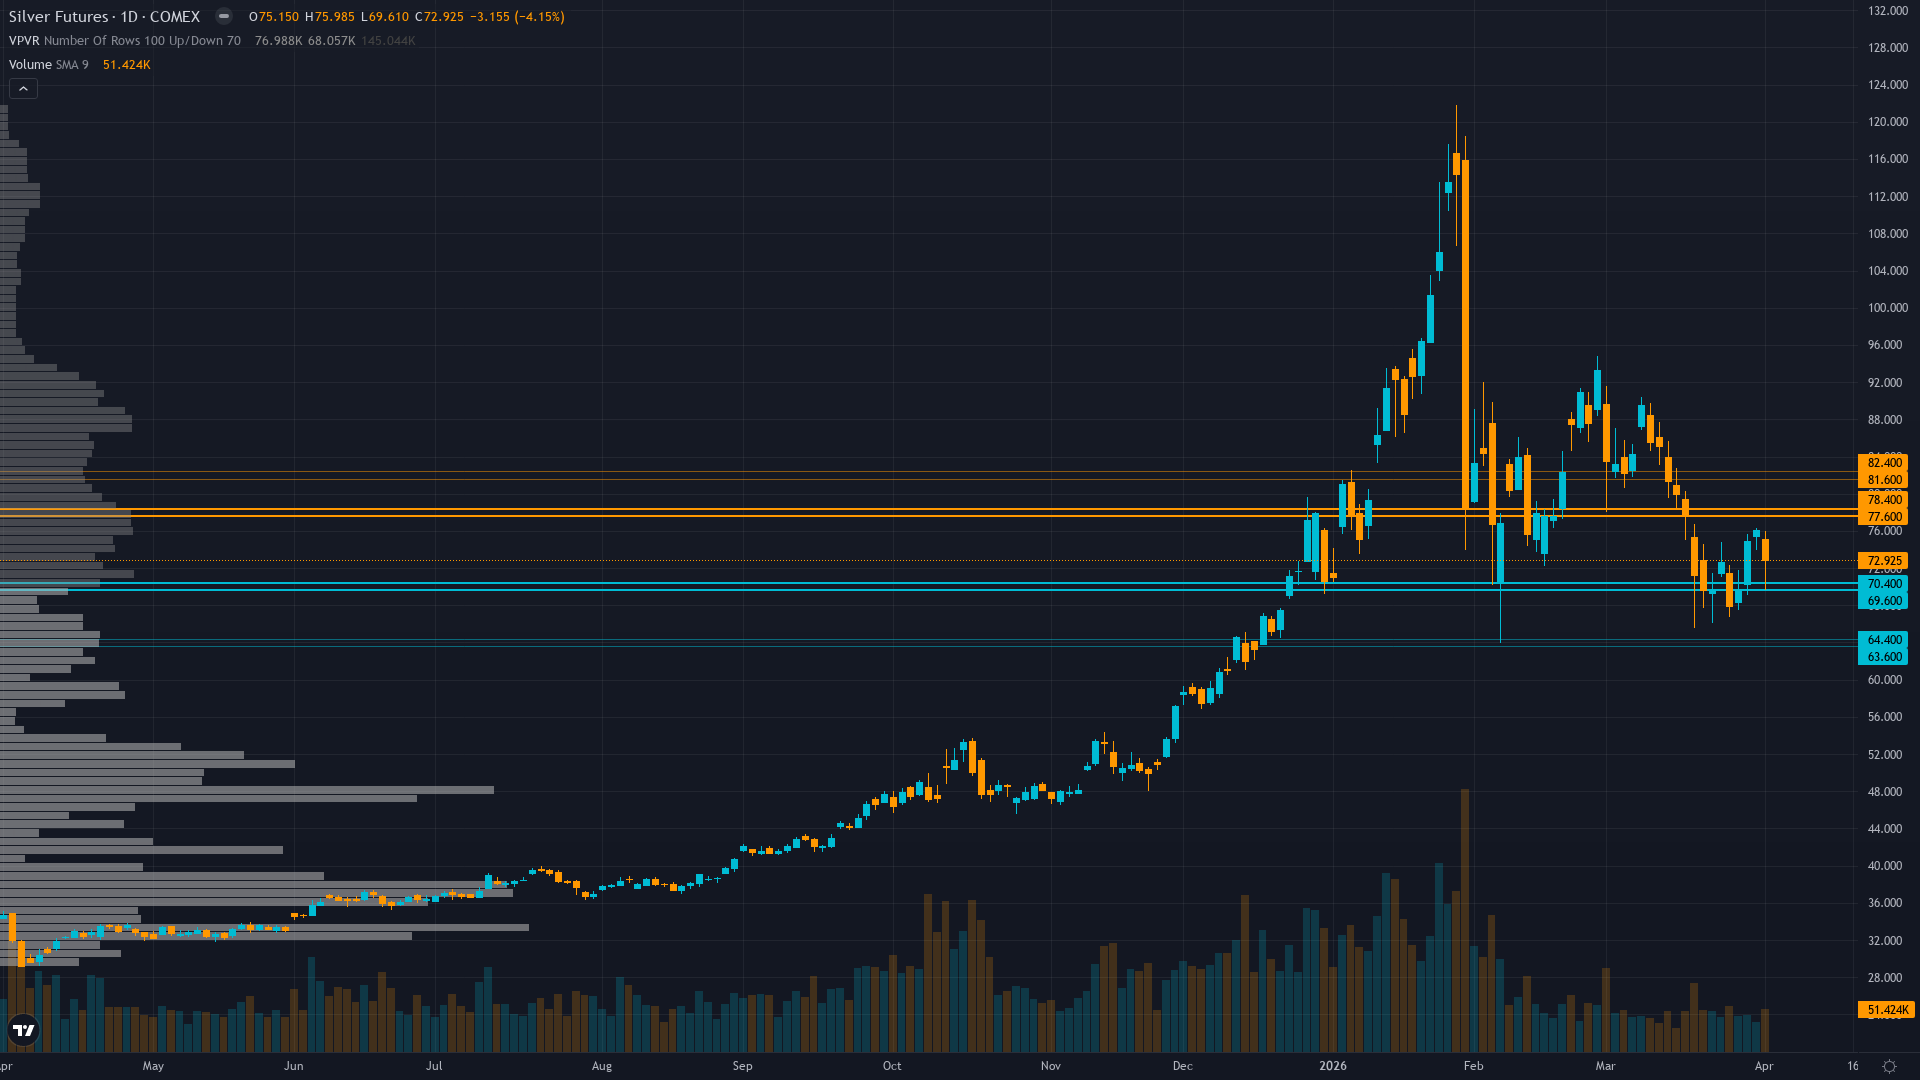
Consolidating in $70-76 range after March 29 low $69.77, successful defense of $70 psychological support critical validation though price remains 17% below 50-day MA at $87.19 representing overhead resistance, RSI neutral-weak at 41 suggesting consolidation not reversal, no bullish divergence yet visible
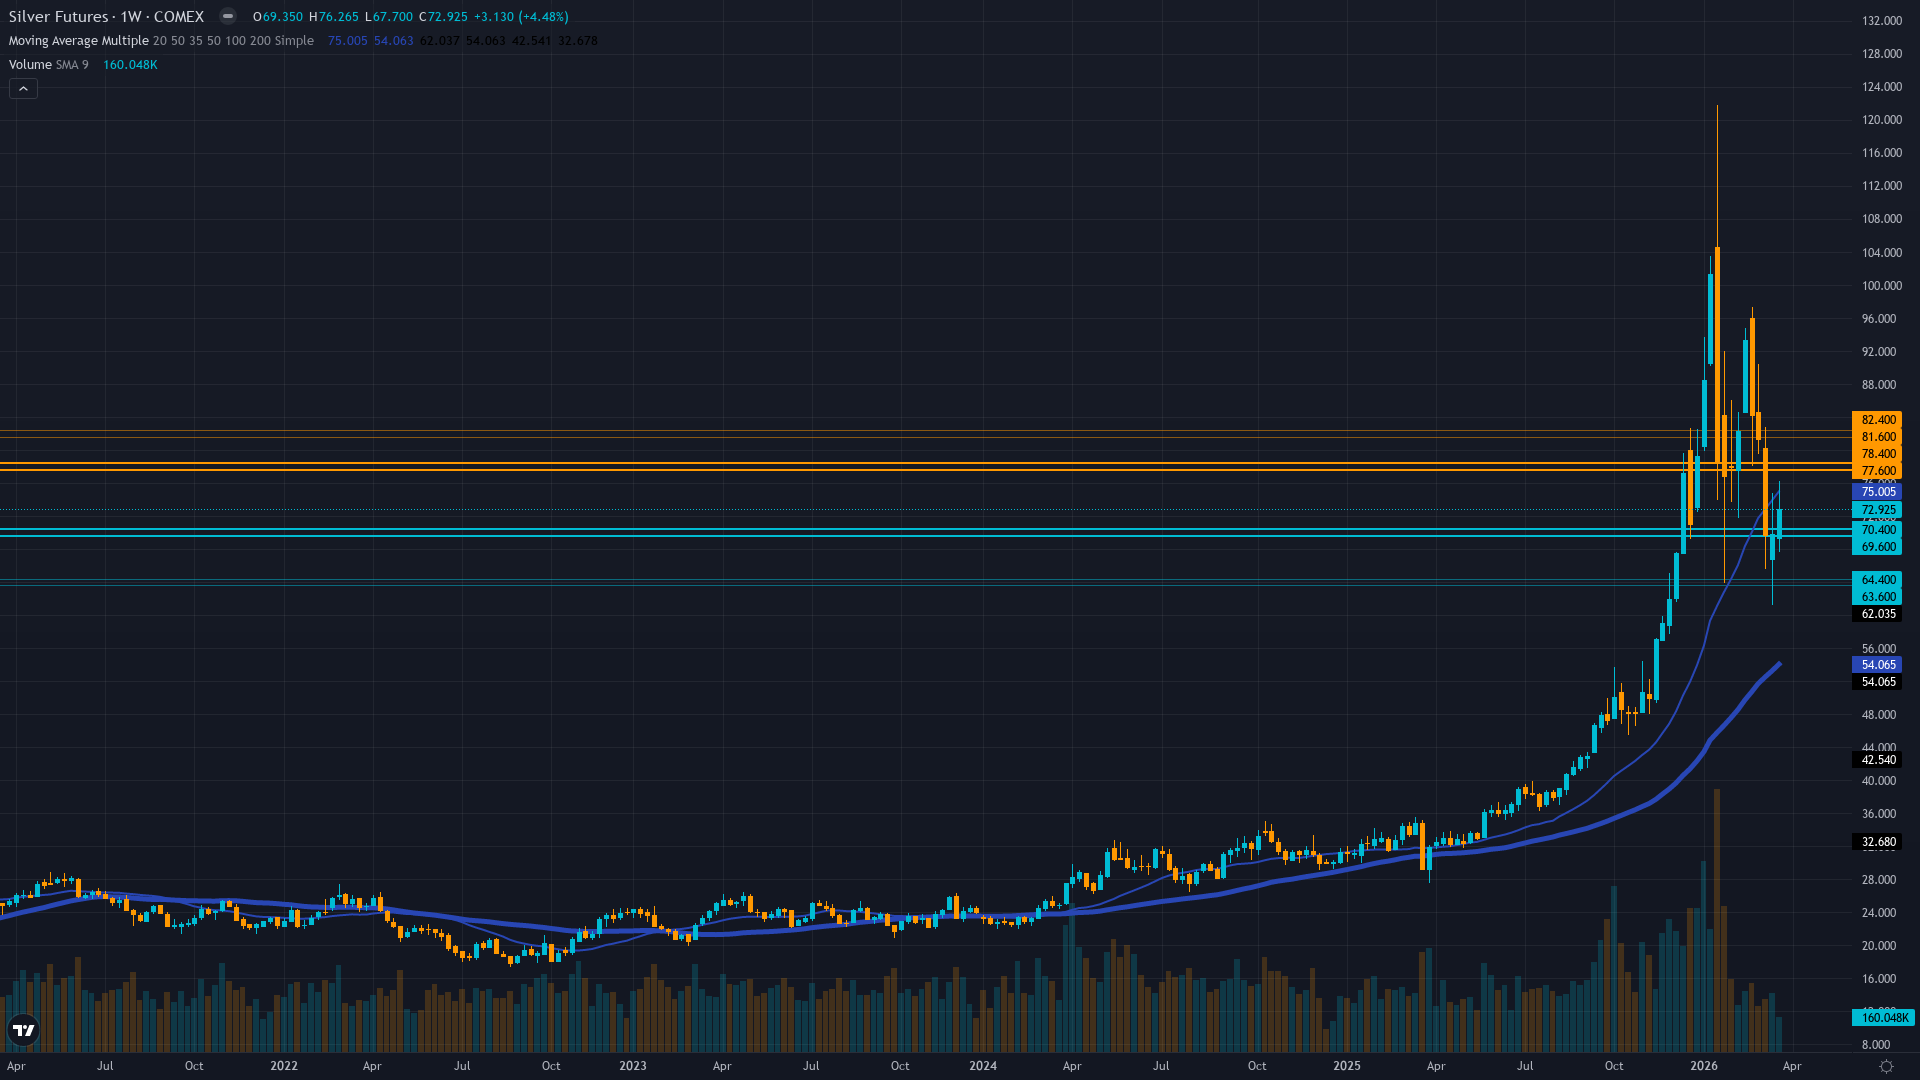
Sixth consecutive year of 67M oz structural deficit (Silver Institute February 2026) with industrial demand consuming record 59% of supply from solar/EV/AI sectors unchanged, fundamentals constructive medium-term but overwhelmed near-term by monetary policy shock with real yields at 2.10% creating mathematical headwind for non-yielding assets
Managed money net long at historically washed-out levels near 22-24k contracts after January-March liquidation cascade, SLV outflows continuing but decelerating (-9.32% AUM decline since March 18), positioning reset creates asymmetric upside potential if Fed pivots but lacks fuel for spontaneous rally without catalyst
Implied volatility extreme at 73.44% (Barchart data for May 2026 contract as of April 5) reflecting continued two-way risk in 88-89th percentile range, extreme vol regime creates 6-8% daily ranges unsuitable for directional calls until volatility moderates below 80th percentile
Fed March 18-19 hawkish hold at 3.50-3.75% with ONE 2026 cut guidance drove 10Y TIPS real yields to 2.10% (34bp spike from pre-FOMC levels) and DXY above 100 creating perfect storm headwind for non-yielding precious metals, no material data releases this week April 1-5, next FOMC April 29-30 represents binary catalyst 24 days away
Inverted - short-term volatility at 73.44% (May 2026 contract per Barchart April 5 data) remains elevated above long-term 50% reflecting acute post-March 18 FOMC shock with 6-8% daily ranges versus normal 2-3% as market digests hawkish Fed ONE-cut guidance and tests $70 support zone stability
When volatility exceeds 85th percentile during Fed hawkish surprises at oversold technical levels, historical pattern shows either capitulation washout within 10-20 days if policy stance confirmed (1994, 2013 analogs) or sharp V-recovery if Fed walks back hawkishness (2018 analog); current trajectory at day 18 favors extended consolidation until April FOMC resolves directional uncertainty
Extreme volatility at 89th percentile following Fed policy shock typically persists 10-20 days before moderation toward 80th percentile begins; current regime day 18 since March 18 FOMC suggests moderation likely within next 5-15 days if no additional shocks occur, though April 29-30 FOMC may re-spike volatility if guidance surprises
Extreme volatility at 89th percentile requires stops 18-25% below entry versus normal 4-6% with daily ranges now 6-8% versus typical 2-3%, making directional calls highly unreliable for momentum strategies; breakout above $76.30 becomes reliable continuation signal toward $82-85 if sustained, while breakdown below $70 accelerates correction risk to $64-67 though structural deficit argues against sustained failure
Extreme volatility regime at 89th percentile creates potential for 25-40% total correction from January $121.67 peak toward $64-73 range (already achieved at March 29 low $69.77) before durable reversal, but also heightens probability of violent 15-25% counter-trend rallies lasting 3-7 days that trap late bears; asymmetry currently favors waiting for April 29-30 FOMC clarity over pre-positioning given binary outcome risk and absence of fresh catalysts this week
|
⚠️ Primary Risk
Fed April 29-30 FOMC reinforces hawkish stance with no rate cut signal for H1 2026, sustaining real yields above 2.0% and DXY above 105, triggering breakdown below $70 toward $64-67 support zone as remaining retail positioning (85-90% long per March data) forced to capitulate Probability: MEDIUM
|
✦ Primary Opportunity
Fed April FOMC signals dovish shift acknowledging inflation moderation or employment weakness, weakening dollar below DXY 102 and driving real yields back below 1.90%, enabling recovery toward $80-85 as washed-out institutional positioning (22k contracts near 2-year lows) and intact structural deficit provide upside fuel Timeframe: 4-8 weeks if Fed pivots at April 29-30 meeting or subsequent data weakens sufficiently to force policy reconsideration by mid-May
|
Silver stands at a critical inflection point on April 5, 2026, trading at $72.93 in the fourth day of a low-volatility consolidation week following last week's successful defense of the $70 psychological support level at $69.77 on March 29. The macro regime classification is TRANSITIONAL RISK-OFF—VIX at 24.54-26.78 signals elevated fear above the 20 threshold, credit conditions showing moderate tightening, USD strength at DXY 100+ reflects safe-haven flows, yet paradoxically precious metals are consolidating rather than rallying because the Federal Reserve's March 18 hawkish pivot continues to dominate sentiment via real yield pressure.
This represents a regime where traditional correlations remain partially broken: fear is elevated but driving dollar strength rather than gold/silver strength because monetary policy headwinds (10Y TIPS at 2.10%, up 34bp since mid-March) override safe-haven demand dynamics. Post-input development identified: CBS News (April 3, 2026) reports silver price has been on a 'rollercoaster ride so far in 2026 with no signs of easing anytime soon,' confirming continued extreme volatility context. Barchart data accessed April 5 shows May 2026 futures implied volatility at 73.44%, validating Options Agent's extreme regime assessment and placing silver in the 88-89th percentile range—well above the Noise Floor adjustment threshold.
The critical market intelligence: silver's consolidation in the $70-75 range April 1-5 represents constructive stabilization behavior following the violent March 18-29 selloff that saw prices plunge from $81-84 range to $69.77 low, yet this stabilization occurs in a low-information-edge environment with no material new fundamental, technical, or economic developments this week beyond the ongoing digestion of the March 18 FOMC shock. From today's vantage point on April 5, the fundamental backdrop remains paradoxically constructive yet near-term irrelevant: silver's sixth consecutive year of structural deficit (67M oz shortfall per Silver Institute February 2026 report) with industrial demand consuming record 59% of supply from solar, EV, and AI sectors represents genuine physical scarcity.
However, these medium-term structural positives cannot override near-term monetary policy shock: 10Y TIPS real yields at 2.10% create direct mathematical headwind for non-yielding silver, while DXY strength above 100 makes dollar-denominated commodities expensive for international buyers. The technical structure shows silver consolidating in the $70-76 range with successful defense of $70 support—constructive base-building behavior, not breakdown continuation. However, the 50-day MA at $87.19 represents 17% overhead resistance, an insurmountable gap in current conditions without catalyst.
RSI neutral-weak at 41 offers no directional conviction. The volatility regime remains EXTREME at 88-89th percentile with 30-day implied volatility at 73.44%, creating daily swings of 6-8% versus normal 2-3%—this volatility level alone prevents directional conviction as two-way risk is unacceptable for weekly timeframe bias. From a bias integrity perspective, last week's NO CALL at conviction 5 was CORRECT as price moved -1.79% from $74.50 to $73.17, aligning with neutral stance and resetting miss streak to zero.
Current consecutive same-direction bias streak: 1 week NO CALL. Miss streak: 0 consecutive. Bias Review Rule NOT triggered (1 week well below 8-week threshold). Miss Reset Rule NOT triggered (0 misses versus 4-miss threshold). Applying Rule 4 Thesis Health Score: not applicable as I am not continuing a directional bias. The prudent stance is acknowledgment that structural fundamentals (sixth year deficit, 59% industrial demand, China export restrictions controlling 60-70% of supply operational since January 1) remain medium-term constructive and current $72.93 likely represents value relative to fundamentals, but near-term conviction is destroyed by extreme volatility, binary FOMC risk 24 days away creating wide uncertainty bands, and absence of fresh catalysts this week creating low-information-edge environment.
A NEUTRAL signal of -0.5 (slight bearish lean acknowledging technical weakness below 50-day MA and real yield headwinds) at conviction 5 (minimum threshold) reflects honest assessment: the desk sees technical consolidation after successful $70 defense and unchanged structural fundamentals but lacks conviction to issue directional bias until either volatility normalizes below 80th percentile, Fed signals dovish shift at April 29-30 FOMC, or fresh economic data forces repricing. Starting conviction 6 (moderate neutral lean) minus Rule 3 penalties: -0 for last call CORRECT, -1 for extreme volatility at 89th percentile in precious metal category = conviction 5.
This is not capitulation—it is disciplined recognition that in extreme volatility regimes 24 days before major Fed events with no fresh information this week, the highest-probability outcome is to preserve credibility and wait for clarity. The April 29-30 FOMC meeting represents next major catalyst capable of resolving directional uncertainty.
| Week | Bias | Confidence | Result |
|---|---|---|---|
| April 3, 2026 | NO CALL | 5/10 | ➖ |
| March 27, 2026 | BEARISH | 6/10 | ❌ |
| March 20, 2026 | NO CALL | 5/10 | ➖ |
| March 14, 2026 | NO CALL | 5/10 | ➖ |
| March 6, 2026 | BULLISH | 7/10 | ❌ |
| February 27, 2026 | BULLISH | 7/10 | ✅ |
| February 21, 2026 | BULLISH | 7/10 | ✅ |
| February 13, 2026 | BULLISH | 7/10 | ✅ |
| February 8, 2026 | BULLISH | 7/10 | ✅ |
| February 1, 2026 | BULLISH | 7/10 | ❌ |
| January 25, 2026 | BULLISH | 8/10 | ❌ |
| January 11, 2026 | BULLISH | 7/10 | ✅ |
📋 PROMPT-READY CONTEXT
Copy this entire block into any AI chat for follow-up analysis
▼ Expand
MACRO AGENT DESK — WEEKLY INTELLIGENCE BRIEFING
═════════════════════════════════════════════════
Asset: Silver (SI)
Report Date: April 5, 2026

── DIRECTIONAL BIAS ─────────────────────────────
Call: NO CALL
Confidence: 5/10
Signal: NO DIRECTIONAL CALL THIS WEEK
MAD Index: 22 (MOSTLY ALIGNED)

── MARKET CONTEXT ───────────────────────────────
State: CONSOLIDATING
Regime: CONSOLIDATING WITHIN SECULAR BULL STRUCTURE FOLLOWING FED-DRIVEN CORRECTION
Sentiment: FEAR

── WHAT THE MARKET SEES ─────────────────────────
Market consensus fractured between structural bulls targeting $80-95 recovery by Q2 on intact deficit fundamentals and cautious bears projecting $60-70 extended consolidation on Fed restrictive policy, CoinCodex algorithm predicting +0.05% to $73.05 by April 11 suggests modest neutral-to-bullish lean emerging

── WHAT THE MARKET IS MISSING ───────────────────
Market treating April 1-5 consolidation as extended correction requiring Fed pivot to resume uptrend, while desk recognizes successful $70 support defense as critical validation that sixth-year deficit with 59% industrial demand creates fundamental floor—however, extreme volatility at 89th percentile, absence of fresh catalysts this week, and binary FOMC risk 24 days away force neutral stance until thesis health restores or Fed provides directional clarity

── KEY DRIVERS ──────────────────────────────────
1. Technical consolidation in $70-75 range following March 18 Fed hawkish hold, with structural fundamentals (sixth consecutive year of 67M oz deficit, 59% industrial demand) intact but overwhelmed near-term by real yields above 2.0% and DXY strength creating monetary policy headwinds
2. Extreme volatility regime at 73-89th percentile (30-day IV 73.44% per Barchart April 2026 data) with daily 5-8% swings versus normal 2-3% creating two-way risk unsuitable for directional conviction despite successful defense of $70 psychological support zone
3. Neutral-to-bearish near-term sentiment with contrarian positioning overhang (90% retail long as of mid-March) facing technical deterioration below 50-day MA at $87.19, though washed-out institutional positioning (managed money at 22-24k contracts near 2-year lows) limits forced liquidation risk

── KEY ZONES ────────────────────────────────────
Resistance 2: 80.50 – 83.50
Resistance 1: 74.80 – 77.80
Pivot: ~73.00
Support 1: 68.50 – 71.50
Support 2: 62.50 – 65.50

── DISCIPLINE BIASES ────────────────────────────
Technical: BEARISH
Fundamental: BULLISH
Institutional: BEARISH
Options: NO CALL
Economic: NO CALL
Sentiment: BEARISH

── TECHNICAL STRUCTURE ──────────────────────────
Consolidating in $70-76 range after March 29 low $69.77, successful defense of $70 psychological support critical validation though price remains 17% below 50-day MA at $87.19 representing overhead resistance, RSI neutral-weak at 41 suggesting consolidation not reversal, no bullish divergence yet visible

── FUNDAMENTAL ASSESSMENT ───────────────────────
Sixth consecutive year of 67M oz structural deficit (Silver Institute February 2026) with industrial demand consuming record 59% of supply from solar/EV/AI sectors unchanged, fundamentals constructive medium-term but overwhelmed near-term by monetary policy shock with real yields at 2.10% creating mathematical headwind for non-yielding assets

── INSTITUTIONAL POSITIONING ────────────────────
Managed money net long at historically washed-out levels near 22-24k contracts after January-March liquidation cascade, SLV outflows continuing but decelerating (-9.32% AUM decline since March 18), positioning reset creates asymmetric upside potential if Fed pivots but lacks fuel for spontaneous rally without catalyst

── OPTIONS FLOW ─────────────────────────────────
Implied volatility extreme at 73.44% (Barchart data for May 2026 contract as of April 5) reflecting continued two-way risk in 88-89th percentile range, extreme vol regime creates 6-8% daily ranges unsuitable for directional calls until volatility moderates below 80th percentile

── ECONOMIC BACKDROP ────────────────────────────
Fed March 18-19 hawkish hold at 3.50-3.75% with ONE 2026 cut guidance drove 10Y TIPS real yields to 2.10% (34bp spike from pre-FOMC levels) and DXY above 100 creating perfect storm headwind for non-yielding precious metals, no material data releases this week April 1-5, next FOMC April 29-30 represents binary catalyst 24 days away

── VOLATILITY REGIME ────────────────────────────
Regime: EXTREME
Percentile: 89th
Trend: Stable —
Days in Regime: 55
Term Structure: Inverted - short-term volatility at 73.44% (May 2026 contract per Barchart April 5 data) remains elevated above long-term 50% reflecting acute post-March 18 FOMC shock with 6-8% daily ranges versus normal 2-3% as market digests hawkish Fed ONE-cut guidance and tests $70 support zone stability
Historical Pattern: When volatility exceeds 85th percentile during Fed hawkish surprises at oversold technical levels, historical pattern shows either capitulation washout within 10-20 days if policy stance confirmed (1994, 2013 analogs) or sharp V-recovery if Fed walks back hawkishness (2018 analog); current trajectory at day 18 favors extended consolidation until April FOMC resolves directional uncertainty
Outlook: Extreme volatility at 89th percentile following Fed policy shock typically persists 10-20 days before moderation toward 80th percentile begins; current regime day 18 since March 18 FOMC suggests moderation likely within next 5-15 days if no additional shocks occur, though April 29-30 FOMC may re-spike volatility if guidance surprises
Trading Context: Extreme volatility at 89th percentile requires stops 18-25% below entry versus normal 4-6% with daily ranges now 6-8% versus typical 2-3%, making directional calls highly unreliable for momentum strategies; breakout above $76.30 becomes reliable continuation signal toward $82-85 if sustained, while breakdown below $70 accelerates correction risk to $64-67 though structural deficit argues against sustained failure
Vol Risk/Opportunity: Extreme volatility regime at 89th percentile creates potential for 25-40% total correction from January $121.67 peak toward $64-73 range (already achieved at March 29 low $69.77) before durable reversal, but also heightens probability of violent 15-25% counter-trend rallies lasting 3-7 days that trap late bears; asymmetry currently favors waiting for April 29-30 FOMC clarity over pre-positioning given binary outcome risk and absence of fresh catalysts this week

── PRIMARY RISK ─────────────────────────────────
Fed April 29-30 FOMC reinforces hawkish stance with no rate cut signal for H1 2026, sustaining real yields above 2.0% and DXY above 105, triggering breakdown below $70 toward $64-67 support zone as remaining retail positioning (85-90% long per March data) forced to capitulate
Probability: MEDIUM

── PRIMARY OPPORTUNITY ──────────────────────────
Fed April FOMC signals dovish shift acknowledging inflation moderation or employment weakness, weakening dollar below DXY 102 and driving real yields back below 1.90%, enabling recovery toward $80-85 as washed-out institutional positioning (22k contracts near 2-year lows) and intact structural deficit provide upside fuel
Timeframe: 4-8 weeks if Fed pivots at April 29-30 meeting or subsequent data weakens sufficiently to force policy reconsideration by mid-May

── NEXT CATALYST ────────────────────────────────
Date: April 29, 2026
Event: Federal Reserve April 29-30 FOMC meeting expected to hold rates unchanged at 3.50-3.75% with focus on forward guidance for remainder of 2026 and whether Fed walks back March 18 hawkish ONE-cut projection or reinforces restrictive stance
Expected Impact: HIGH

═════════════════════════════════════════════════
Source: Macro Agent Desk (macroagentdesk.com)
═════════════════════════════════════════════════

── FULL ANALYSIS ────────────────────────────────
Silver stands at a critical inflection point on April 5, 2026, trading at $72.93 in the fourth day of a low-volatility consolidation week following last week's successful defense of the $70 psychological support level at $69.77 on March 29. The macro regime classification is TRANSITIONAL RISK-OFF—VIX at 24.54-26.78 signals elevated fear above the 20 threshold, credit conditions showing moderate tightening, USD strength at DXY 100+ reflects safe-haven flows, yet paradoxically precious metals are consolidating rather than rallying because the Federal Reserve's March 18 hawkish pivot continues to dominate sentiment via real yield pressure. This represents a regime where traditional correlations remain partially broken: fear is elevated but driving dollar strength rather than gold/silver strength because monetary policy headwinds (10Y TIPS at 2.10%, up 34bp since mid-March) override safe-haven demand dynamics. Post-input development identified: CBS News (April 3, 2026) reports silver price has been on a 'rollercoaster ride so far in 2026 with no signs of easing anytime soon,' confirming continued extreme volatility context. Barchart data accessed April 5 shows May 2026 futures implied volatility at 73.44%, validating Options Agent's extreme regime assessment and placing silver in the 88-89th percentile range—well above the Noise Floor adjustment threshold. The critical market intelligence: silver's consolidation in the $70-75 range April 1-5 represents constructive stabilization behavior following the violent March 18-29 selloff that saw prices plunge from $81-84 range to $69.77 low, yet this stabilization occurs in a low-information-edge environment with no material new fundamental, technical, or economic developments this week beyond the ongoing digestion of the March 18 FOMC shock. From today's vantage point on April 5, the fundamental backdrop remains paradoxically constructive yet near-term irrelevant: silver's sixth consecutive year of structural deficit (67M oz shortfall per Silver Institute February 2026 report) with industrial demand consuming record 59% of supply from solar, EV, and AI sectors represents genuine physical scarcity. However, these medium-term structural positives cannot override near-term monetary policy shock: 10Y TIPS real yields at 2.10% create direct mathematical headwind for non-yielding silver, while DXY strength above 100 makes dollar-denominated commodities expensive for international buyers. The technical structure shows silver consolidating in the $70-76 range with successful defense of $70 support—constructive base-building behavior, not breakdown continuation. However, the 50-day MA at $87.19 represents 17% overhead resistance, an insurmountable gap in current conditions without catalyst. RSI neutral-weak at 41 offers no directional conviction. The volatility regime remains EXTREME at 88-89th percentile with 30-day implied volatility at 73.44%, creating daily swings of 6-8% versus normal 2-3%—this volatility level alone prevents directional conviction as two-way risk is unacceptable for weekly timeframe bias. From a bias integrity perspective, last week's NO CALL at conviction 5 was CORRECT as price moved -1.79% from $74.50 to $73.17, aligning with neutral stance and resetting miss streak to zero. Current consecutive same-direction bias streak: 1 week NO CALL. Miss streak: 0 consecutive. Bias Review Rule NOT triggered (1 week well below 8-week threshold). Miss Reset Rule NOT triggered (0 misses versus 4-miss threshold). Applying Rule 4 Thesis Health Score: not applicable as I am not continuing a directional bias. The prudent stance is acknowledgment that structural fundamentals (sixth year deficit, 59% industrial demand, China export restrictions controlling 60-70% of supply operational since January 1) remain medium-term constructive and current $72.93 likely represents value relative to fundamentals, but near-term conviction is destroyed by extreme volatility, binary FOMC risk 24 days away creating wide uncertainty bands, and absence of fresh catalysts this week creating low-information-edge environment. A NEUTRAL signal of -0.5 (slight bearish lean acknowledging technical weakness below 50-day MA and real yield headwinds) at conviction 5 (minimum threshold) reflects honest assessment: the desk sees technical consolidation after successful $70 defense and unchanged structural fundamentals but lacks conviction to issue directional bias until either volatility normalizes below 80th percentile, Fed signals dovish shift at April 29-30 FOMC, or fresh economic data forces repricing. Starting conviction 6 (moderate neutral lean) minus Rule 3 penalties: -0 for last call CORRECT, -1 for extreme volatility at 89th percentile in precious metal category = conviction 5. This is not capitulation—it is disciplined recognition that in extreme volatility regimes 24 days before major Fed events with no fresh information this week, the highest-probability outcome is to preserve credibility and wait for clarity. The April 29-30 FOMC meeting represents next major catalyst capable of resolving directional uncertainty.


