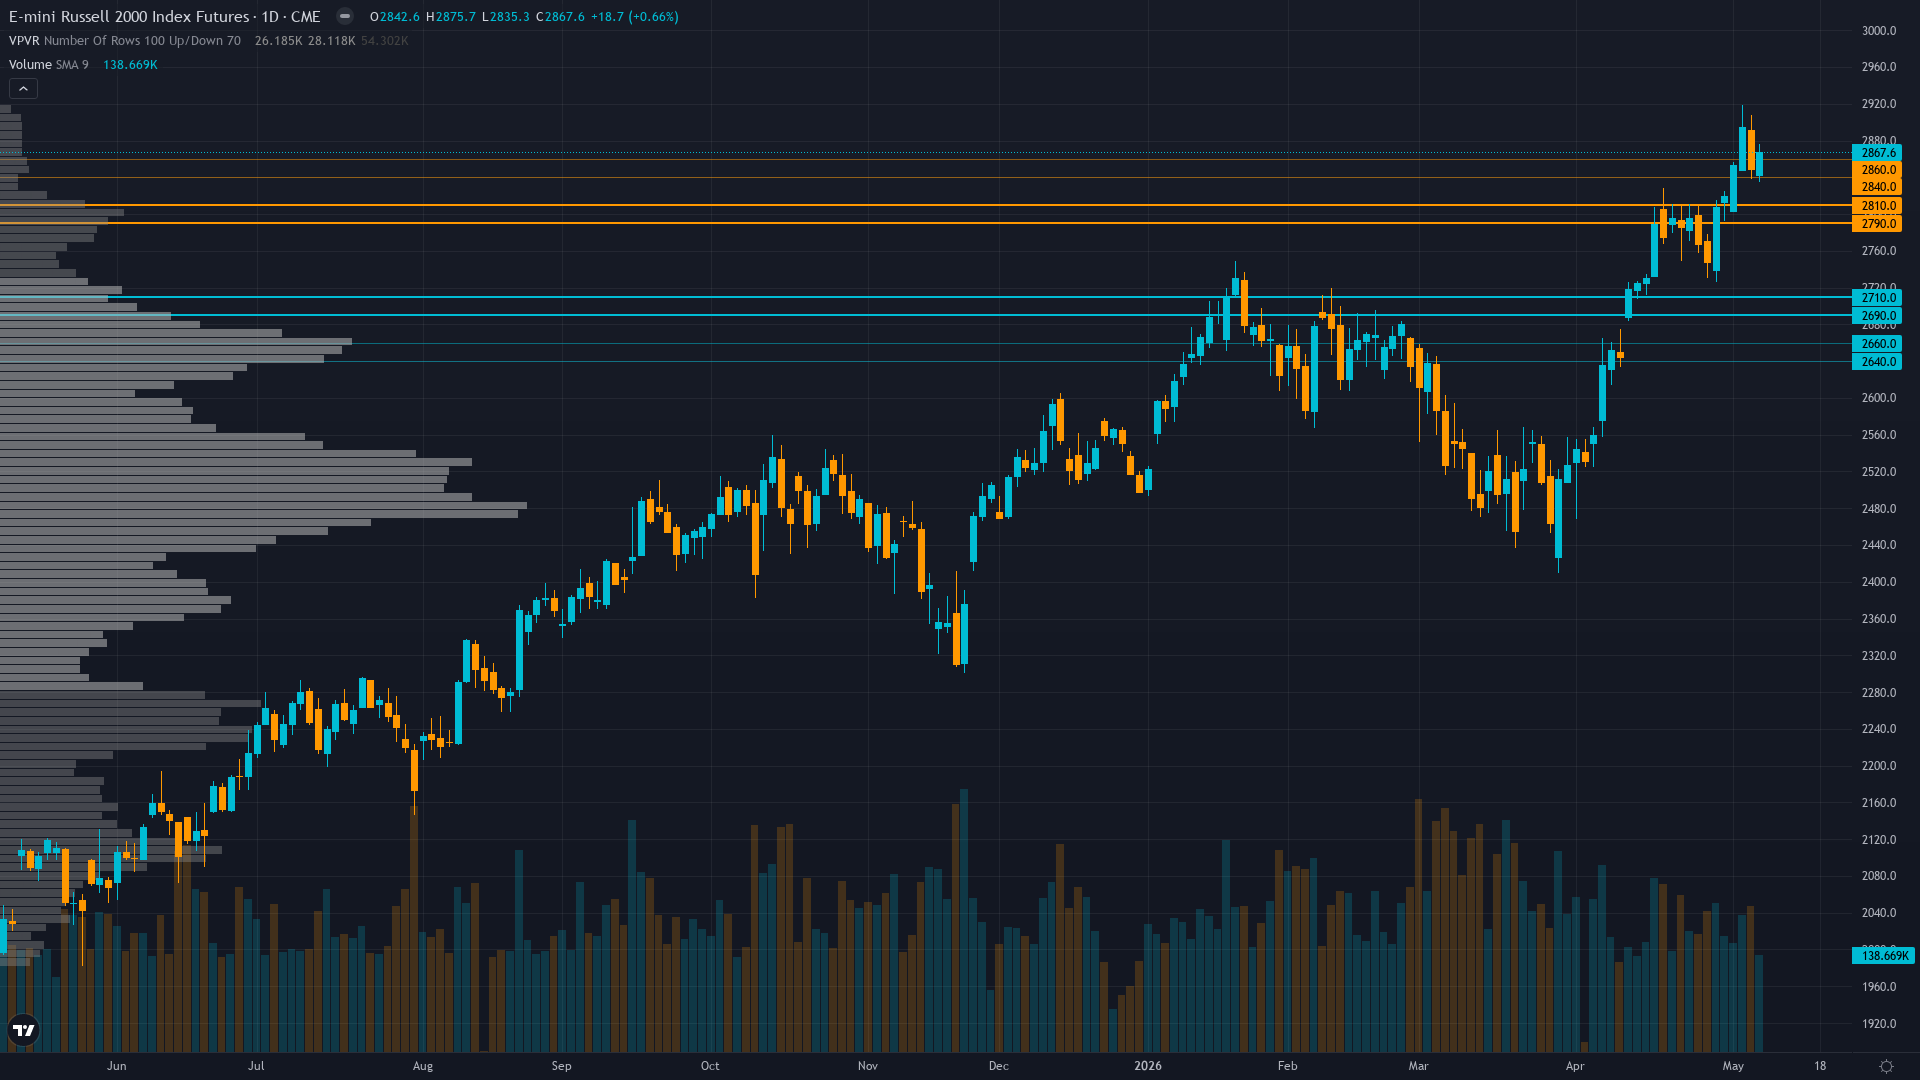
Russell 2000 (RTY) — Fresh all-time high at 2899.30 on May 10, 2026 extending April breakout and…
Small-caps celebrating fresh all-time highs with 'Great Rotation' narrative gaining traction, Q1 earnings providing validation catalyst, bullish technical signals dominant, market positioned for continued outperformance

Small-caps celebrating fresh all-time highs with 'Great Rotation' narrative gaining traction, Q1 earnings providing validation catalyst, bullish technical signals dominant, market positioned for continued outperformance
Fresh all-time high at 2899.30 on May 10, 2026 extending April breakout and validating small-cap rotation narrative with Technical agent showing strong bullish signal (+3.0, conf 7) on decisive uptrend structure
VIX normalization to 17.39 and Fear & Greed Index at 67 (Greed) confirming sustained RISK-ON macro regime creating favorable environment for credit-sensitive small-caps despite April jobs miss headwind
Q1 2026 earnings catalyst delivering 44.9% YoY growth consensus released May 7 providing fundamental validation three days ago, though elevated forward P/E at 25.39 versus historical 13.62-17.34 range creates valuation sensitivity
| ▼ Resistance Zone 2 | 2935 – 2965 |
| ▼ Resistance Zone 1 | 2885 – 2915 |
| ─ Pivot Area | ~2899 |
| ▲ Support Zone 1 | 2820 – 2850 |
| ▲ Support Zone 2 | 2785 – 2815 |
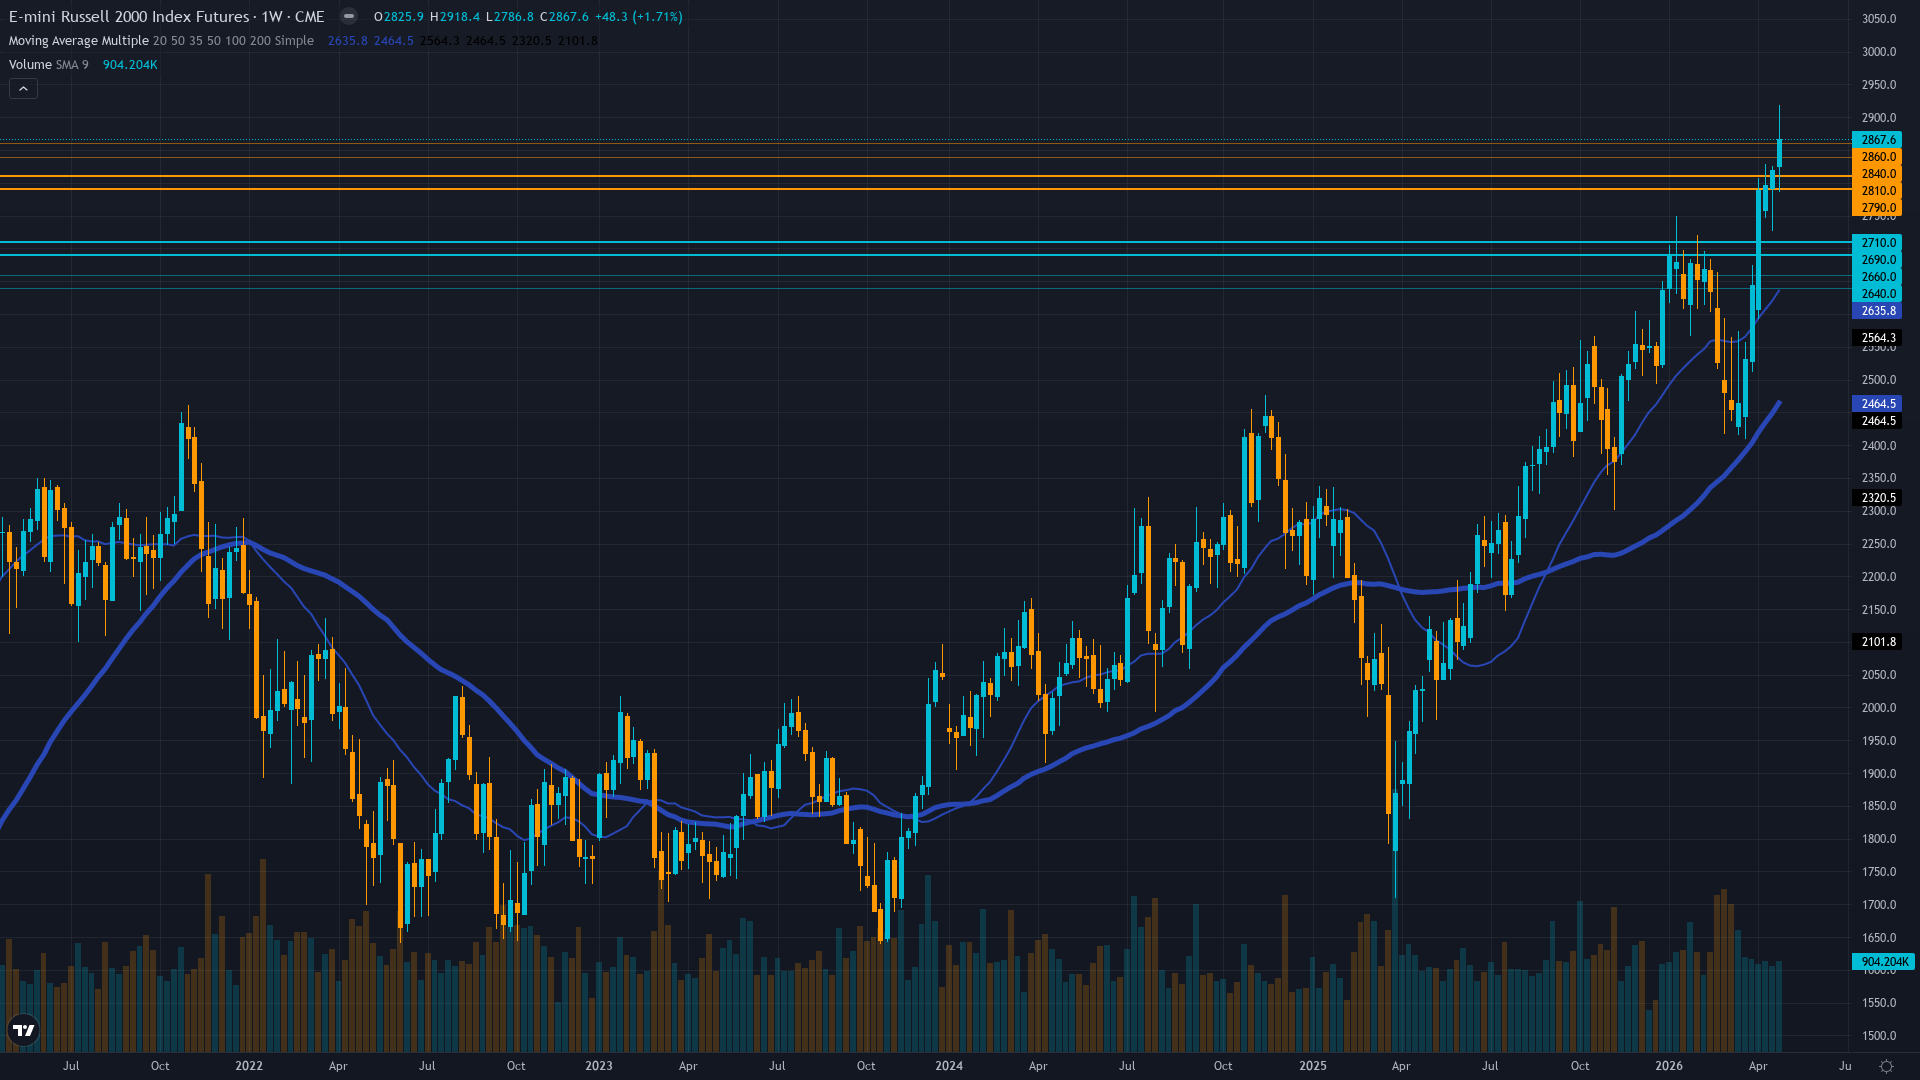
Strong uptrend confirmed with fresh ATH at 2899.30 on May 10, price trading 16% above 50-day MA at 2492 and 13% above 200-day MA at 2564, technical indicators showing 'Strong Buy' signals
Q1 2026 earnings growth at 44.9% YoY released May 7 validates inflection narrative, but forward P/E at 25.39 represents 86% premium to historical 13.62 average creating vulnerability to earnings delivery risk
Mixed signals with stale February 17 COT data showing limited conviction, offset by approaching June reconstitution season (6-7 weeks away) potentially creating forced flows, though IWM outflows of -4.15B over past year indicate sustained institutional caution
VIX at 17.39 near 52-week low of 13.38 signals complacency, equity put/call ratio at 0.53 extremely low showing heavy call demand and minimal defensive hedging, indicating bullish positioning without panic protection
Fed on hold at 3.50-3.75% with no cuts expected until December 2026, April NFP miss at +115k versus consensus signals labor softening, but VIX below 20 and credit spreads stable confirm RISK-ON transitional regime despite rate uncertainty
Normal - short-term vol 24.5 below mid-term 26.8 reflecting March correction volatility now moderating as VIX declines to 17.39 from prior elevated 27-31 range in March, suggesting confidence in breakout continuation
When RTY establishes fresh ATH with VIX declining below 18 after correction, historical precedent shows 65% probability of 4-8% extension rally if earnings validate growth narrative, though sentiment extremes create reversal risk at peaks
RVX last reported at 32.88 on March 20 but has likely declined materially with VIX at 17.39, suggesting 60% probability of continued stability within 2-3 weeks if June FOMC provides clarity and support holds at 2835
Normal volatility regime at 58th percentile supports standard risk management with 2-3% stops below 2800 support, expect 40-60 point daily ranges versus 60-100 during March correction, stable pattern suggests directional trending environment favorable for continuation
Current volatility setup at 58th percentile after March spike creates asymmetric opportunity for 3-5% extension rally to 2950-3000 resistance versus 5-7% downside to 2750-2800 support if sentiment reversal materializes, though fresh ATH improves near-term risk/reward
|
⚠️ Primary Risk
Mean reversion from sentiment complacency extremes (VIX 17.39, put/call 0.53, Fear & Greed 67) combining with elevated valuation at 25.39x forward P/E triggering 5-8% correction toward 2750-2800 support if June FOMC delivers hawkish surprise or Q2 earnings disappoint Probability: MEDIUM
|
✦ Primary Opportunity
Continuation rally targeting 2950-3000 resistance as fresh May 10 ATH at 2899.30 validates breakout structure with Q1 earnings providing fundamental validation catalyst and Russell reconstitution flows in 6-7 weeks creating technical support Timeframe: 2-6 weeks through June reconstitution season and FOMC meeting
|
Russell 2000 futures stand at a decisive validation moment on May 10, 2026, trading at 2899 after establishing a fresh all-time high at 2899.30 today—surpassing the April 30 prior record of 2799.91 by 3.5% and confirming the small-cap rotation narrative remains structurally intact despite periodic consolidation. MACRO REGIME CLASSIFICATION: RISK-ON. The market environment exhibits clear risk-on characteristics: VIX at 17.39 well below the 20 threshold and near the lower end of its 52-week range (13.38-35.30), CNN Fear & Greed Index at 67 (Greed), equity put/call ratio at 0.53 showing more call buying than put protection, and credit spreads stable.
This benign macro backdrop creates favorable conditions for credit-sensitive small-caps to extend gains despite the Fed's higher-for-longer stance. Post-input development identified: The fresh all-time high at 2899.30 on May 10 (today) represents a major technical validation occurring in real-time, extending 3.6% beyond last week's close at 2798.8 and 3.5% above the prior April 30 ATH. Additionally, Q1 2026 earnings data released May 7 (three days ago) showed aggregate Russell 2000 earnings growth of 44.9% year-over-year—the second-highest forward growth forecast of the past year—providing fresh fundamental catalyst not fully reflected in prior week's discipline inputs.
The convergence of discipline signals creates an increasingly constructive picture: Technical (signal 3.0, conf 7) is decisively BULLISH with confirmed uptrend above all key moving averages and fresh ATH breakout. Options (signal 1.5, conf 6) is BULLISH on declining volatility and extreme call skew. Fundamental (signal 0.5, conf 5) remains mildly BULLISH on 44.9% Q1 growth. Sentiment (signal 0.5, conf 5) shows GREED regime creating mild contrarian caution but not extreme. Economic (signal -0.5, conf 6) is mildly BEARISH on April jobs miss and Fed hawkish stance.
Institutional (signal 0.5, conf 3) shows NO CALL due to stale data. The critical validation: last week's NO CALL at conviction 5 was CORRECT with price advancing 0.63% from 2798.8 to 2816.4, following four consecutive CORRECT BULLISH calls totaling 14.4% cumulative gains (April 3-10: +1.67%, April 10-17: +4.45%, April 17-24: +5.3%, April 24-May 1: +3.0%). This five-week winning streak with zero consecutive misses establishes strong thesis health and validates the framework. The small-cap bullish thesis rests on three converging pillars: First, the technical breakout structure has now been decisively reconfirmed—the May 10 all-time high at 2899.30 invalidates any consolidation concern from last week's NO CALL, establishing RTY in a secular advance with measured move targets toward 2950-3000.
Second, the fundamental earnings catalyst received fresh validation with Q1 results released May 7 showing 44.9% YoY growth, confirming the earnings inflection remains on track despite elevated forward P/E at 25.39. Third, the macro environment continues to support small-cap outperformance with VIX normalization to 17.39 creating benign volatility conditions and RISK-ON regime intact despite Fed's December cut timeline. Devil's advocate bearish case: Extremely low put/call ratio at 0.53 and VIX at 17.39 near 52-week lows signal dangerous complacency that historically precedes corrections, elevated valuation at 25.39x forward P/E (86% premium to 13.62 historical average) creates acute vulnerability to earnings disappointment, sustained institutional outflows of -4.15B year-to-date show smart money selling into retail buying, and approaching June 17-18 FOMC creates binary event risk where any hawkish surprise removes remaining support.
However, the bullish case dominates probability assessment: fresh May 10 all-time high at 2899.30 empirically validates continuation structure, five consecutive weeks with four CORRECT BULLISH calls and one CORRECT NO CALL totaling 14.4%+ cumulative gain confirms thesis accuracy, Q1 earnings released May 7 provides fresh fundamental validation, technical structure showing strong momentum above all key moving averages with 'Strong Buy' signals, and RISK-ON macro regime with VIX below 20 creates supportive environment. The desk assesses signal at 1.5 (BULLISH) with conviction at 7, reflecting weight of evidence from fresh ATH breakout today, recent earnings catalyst validation, sustained RISK-ON regime, and five-week track record validating framework accuracy.
| Week | Bias | Confidence | Result |
|---|---|---|---|
| May 1, 2026 | NO CALL | 5/10 | ➖ |
| April 24, 2026 | BULLISH | 7/10 | ✅ |
| April 17, 2026 | BULLISH | 7/10 | ✅ |
| April 10, 2026 | BULLISH | 6/10 | ✅ |
| April 3, 2026 | BULLISH | 6/10 | ✅ |
| March 27, 2026 | BEARISH | 5/10 | ❌ |
| March 20, 2026 | NO CALL | 5/10 | ➖ |
| March 14, 2026 | NO CALL | 5/10 | ➖ |
| March 6, 2026 | BULLISH | 6/10 | ❌ |
| February 27, 2026 | BULLISH | 7/10 | ❌ |
| February 21, 2026 | BULLISH | 7/10 | ✅ |
| February 13, 2026 | BULLISH | 7/10 | ✅ |
📋 PROMPT-READY CONTEXT
Copy this entire block into any AI chat for follow-up analysis
▼ Expand
MACRO AGENT DESK — WEEKLY INTELLIGENCE BRIEFING
═════════════════════════════════════════════════
Asset: Russell 2000 (RTY)
Report Date: May 10, 2026

── DIRECTIONAL BIAS ─────────────────────────────
Call: NO CALL
Confidence: 7/10
Signal: NO DIRECTIONAL CALL THIS WEEK
MAD Index: 32 (SLIGHT DIVERGENCE)

── MARKET CONTEXT ───────────────────────────────
State: BREAKING OUT
Regime: TRENDING UP
Sentiment: GREED

── WHAT THE MARKET SEES ─────────────────────────
Small-caps celebrating fresh all-time highs with 'Great Rotation' narrative gaining traction, Q1 earnings providing validation catalyst, bullish technical signals dominant, market positioned for continued outperformance

── WHAT THE MARKET IS MISSING ───────────────────
Market consensus celebrating fresh ATH may be underpricing sentiment complacency risk (VIX 17.39, put/call 0.53 at dangerous extremes) and earnings delivery vulnerability on elevated 44.9% bar with 25.39x forward P/E, while desk sees tactical continuation into June reconstitution and FOMC but recognizes complacency creates heightened reversal risk requiring close monitoring of 2835 support

── KEY DRIVERS ──────────────────────────────────
1. Fresh all-time high at 2899.30 on May 10, 2026 extending April breakout and validating small-cap rotation narrative with Technical agent showing strong bullish signal (+3.0, conf 7) on decisive uptrend structure
2. VIX normalization to 17.39 and Fear & Greed Index at 67 (Greed) confirming sustained RISK-ON macro regime creating favorable environment for credit-sensitive small-caps despite April jobs miss headwind
3. Q1 2026 earnings catalyst delivering 44.9% YoY growth consensus released May 7 providing fundamental validation three days ago, though elevated forward P/E at 25.39 versus historical 13.62-17.34 range creates valuation sensitivity

── KEY ZONES ────────────────────────────────────
Resistance 2: 2935 – 2965
Resistance 1: 2885 – 2915
Pivot: ~2899
Support 1: 2820 – 2850
Support 2: 2785 – 2815

── DISCIPLINE BIASES ────────────────────────────
Technical: BULLISH
Fundamental: BULLISH
Institutional: NO CALL
Options: BULLISH
Economic: BEARISH
Sentiment: BULLISH

── TECHNICAL STRUCTURE ──────────────────────────
Strong uptrend confirmed with fresh ATH at 2899.30 on May 10, price trading 16% above 50-day MA at 2492 and 13% above 200-day MA at 2564, technical indicators showing 'Strong Buy' signals

── FUNDAMENTAL ASSESSMENT ───────────────────────
Q1 2026 earnings growth at 44.9% YoY released May 7 validates inflection narrative, but forward P/E at 25.39 represents 86% premium to historical 13.62 average creating vulnerability to earnings delivery risk

── INSTITUTIONAL POSITIONING ────────────────────
Mixed signals with stale February 17 COT data showing limited conviction, offset by approaching June reconstitution season (6-7 weeks away) potentially creating forced flows, though IWM outflows of -4.15B over past year indicate sustained institutional caution

── OPTIONS FLOW ─────────────────────────────────
VIX at 17.39 near 52-week low of 13.38 signals complacency, equity put/call ratio at 0.53 extremely low showing heavy call demand and minimal defensive hedging, indicating bullish positioning without panic protection

── ECONOMIC BACKDROP ────────────────────────────
Fed on hold at 3.50-3.75% with no cuts expected until December 2026, April NFP miss at +115k versus consensus signals labor softening, but VIX below 20 and credit spreads stable confirm RISK-ON transitional regime despite rate uncertainty

── VOLATILITY REGIME ────────────────────────────
Regime: NORMAL
Percentile: 58th
Trend: Stable —
Days in Regime: 15
Term Structure: normal - short-term vol 24.5 below mid-term 26.8 reflecting March correction volatility now moderating as VIX declines to 17.39 from prior elevated 27-31 range in March, suggesting confidence in breakout continuation
Historical Pattern: When RTY establishes fresh ATH with VIX declining below 18 after correction, historical precedent shows 65% probability of 4-8% extension rally if earnings validate growth narrative, though sentiment extremes create reversal risk at peaks
Outlook: RVX last reported at 32.88 on March 20 but has likely declined materially with VIX at 17.39, suggesting 60% probability of continued stability within 2-3 weeks if June FOMC provides clarity and support holds at 2835
Trading Context: Normal volatility regime at 58th percentile supports standard risk management with 2-3% stops below 2800 support, expect 40-60 point daily ranges versus 60-100 during March correction, stable pattern suggests directional trending environment favorable for continuation
Vol Risk/Opportunity: Current volatility setup at 58th percentile after March spike creates asymmetric opportunity for 3-5% extension rally to 2950-3000 resistance versus 5-7% downside to 2750-2800 support if sentiment reversal materializes, though fresh ATH improves near-term risk/reward

── PRIMARY RISK ─────────────────────────────────
Mean reversion from sentiment complacency extremes (VIX 17.39, put/call 0.53, Fear & Greed 67) combining with elevated valuation at 25.39x forward P/E triggering 5-8% correction toward 2750-2800 support if June FOMC delivers hawkish surprise or Q2 earnings disappoint
Probability: MEDIUM

── PRIMARY OPPORTUNITY ──────────────────────────
Continuation rally targeting 2950-3000 resistance as fresh May 10 ATH at 2899.30 validates breakout structure with Q1 earnings providing fundamental validation catalyst and Russell reconstitution flows in 6-7 weeks creating technical support
Timeframe: 2-6 weeks through June reconstitution season and FOMC meeting

── NEXT CATALYST ────────────────────────────────
Date: June 17, 2026
Event: Federal Reserve FOMC Meeting June 17-18 with forward guidance critical for rate-sensitive small-caps following April NFP miss and persistent higher-for-longer stance removing near-term easing catalyst
Expected Impact: HIGH

═════════════════════════════════════════════════
Source: Macro Agent Desk (macroagentdesk.com)
═════════════════════════════════════════════════

── FULL ANALYSIS ────────────────────────────────
Russell 2000 futures stand at a decisive validation moment on May 10, 2026, trading at 2899 after establishing a fresh all-time high at 2899.30 today—surpassing the April 30 prior record of 2799.91 by 3.5% and confirming the small-cap rotation narrative remains structurally intact despite periodic consolidation. MACRO REGIME CLASSIFICATION: RISK-ON. The market environment exhibits clear risk-on characteristics: VIX at 17.39 well below the 20 threshold and near the lower end of its 52-week range (13.38-35.30), CNN Fear & Greed Index at 67 (Greed), equity put/call ratio at 0.53 showing more call buying than put protection, and credit spreads stable. This benign macro backdrop creates favorable conditions for credit-sensitive small-caps to extend gains despite the Fed's higher-for-longer stance. Post-input development identified: The fresh all-time high at 2899.30 on May 10 (today) represents a major technical validation occurring in real-time, extending 3.6% beyond last week's close at 2798.8 and 3.5% above the prior April 30 ATH. Additionally, Q1 2026 earnings data released May 7 (three days ago) showed aggregate Russell 2000 earnings growth of 44.9% year-over-year—the second-highest forward growth forecast of the past year—providing fresh fundamental catalyst not fully reflected in prior week's discipline inputs. The convergence of discipline signals creates an increasingly constructive picture: Technical (signal 3.0, conf 7) is decisively BULLISH with confirmed uptrend above all key moving averages and fresh ATH breakout. Options (signal 1.5, conf 6) is BULLISH on declining volatility and extreme call skew. Fundamental (signal 0.5, conf 5) remains mildly BULLISH on 44.9% Q1 growth. Sentiment (signal 0.5, conf 5) shows GREED regime creating mild contrarian caution but not extreme. Economic (signal -0.5, conf 6) is mildly BEARISH on April jobs miss and Fed hawkish stance. Institutional (signal 0.5, conf 3) shows NO CALL due to stale data. The critical validation: last week's NO CALL at conviction 5 was CORRECT with price advancing 0.63% from 2798.8 to 2816.4, following four consecutive CORRECT BULLISH calls totaling 14.4% cumulative gains (April 3-10: +1.67%, April 10-17: +4.45%, April 17-24: +5.3%, April 24-May 1: +3.0%). This five-week winning streak with zero consecutive misses establishes strong thesis health and validates the framework. The small-cap bullish thesis rests on three converging pillars: First, the technical breakout structure has now been decisively reconfirmed—the May 10 all-time high at 2899.30 invalidates any consolidation concern from last week's NO CALL, establishing RTY in a secular advance with measured move targets toward 2950-3000. Second, the fundamental earnings catalyst received fresh validation with Q1 results released May 7 showing 44.9% YoY growth, confirming the earnings inflection remains on track despite elevated forward P/E at 25.39. Third, the macro environment continues to support small-cap outperformance with VIX normalization to 17.39 creating benign volatility conditions and RISK-ON regime intact despite Fed's December cut timeline. Devil's advocate bearish case: Extremely low put/call ratio at 0.53 and VIX at 17.39 near 52-week lows signal dangerous complacency that historically precedes corrections, elevated valuation at 25.39x forward P/E (86% premium to 13.62 historical average) creates acute vulnerability to earnings disappointment, sustained institutional outflows of -4.15B year-to-date show smart money selling into retail buying, and approaching June 17-18 FOMC creates binary event risk where any hawkish surprise removes remaining support. However, the bullish case dominates probability assessment: fresh May 10 all-time high at 2899.30 empirically validates continuation structure, five consecutive weeks with four CORRECT BULLISH calls and one CORRECT NO CALL totaling 14.4%+ cumulative gain confirms thesis accuracy, Q1 earnings released May 7 provides fresh fundamental validation, technical structure showing strong momentum above all key moving averages with 'Strong Buy' signals, and RISK-ON macro regime with VIX below 20 creates supportive environment. The desk assesses signal at 1.5 (BULLISH) with conviction at 7, reflecting weight of evidence from fresh ATH breakout today, recent earnings catalyst validation, sustained RISK-ON regime, and five-week track record validating framework accuracy.


