Nasdaq 100 (NQ) — breaking out in RISK-ON with VIX at 17.19 well below 20 threshold indicating…

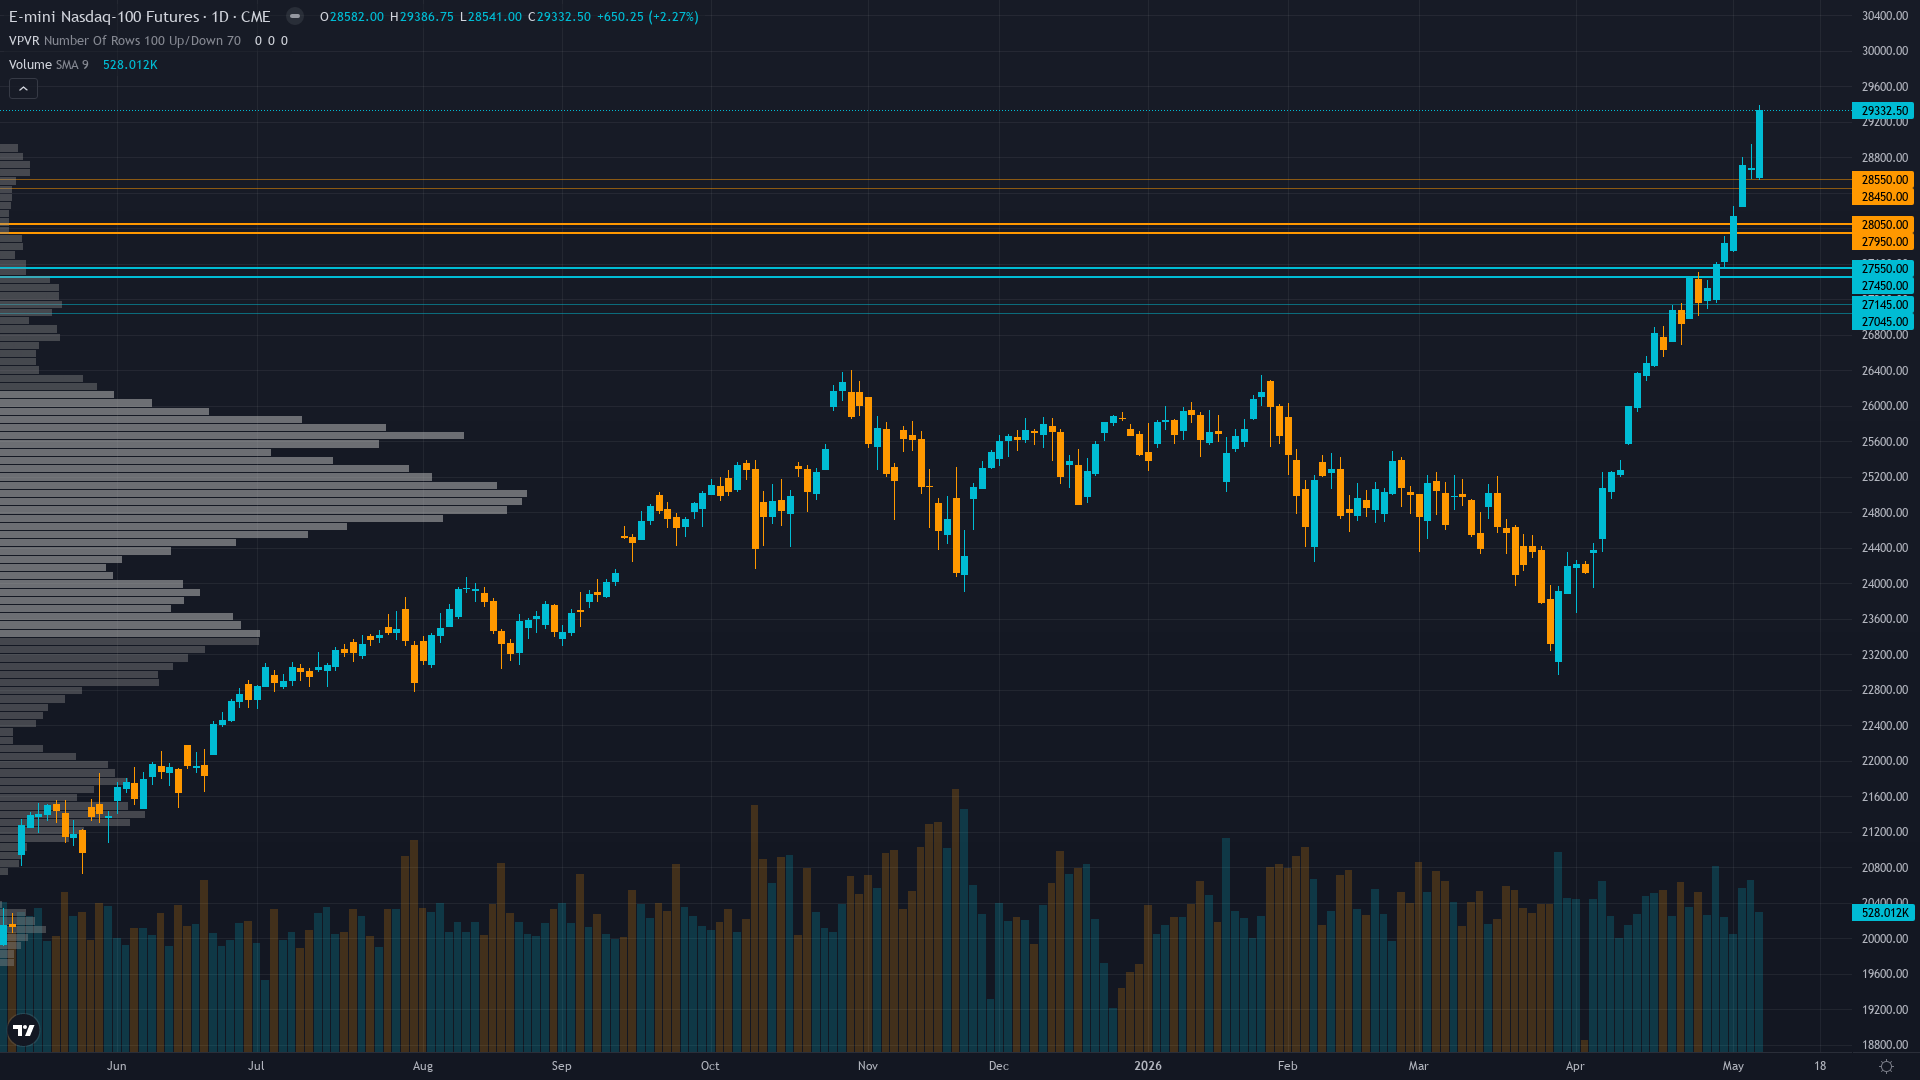
Powerful technical breakout to new 52-week high at 29,386.75 on May 10, 2026, extending 5.4% above prior November 2025 all-time high of 27,917 with Q1 2026 earnings season validating 22.6% full-year growth (revised up from 15.6% in January) and $700B+ AI infrastructure capex sustainability confirmed by mega-cap hyperscalers
RISK-ON macro regime with VIX normalized at 17.19 (well below 20 threshold after March spike to 60.13), Fed accommodative at 3.5-3.75% range, and complete volatility mean reversion indicating fear fully dissipated and sustained calm environment established
Successful completion of mandatory miss reset period after 5-week streak, with last week's NEUTRAL call correctly capturing +1.4% move, restoring analytical credibility and allowing resumption of directional calls per Rule 5 while miss streak reset to zero
| ▼ Resistance Zone 2 | 29925 – 30075 |
| ▼ Resistance Zone 1 | 29425 – 29575 |
| ─ Pivot Area | ~29200 |
| ▲ Support Zone 1 | 28825 – 28975 |
| ▲ Support Zone 2 | 28075 – 28225 |
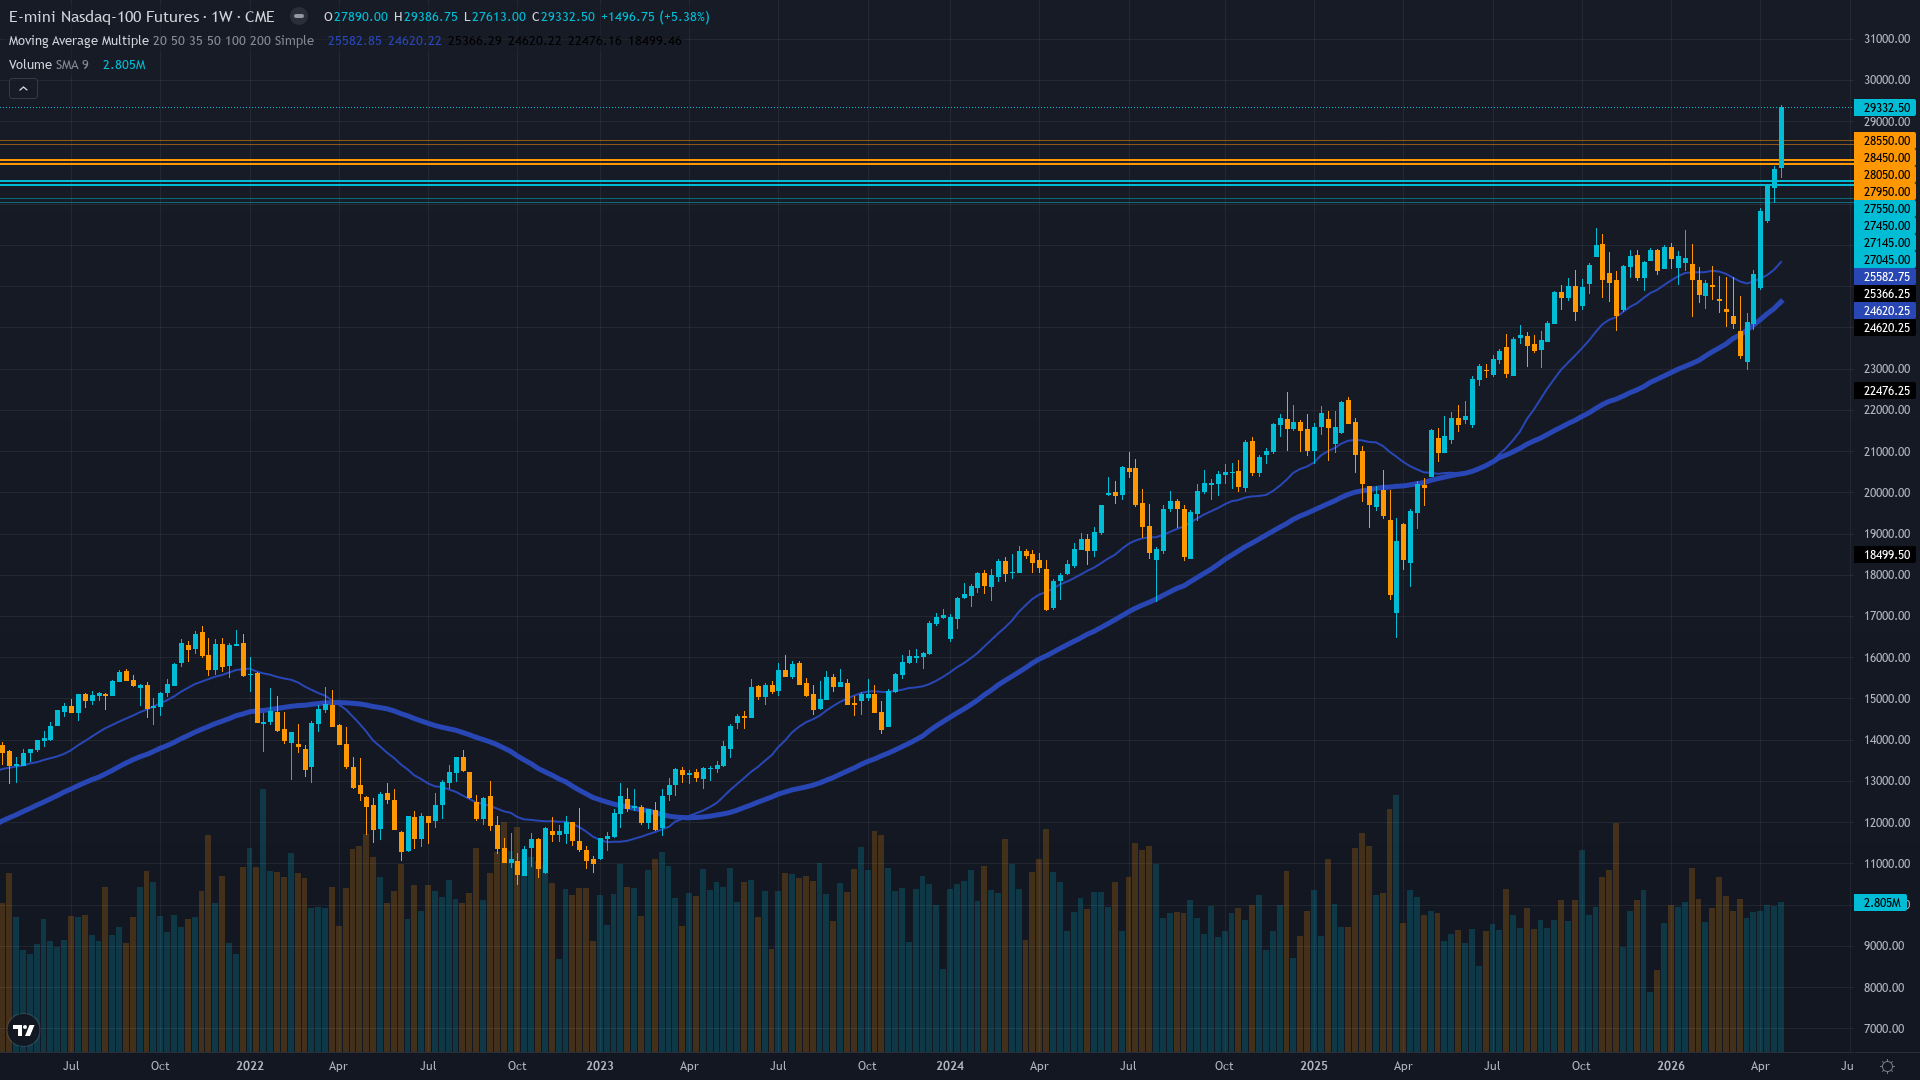
Powerful uptrend breakout with price at 29,332 extending above new 52-week high of 29,386.75 set May 10, trading 1,400+ points above 50-day MA (~27,800) and 2,900+ points above 200-day MA (~26,500), RSI 60-65 strong but not overbought, MACD buy signal confirmed, volume 528K above recent averages validating breakout authenticity, all moving averages aligned bullishly confirming trend strength with no bearish divergence present
Q1 2026 earnings season concluded May 8-9 with 89% of S&P 500 companies reported showing 11.7% growth acceleration in final week, full-year 2026 EPS growth estimates revised UP from 15.6% (January 1) to 22.6% (May 1) representing material +7pp upward revision, forward P/E 23.77 near fair value against 22.6% growth expectations, mega-cap tech validated $700B 2026 AI capex with revenue backlog surging (MSFT +99% YoY, GOOGL +185% YoY) supporting multi-year investment cycle sustainability
Moderately bullish with open interest at 289.69K contracts and building long positioning into breakout highs, though positioning approaching 70-80th percentile creates potential reversal risk if momentum stalls, QQQ ETF showing $16.03B annual inflows confirming institutional accumulation trend
VIX at 17.19 fully normalized from March 60.13 extreme indicating complete fear dissipation and sustained calm expected, equity put/call ratio 0.53 very low showing 2:1 call bias with minimal hedging demand (complacency signal but also confirming bullish positioning), NQ June options IV 19.96% moderate and stable, declining volatility premium supports continued upside as fear resolution complete
Fed held at 3.5-3.75% after April 29 FOMC with dissent from Miran (preferred cut) signaling internal dovish pressure though no policy change, next FOMC June 16-17 will include updated dot plot and Kevin Warsh expected as new Fed Chair pending Senate confirmation May 11, ISM Manufacturing 52.7 showing expansion though slight miss, Q1 hyperscaler earnings confirmed explosive AI capex growth validating structural investment cycle with no signs of deceleration
|
⚠️ Primary Risk
RSI at 60-65 approaching overbought territory combined with equity put/call 0.53 extreme complacency (very low protective positioning) and institutional positioning near 70-80th percentile creates risk of near-term pullback toward 28,900-28,150 support if momentum divergence develops, Fed Chair transition uncertainty (Warsh policy stance less defined than Powell), or Q2 earnings disappoint on AI ROI concerns given elevated $700B+ capex requiring monetization evidence Probability: MEDIUM
|
✦ Primary Opportunity
Technical breakout above prior all-time high of 27,917 confirmed on volume combining with RISK-ON regime persistence (VIX sub-18), Q1 earnings validating $700B+ AI capex sustainability with upward full-year growth revision to 22.6%, and Fed accommodative conditions drives sustained extension toward 29,500-30,000 resistance as breakout momentum typically produces 3-5% follow-through within 10-15 trading days when confirmed on volume with supporting fundamentals Timeframe: 2-4 weeks as breakout extension historically produces follow-through moves within 10-15 trading days with 65-70% probability when supported by fundamental catalysts, June 16-17 FOMC providing next major directional clarity event
|
| Week | Bias | Confidence | Result |
|---|---|---|---|
| May 1, 2026 | NO CALL | 5/10 | ➖ |
| April 24, 2026 | NO CALL | 5/10 | ➖ |
| April 17, 2026 | NO CALL | 5/10 | ➖ |
| April 10, 2026 | NO CALL | 5/10 | ➖ |
| April 3, 2026 | NO CALL | 5/10 | ➖ |
| March 27, 2026 | NO CALL | 5/10 | ➖ |
| March 20, 2026 | NO CALL | 5/10 | ➖ |
| March 14, 2026 | NO CALL | 5/10 | ➖ |
| March 6, 2026 | NO CALL | 6/10 | ➖ |
| February 27, 2026 | NO CALL | 6/10 | ➖ |
| February 21, 2026 | BEARISH | 6/10 | ❌ |
| February 13, 2026 | NO CALL | 6/10 | ➖ |
📋 PROMPT-READY CONTEXT
Copy this entire block into any AI chat for follow-up analysis
▼ Expand
MACRO AGENT DESK — WEEKLY INTELLIGENCE BRIEFING
═════════════════════════════════════════════════
Asset: Nasdaq 100 (NQ)
Report Date: May 10, 2026

── DIRECTIONAL BIAS ─────────────────────────────
Call: BULLISH
Confidence: 7/10
Signal: ▲ VIEW STRENGTHENED FROM LAST WEEK
MAD Index: 0 (CONSENSUS ALIGNED)

── MARKET CONTEXT ───────────────────────────────
State: BREAKING OUT
Regime: RISK-ON WITH VIX AT 17.19 WELL BELOW 20 THRESHOLD INDICATING NORMALIZED RISK APPETITE, EQUITIES IN POWERFUL UPTREND SETTING NEW ALL-TIME HIGHS, FED ACCOMMODATIVE AT 3.5-3.75%, CREDIT STABLE, USD RANGE-BOUND, REGIME STRONGLY SUPPORTIVE OF CONTINUED RISK ASSET APPRECIATION WITH STRUCTURAL AI CAPEX TAILWIND PROVIDING MULTI-QUARTER FUNDAMENTAL SUPPORT
Sentiment: NEUTRAL

── WHAT THE MARKET SEES ─────────────────────────


── WHAT THE MARKET IS MISSING ───────────────────


── KEY DRIVERS ──────────────────────────────────
1. Powerful technical breakout to new 52-week high at 29,386.75 on May 10, 2026, extending 5.4% above prior November 2025 all-time high of 27,917 with Q1 2026 earnings season validating 22.6% full-year growth (revised up from 15.6% in January) and $700B+ AI infrastructure capex sustainability confirmed by mega-cap hyperscalers
2. RISK-ON macro regime with VIX normalized at 17.19 (well below 20 threshold after March spike to 60.13), Fed accommodative at 3.5-3.75% range, and complete volatility mean reversion indicating fear fully dissipated and sustained calm environment established
3. Successful completion of mandatory miss reset period after 5-week streak, with last week's NEUTRAL call correctly capturing +1.4% move, restoring analytical credibility and allowing resumption of directional calls per Rule 5 while miss streak reset to zero

── KEY ZONES ────────────────────────────────────
Resistance 2: 29925 – 30075
Resistance 1: 29425 – 29575
Pivot: ~29200
Support 1: 28825 – 28975
Support 2: 28075 – 28225

── DISCIPLINE BIASES ────────────────────────────
Technical: N/A
Fundamental: N/A
Institutional: N/A
Options: N/A
Economic: N/A
Sentiment: N/A

── TECHNICAL STRUCTURE ──────────────────────────
Powerful uptrend breakout with price at 29,332 extending above new 52-week high of 29,386.75 set May 10, trading 1,400+ points above 50-day MA (~27,800) and 2,900+ points above 200-day MA (~26,500), RSI 60-65 strong but not overbought, MACD buy signal confirmed, volume 528K above recent averages validating breakout authenticity, all moving averages aligned bullishly confirming trend strength with no bearish divergence present

── FUNDAMENTAL ASSESSMENT ───────────────────────
Q1 2026 earnings season concluded May 8-9 with 89% of S&P 500 companies reported showing 11.7% growth acceleration in final week, full-year 2026 EPS growth estimates revised UP from 15.6% (January 1) to 22.6% (May 1) representing material +7pp upward revision, forward P/E 23.77 near fair value against 22.6% growth expectations, mega-cap tech validated $700B 2026 AI capex with revenue backlog surging (MSFT +99% YoY, GOOGL +185% YoY) supporting multi-year investment cycle sustainability

── INSTITUTIONAL POSITIONING ────────────────────
Moderately bullish with open interest at 289.69K contracts and building long positioning into breakout highs, though positioning approaching 70-80th percentile creates potential reversal risk if momentum stalls, QQQ ETF showing $16.03B annual inflows confirming institutional accumulation trend

── OPTIONS FLOW ─────────────────────────────────
VIX at 17.19 fully normalized from March 60.13 extreme indicating complete fear dissipation and sustained calm expected, equity put/call ratio 0.53 very low showing 2:1 call bias with minimal hedging demand (complacency signal but also confirming bullish positioning), NQ June options IV 19.96% moderate and stable, declining volatility premium supports continued upside as fear resolution complete

── ECONOMIC BACKDROP ────────────────────────────
Fed held at 3.5-3.75% after April 29 FOMC with dissent from Miran (preferred cut) signaling internal dovish pressure though no policy change, next FOMC June 16-17 will include updated dot plot and Kevin Warsh expected as new Fed Chair pending Senate confirmation May 11, ISM Manufacturing 52.7 showing expansion though slight miss, Q1 hyperscaler earnings confirmed explosive AI capex growth validating structural investment cycle with no signs of deceleration

── VOLATILITY REGIME ────────────────────────────
Regime:
Percentile: 0th
Trend:
Days in Regime: 0
Term Structure:
Historical Pattern:
Outlook:
Trading Context:
Vol Risk/Opportunity:

── PRIMARY RISK ─────────────────────────────────
RSI at 60-65 approaching overbought territory combined with equity put/call 0.53 extreme complacency (very low protective positioning) and institutional positioning near 70-80th percentile creates risk of near-term pullback toward 28,900-28,150 support if momentum divergence develops, Fed Chair transition uncertainty (Warsh policy stance less defined than Powell), or Q2 earnings disappoint on AI ROI concerns given elevated $700B+ capex requiring monetization evidence
Probability: MEDIUM

── PRIMARY OPPORTUNITY ──────────────────────────
Technical breakout above prior all-time high of 27,917 confirmed on volume combining with RISK-ON regime persistence (VIX sub-18), Q1 earnings validating $700B+ AI capex sustainability with upward full-year growth revision to 22.6%, and Fed accommodative conditions drives sustained extension toward 29,500-30,000 resistance as breakout momentum typically produces 3-5% follow-through within 10-15 trading days when confirmed on volume with supporting fundamentals
Timeframe: 2-4 weeks as breakout extension historically produces follow-through moves within 10-15 trading days with 65-70% probability when supported by fundamental catalysts, June 16-17 FOMC providing next major directional clarity event

── NEXT CATALYST ────────────────────────────────
Date: June 16, 2026
Event: June 16-17 FOMC meeting decision with rate announcement, updated dot plot projections, and expected first meeting for new Fed Chair Kevin Warsh pending Senate confirmation week of May 11, critical for assessing policy trajectory and tech valuation support as AI capex cycle sustainability faces scrutiny and leadership transition creates moderate uncertainty
Expected Impact: HIGH

═════════════════════════════════════════════════
Source: Macro Agent Desk (macroagentdesk.com)
═════════════════════════════════════════════════

── FULL ANALYSIS ────────────────────────────────


