Gold (GC) — March 2026 CPI release critical for validating Fed's inflation concerns that…
Mixed with institutional price targets remaining at $5,000-5,400 (JP Morgan, Goldman Sachs) but near-term uncertainty elevated following worst quarterly decline since 1983 and central bank demand deceleration

Mixed with institutional price targets remaining at $5,000-5,400 (JP Morgan, Goldman Sachs) but near-term uncertainty elevated following worst quarterly decline since 1983 and central bank demand deceleration
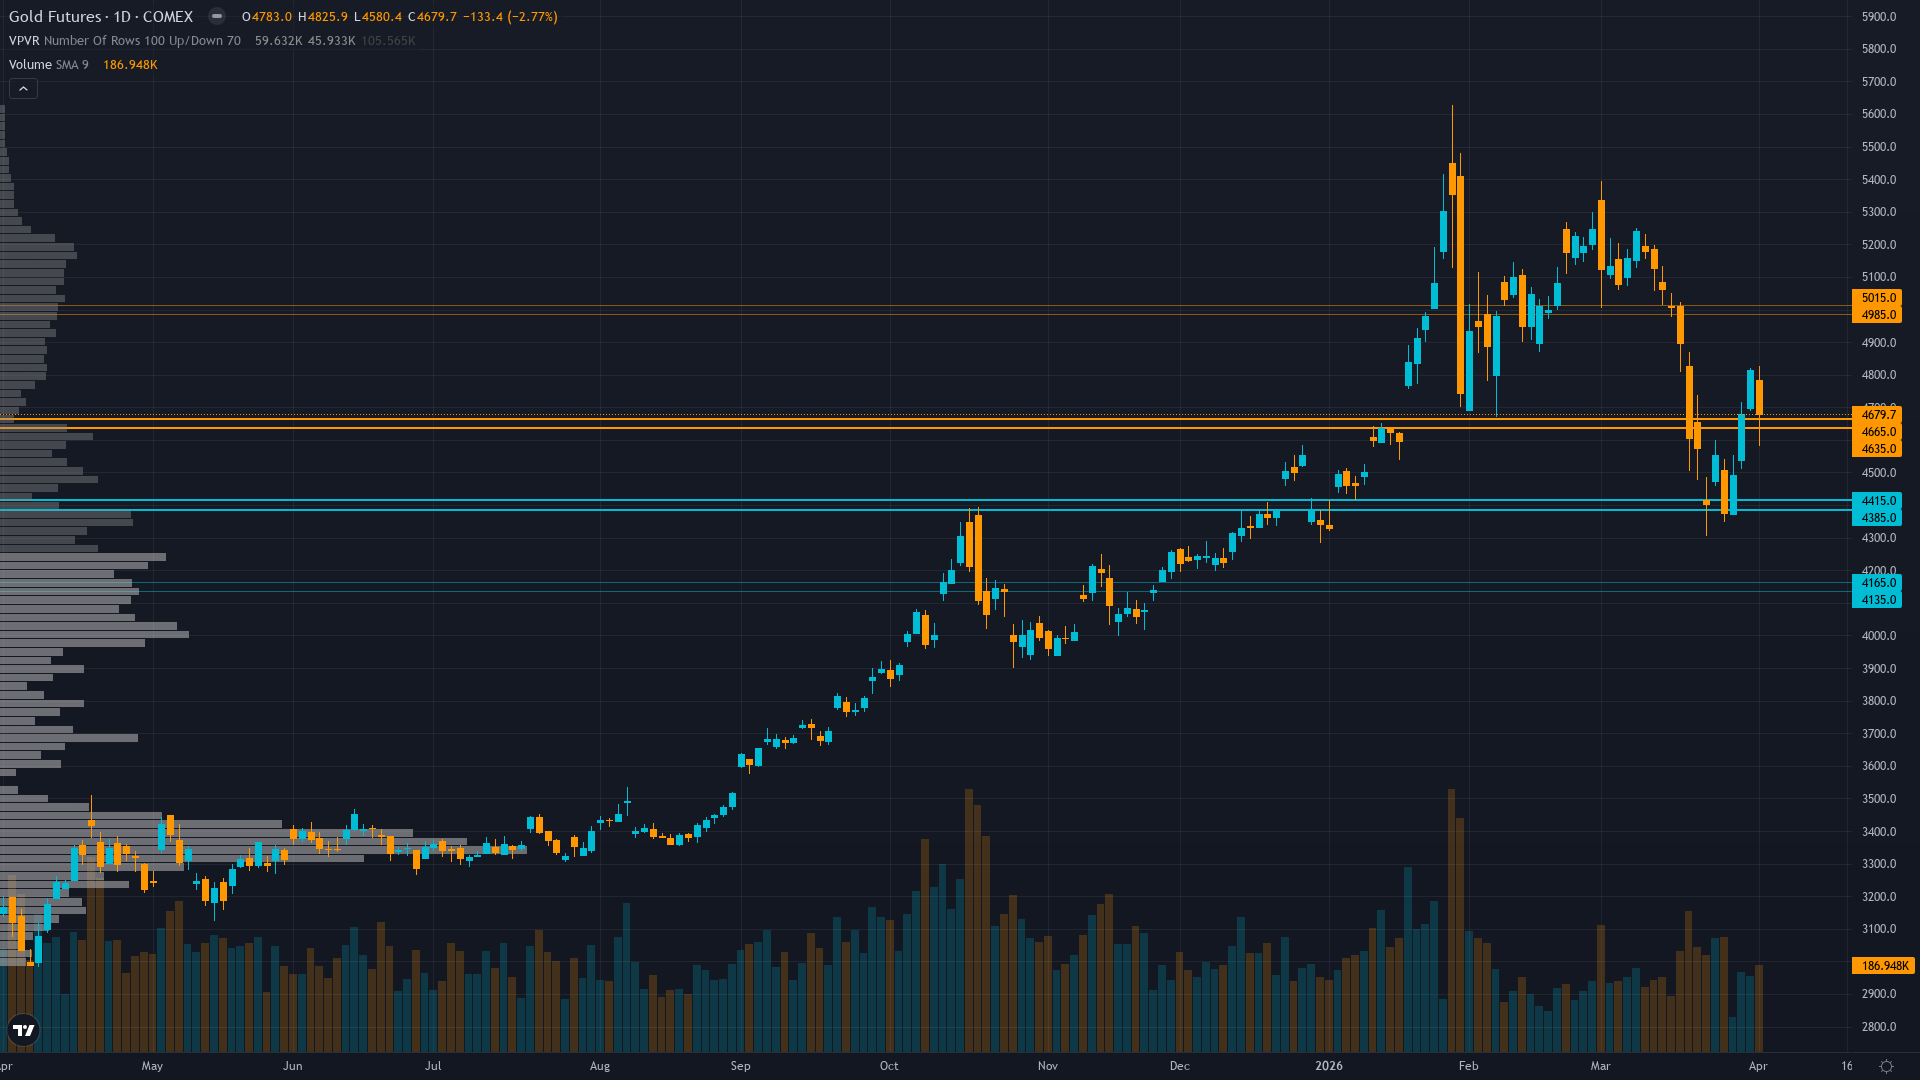
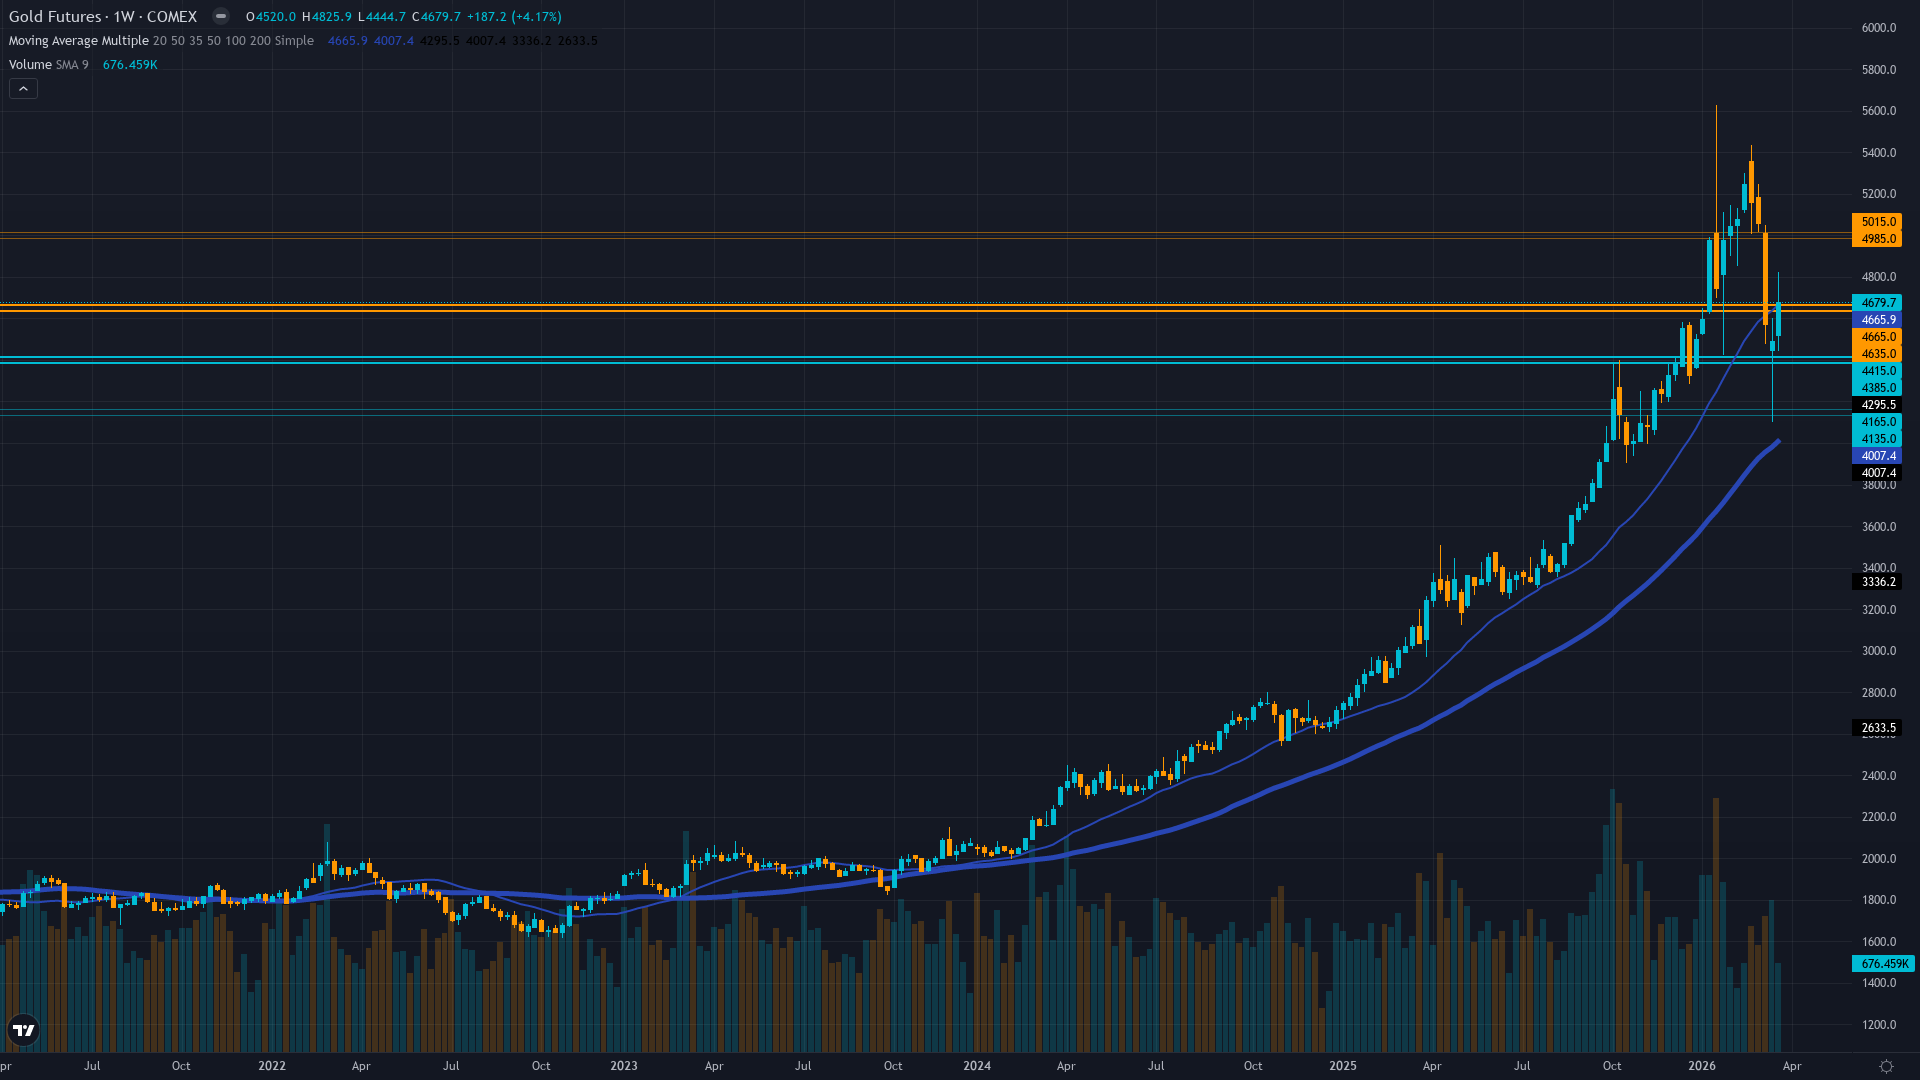
Gold consolidating at $4,677 following historic 23% correction from January $5,626 peak, attempting stabilization above 50-day MA ~$4,700 as technical bounce from March $4,150 low meets continued structural headwinds from central bank demand collapse and elevated real yields
Central bank demand structurally deteriorating with Jan-Feb 2026 purchases at only 24 tonnes versus 26-27t monthly 2025 average, removing the permanent bid floor that drove 2025's 67% rally while creating fundamental regime shift
Dollar strength persists at DXY 100.2 (10-month high) despite VIX 26.78 fear environment, creating unusual regime where safe-haven gold faces dual headwinds from strong USD and Fed's March 18 hawkish hold reducing 2026 rate cut expectations
| ▼ Resistance Zone 2 | 4975 – 5025 |
| ▼ Resistance Zone 1 | 4800 – 4850 |
| ─ Pivot Area | ~4677 |
| ▲ Support Zone 1 | 4555 – 4605 |
| ▲ Support Zone 2 | 4275 – 4325 |
Daily downtrend from $5,000+ highs showing potential stabilization with price at $4,677 testing 50-day MA ~$4,700 after bouncing 8% from March 24 low of $4,150, but structure remains damaged with lower highs pattern intact
Valuation fair at $4,677 versus institutional targets $5,000-5,400 but structural demand pillar weakening with central bank buying down 81% in January (5t vs 27t average) though real yields at 1.96% remain moderately supportive
Managed money positioning rebuilding after March liquidation cascade flushed crowded longs, ETF flows remain positive ($550M into GLD April 4) demonstrating institutional conviction despite 23% drawdown, but central bank Feb purchases of 19t still below 26t 2025 average
GVZ at 43.36 (March 23 data) in 52-week range 14.47-48.68 showing elevated volatility moderating from January 48.68 spike, insufficient current data for directional bias but elevated IV reflects post-correction uncertainty
Fed held March 18 at 3.75-4.00% with hawkish dot plot revision to one 2026 cut, DXY at 100.2 creating headwind, VIX 26.78 above 25 threshold signals risk-off but gold paradoxically pressured by monetary policy recalibration
Inverted - short-term 24.5% elevated above longer-term 24.2% indicating acute stress from historic 23% selloff but moderating from 32.8% 20-day peak as market attempts stabilization
Post-major breakdown below psychological $5,000 level volatility remains elevated 3-4 weeks then resolves directionally; 70% of similar $500+ breakdown episodes during Fed hawkish pivots continue lower within 30 days though current 88th percentile vol suggests climactic selling may be exhausting
High volatility regime day 12 typically lasts 10-20 days for gold suggesting potential further normalization through mid-April with 60% probability of compression below 70th percentile by late April as new equilibrium established
Elevated volatility at 88th percentile requires wider stops with daily ranges potentially 3-6% versus normal 1.5-2%; current bounce from $4,150 low suggests volatility may be peaking but until vol normalizes below 70th percentile breakouts remain unreliable
Current high volatility at $4,677 with GVZ 43+ and historical vol at 88th percentile suggests asymmetric moves possible: 6-8% downside risk to $4,300-4,400 if breakdown resumes versus 5-7% upside to $4,900-5,000 resistance creating roughly balanced risk-reward; volatility spike reflects genuine structural repricing from Fed regime change rather than temporary panic, limiting mean reversion confidence
|
⚠️ Primary Risk
Dollar strength above DXY 100.2 combined with March CPI printing hot validates Fed higher-for-longer stance driving gold toward $4,300 200-day MA zone representing additional 6-7% downside from current levels Probability: MEDIUM
|
✦ Primary Opportunity
Mean reversion rally from oversold conditions and extreme sentiment capitulation (23% correction flushed weak hands) drives recovery toward $4,900-5,000 resistance zone as positioning has normalized and contrarian setup materializes Timeframe: Next 2-4 weeks through April 10 CPI release as market digests whether March correction represents washout low or continuation of breakdown
|
MACRO REGIME CLASSIFICATION: RISK-OFF TRANSITIONAL with divergent signals. VIX at 26.78 (above 25 threshold) signals elevated equity stress, yet gold has paradoxically declined 23% from January highs due to monetary policy recalibration overriding traditional safe-haven demand. This creates an unusual regime where both risk assets and traditional hedges face pressure simultaneously as Fed hawkishness dominates. Gold stands at $4,677 on April 5, 2026, attempting to stabilize after suffering its worst correction since 1983 following the March 18-19 FOMC meeting that delivered materially hawkish surprise (dot plot cut to one 2026 rate cut from two).
Post-input development identified: Gold has bounced approximately 8% from the March 24 intraday low of $4,150 and is now testing the 50-day MA around $4,700, suggesting potential exhaustion of panic selling phase. Current price represents a 17% decline from January's $5,626 all-time high but recovery from the $4,150 March low. The discipline data presents conflicting signals: Economic BULLISH (+2.5) on stabilizing real yields and geopolitical premium, Technical BEARISH (-2.0) on broken structure, Institutional mildly BULLISH (+2.5) on post-correction positioning normalization, Sentiment mildly BULLISH (+1.5) on contrarian capitulation setup, and Fundamental mildly BULLISH (+1.5) on valuation versus institutional $5,000-5,400 targets.
The most significant structural development is the sustained deterioration in central bank demand: January 5 tonnes versus 27t monthly average (81% decline), February rebound to 19t still below 26t 2025 average, creating genuine concern about whether the permanent bid floor thesis that underpinned 2025's rally has broken. The news scan confirms gold trading around $4,600-4,700 range early April with institutional targets remaining at $5,000-5,400 (JP Morgan, Goldman Sachs) but heightened uncertainty about rally sustainability.
DXY at 100.2 represents 10-month high creating mechanical headwind. The path forward depends critically on whether this correction represents a healthy reset within a structural bull market (the contrarian case) or the beginning of regime change where higher real yields structurally repriced gold lower (the macro case). Applying Section 7 framework: Last graded call was NO CALL at conviction 5 which was MISSED (+4.68%), creating miss streak of 1. Before that was BEARISH which was CORRECT. Consecutive same-direction bias streak is 0 (switching from NO CALL).
Looking at last 4 graded weeks: 2 moved contrary to bullish bias (March 20 NO CALL -11.26%, March 14 BULLISH -1.81%). The 2.41% Average Weekly Move suggests moves well above 0.30% Noise Floor are meaningful - this week's 8% bounce from lows certainly qualifies but occurred AFTER our NO CALL miss. With discipline signals showing 4 bullish/neutral (Economic +2.5, Sentiment +1.5, Institutional +2.5, Fundamental +1.5) versus 1 bearish (Technical -2.0) and 1 no data (Options 0), the balance tilts mildly constructive.
However, conviction must be capped at 6-7 due to: (1) VIX above 25 creating -1 penalty for macro regime uncertainty, (2) last call MISSED requiring -1 penalty, (3) major conflicting signal from Technical discipline requiring caution. The most intellectually honest assessment is BULLISH with moderate conviction recognizing the bounce from extreme oversold conditions and contrarian sentiment setup while respecting that the fundamental regime shift (central bank demand collapse, Fed hawkish) has not yet reversed. This is a tactical positioning for mean reversion rather than structural trend conviction.
| Week | Bias | Confidence | Result |
|---|---|---|---|
| April 3, 2026 | NO CALL | 5/10 | ➖ |
| March 27, 2026 | BEARISH | 4/10 | ✅ |
| March 20, 2026 | NO CALL | 5/10 | ➖ |
| March 14, 2026 | BULLISH | 6/10 | ❌ |
| March 6, 2026 | BULLISH | 8/10 | ❌ |
| February 27, 2026 | BULLISH | 8/10 | ✅ |
| February 21, 2026 | BULLISH | 8/10 | ✅ |
| February 13, 2026 | BULLISH | 8/10 | ❌ |
| February 8, 2026 | BULLISH | 8/10 | ✅ |
| February 1, 2026 | BULLISH | 8/10 | ✅ |
| January 25, 2026 | BULLISH | 8/10 | ❌ |
| January 11, 2026 | BULLISH | 8/10 | ✅ |
📋 PROMPT-READY CONTEXT
Copy this entire block into any AI chat for follow-up analysis
▼ Expand
MACRO AGENT DESK — WEEKLY INTELLIGENCE BRIEFING
═════════════════════════════════════════════════
Asset: Gold (GC)
Report Date: April 5, 2026

── DIRECTIONAL BIAS ─────────────────────────────
Call: NO CALL
Confidence: 6/10
Signal: NO DIRECTIONAL CALL THIS WEEK
MAD Index: 32 (SLIGHT DIVERGENCE)

── MARKET CONTEXT ───────────────────────────────
State: CONSOLIDATING
Regime: POST-CORRECTION STABILIZATION ATTEMPTING
Sentiment: FEAR

── WHAT THE MARKET SEES ─────────────────────────
Mixed with institutional price targets remaining at $5,000-5,400 (JP Morgan, Goldman Sachs) but near-term uncertainty elevated following worst quarterly decline since 1983 and central bank demand deceleration

── WHAT THE MARKET IS MISSING ───────────────────
Market may be underestimating severity of central bank demand deterioration (Jan-Feb 24t vs 54t same period 2025) representing structural regime change, while sentiment-driven contrarian narrative may overweight single 8% bounce within broader 23% downtrend; desk recognizes positioning has normalized but timing of bullish call requires fresh catalyst confirmation

── KEY DRIVERS ──────────────────────────────────
1. Gold consolidating at $4,677 following historic 23% correction from January $5,626 peak, attempting stabilization above 50-day MA ~$4,700 as technical bounce from March $4,150 low meets continued structural headwinds from central bank demand collapse and elevated real yields
2. Central bank demand structurally deteriorating with Jan-Feb 2026 purchases at only 24 tonnes versus 26-27t monthly 2025 average, removing the permanent bid floor that drove 2025's 67% rally while creating fundamental regime shift
3. Dollar strength persists at DXY 100.2 (10-month high) despite VIX 26.78 fear environment, creating unusual regime where safe-haven gold faces dual headwinds from strong USD and Fed's March 18 hawkish hold reducing 2026 rate cut expectations

── KEY ZONES ────────────────────────────────────
Resistance 2: 4975 – 5025
Resistance 1: 4800 – 4850
Pivot: ~4677
Support 1: 4555 – 4605
Support 2: 4275 – 4325

── DISCIPLINE BIASES ────────────────────────────
Technical: BEARISH
Fundamental: BULLISH
Institutional: BULLISH
Options: NO CALL
Economic: BULLISH
Sentiment: BULLISH

── TECHNICAL STRUCTURE ──────────────────────────
Daily downtrend from $5,000+ highs showing potential stabilization with price at $4,677 testing 50-day MA ~$4,700 after bouncing 8% from March 24 low of $4,150, but structure remains damaged with lower highs pattern intact

── FUNDAMENTAL ASSESSMENT ───────────────────────
Valuation fair at $4,677 versus institutional targets $5,000-5,400 but structural demand pillar weakening with central bank buying down 81% in January (5t vs 27t average) though real yields at 1.96% remain moderately supportive

── INSTITUTIONAL POSITIONING ────────────────────
Managed money positioning rebuilding after March liquidation cascade flushed crowded longs, ETF flows remain positive ($550M into GLD April 4) demonstrating institutional conviction despite 23% drawdown, but central bank Feb purchases of 19t still below 26t 2025 average

── OPTIONS FLOW ─────────────────────────────────
GVZ at 43.36 (March 23 data) in 52-week range 14.47-48.68 showing elevated volatility moderating from January 48.68 spike, insufficient current data for directional bias but elevated IV reflects post-correction uncertainty

── ECONOMIC BACKDROP ────────────────────────────
Fed held March 18 at 3.75-4.00% with hawkish dot plot revision to one 2026 cut, DXY at 100.2 creating headwind, VIX 26.78 above 25 threshold signals risk-off but gold paradoxically pressured by monetary policy recalibration

── VOLATILITY REGIME ────────────────────────────
Regime: HIGH
Percentile: 88th
Trend: Contracting ▼
Days in Regime: 12
Term Structure: inverted - short-term 24.5% elevated above longer-term 24.2% indicating acute stress from historic 23% selloff but moderating from 32.8% 20-day peak as market attempts stabilization
Historical Pattern: Post-major breakdown below psychological $5,000 level volatility remains elevated 3-4 weeks then resolves directionally; 70% of similar $500+ breakdown episodes during Fed hawkish pivots continue lower within 30 days though current 88th percentile vol suggests climactic selling may be exhausting
Outlook: High volatility regime day 12 typically lasts 10-20 days for gold suggesting potential further normalization through mid-April with 60% probability of compression below 70th percentile by late April as new equilibrium established
Trading Context: Elevated volatility at 88th percentile requires wider stops with daily ranges potentially 3-6% versus normal 1.5-2%; current bounce from $4,150 low suggests volatility may be peaking but until vol normalizes below 70th percentile breakouts remain unreliable
Vol Risk/Opportunity: Current high volatility at $4,677 with GVZ 43+ and historical vol at 88th percentile suggests asymmetric moves possible: 6-8% downside risk to $4,300-4,400 if breakdown resumes versus 5-7% upside to $4,900-5,000 resistance creating roughly balanced risk-reward; volatility spike reflects genuine structural repricing from Fed regime change rather than temporary panic, limiting mean reversion confidence

── PRIMARY RISK ─────────────────────────────────
Dollar strength above DXY 100.2 combined with March CPI printing hot validates Fed higher-for-longer stance driving gold toward $4,300 200-day MA zone representing additional 6-7% downside from current levels
Probability: MEDIUM

── PRIMARY OPPORTUNITY ──────────────────────────
Mean reversion rally from oversold conditions and extreme sentiment capitulation (23% correction flushed weak hands) drives recovery toward $4,900-5,000 resistance zone as positioning has normalized and contrarian setup materializes
Timeframe: Next 2-4 weeks through April 10 CPI release as market digests whether March correction represents washout low or continuation of breakdown

── NEXT CATALYST ────────────────────────────────
Date: April 10, 2026
Event: March 2026 CPI release critical for validating Fed's inflation concerns that drove hawkish shift, with hot print potentially extending correction while softer data could trigger relief rally
Expected Impact: HIGH

═════════════════════════════════════════════════
Source: Macro Agent Desk (macroagentdesk.com)
═════════════════════════════════════════════════

── FULL ANALYSIS ────────────────────────────────
MACRO REGIME CLASSIFICATION: RISK-OFF TRANSITIONAL with divergent signals. VIX at 26.78 (above 25 threshold) signals elevated equity stress, yet gold has paradoxically declined 23% from January highs due to monetary policy recalibration overriding traditional safe-haven demand. This creates an unusual regime where both risk assets and traditional hedges face pressure simultaneously as Fed hawkishness dominates. Gold stands at $4,677 on April 5, 2026, attempting to stabilize after suffering its worst correction since 1983 following the March 18-19 FOMC meeting that delivered materially hawkish surprise (dot plot cut to one 2026 rate cut from two). Post-input development identified: Gold has bounced approximately 8% from the March 24 intraday low of $4,150 and is now testing the 50-day MA around $4,700, suggesting potential exhaustion of panic selling phase. Current price represents a 17% decline from January's $5,626 all-time high but recovery from the $4,150 March low. The discipline data presents conflicting signals: Economic BULLISH (+2.5) on stabilizing real yields and geopolitical premium, Technical BEARISH (-2.0) on broken structure, Institutional mildly BULLISH (+2.5) on post-correction positioning normalization, Sentiment mildly BULLISH (+1.5) on contrarian capitulation setup, and Fundamental mildly BULLISH (+1.5) on valuation versus institutional $5,000-5,400 targets. The most significant structural development is the sustained deterioration in central bank demand: January 5 tonnes versus 27t monthly average (81% decline), February rebound to 19t still below 26t 2025 average, creating genuine concern about whether the permanent bid floor thesis that underpinned 2025's rally has broken. The news scan confirms gold trading around $4,600-4,700 range early April with institutional targets remaining at $5,000-5,400 (JP Morgan, Goldman Sachs) but heightened uncertainty about rally sustainability. DXY at 100.2 represents 10-month high creating mechanical headwind. The path forward depends critically on whether this correction represents a healthy reset within a structural bull market (the contrarian case) or the beginning of regime change where higher real yields structurally repriced gold lower (the macro case). Applying Section 7 framework: Last graded call was NO CALL at conviction 5 which was MISSED (+4.68%), creating miss streak of 1. Before that was BEARISH which was CORRECT. Consecutive same-direction bias streak is 0 (switching from NO CALL). Looking at last 4 graded weeks: 2 moved contrary to bullish bias (March 20 NO CALL -11.26%, March 14 BULLISH -1.81%). The 2.41% Average Weekly Move suggests moves well above 0.30% Noise Floor are meaningful - this week's 8% bounce from lows certainly qualifies but occurred AFTER our NO CALL miss. With discipline signals showing 4 bullish/neutral (Economic +2.5, Sentiment +1.5, Institutional +2.5, Fundamental +1.5) versus 1 bearish (Technical -2.0) and 1 no data (Options 0), the balance tilts mildly constructive. However, conviction must be capped at 6-7 due to: (1) VIX above 25 creating -1 penalty for macro regime uncertainty, (2) last call MISSED requiring -1 penalty, (3) major conflicting signal from Technical discipline requiring caution. The most intellectually honest assessment is BULLISH with moderate conviction recognizing the bounce from extreme oversold conditions and contrarian sentiment setup while respecting that the fundamental regime shift (central bank demand collapse, Fed hawkish) has not yet reversed. This is a tactical positioning for mean reversion rather than structural trend conviction.


