S&P 500 (ES) — 0.5 between 6598 support and 6640 resistance with 5/10 confidence
Divided between relief rally continuation toward 6746-6850 and consolidation/reversal risk given unrepaired technical breakdown and elevated valuations awaiting earnings validation

Divided between relief rally continuation toward 6746-6850 and consolidation/reversal risk given unrepaired technical breakdown and elevated valuations awaiting earnings validation
Violent sentiment mean-reversion rally from March extreme fear levels - S&P 500 snapped 5-week losing streak with 3.4% weekly gain as VIX compressed from 31.05 to 23.87 and Iran conflict fears subsided
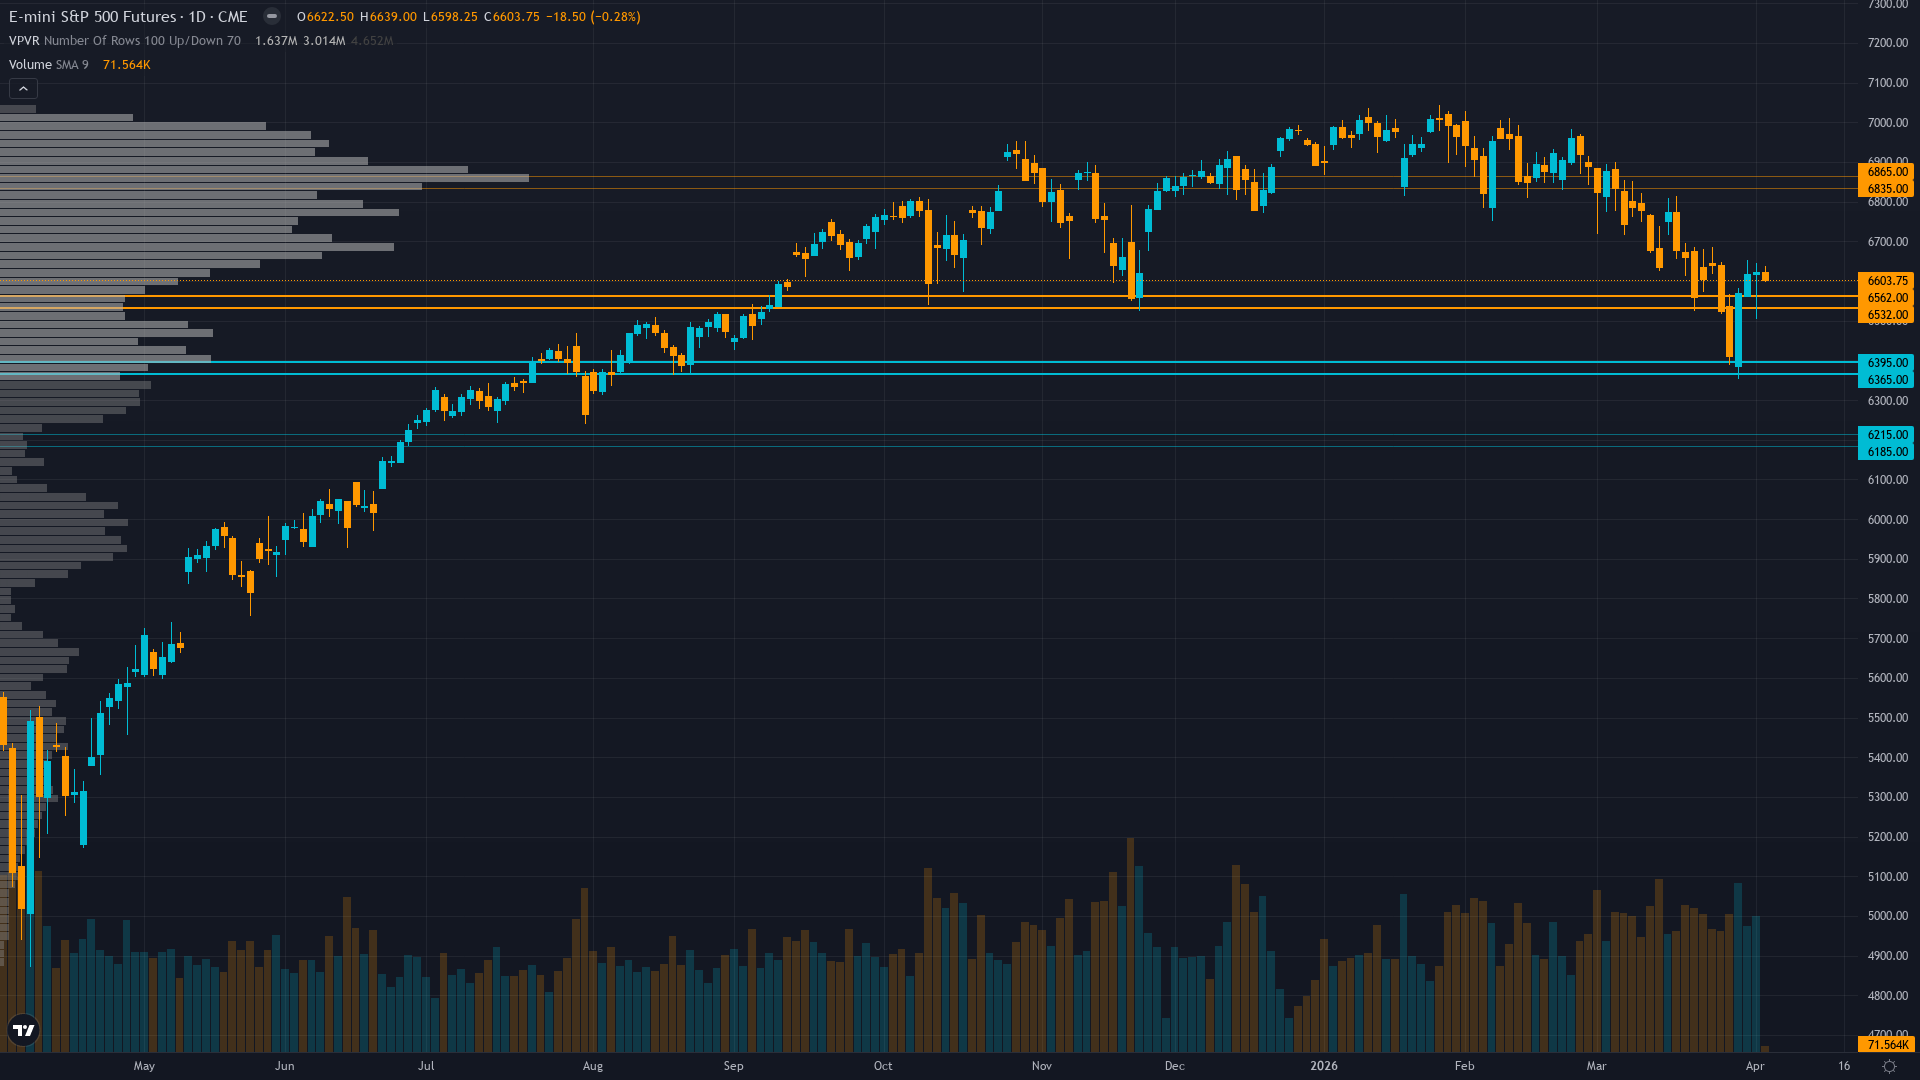
Technical recovery from March 6412 lows (+191.75 points, +2.99% intraweek) but ES still below 200-day MA at 6640, creating consolidation range at 6600-6640 resistance zone as market digests relief rally sustainability
Q1 2026 earnings season begins mid-April with 12% growth expectations and fresh upward revisions supporting forward PE 21-24x valuations, while Fed remains on hold at 3.50-3.75% through April 29 FOMC with zero cut probability
| ▼ Resistance Zone 2 | 6721 – 6771 |
| ▼ Resistance Zone 1 | 6615 – 6665 |
| ─ Pivot Area | ~6620 |
| ▲ Support Zone 1 | 6573 – 6623 |
| ▲ Support Zone 2 | 6475 – 6525 |
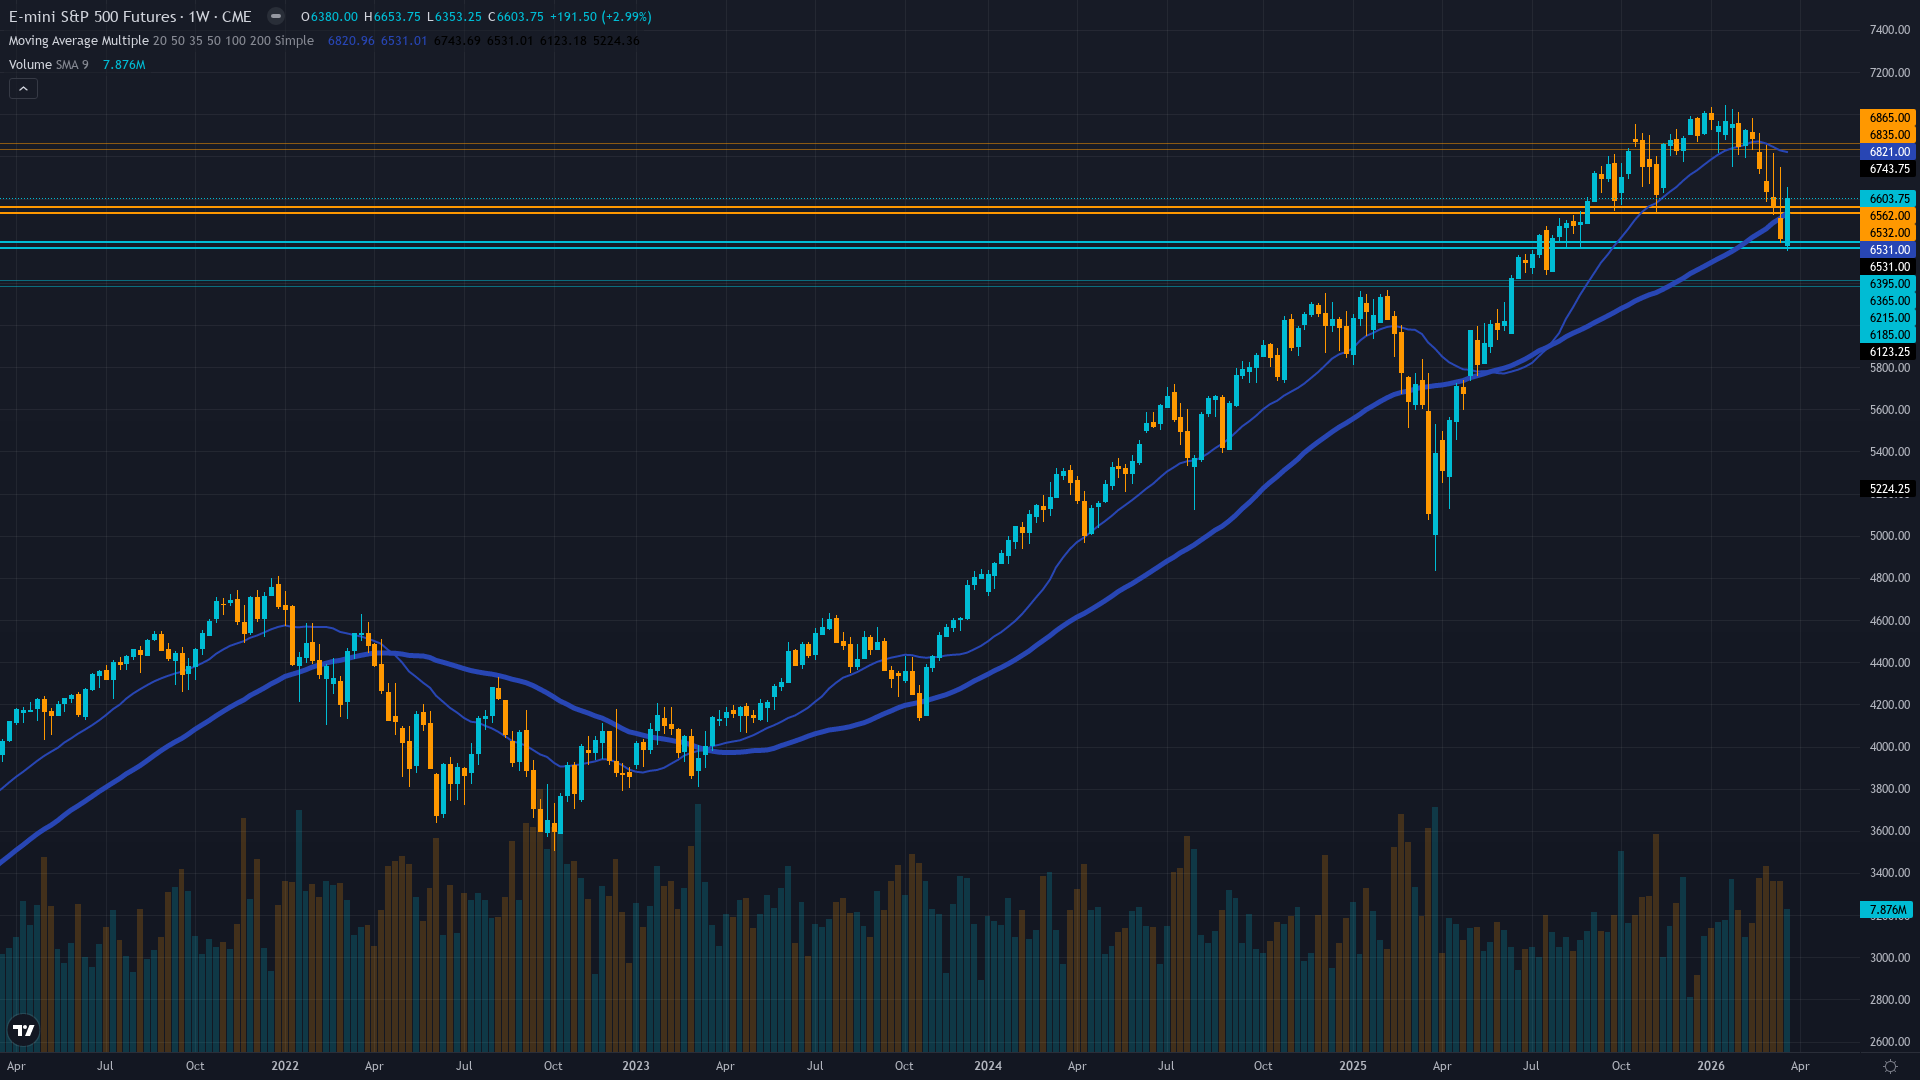
Recovering from breakdown but still below 200-day MA 6640 creating overhead resistance - RSI 57.9 neutral after deeply oversold 22.08 reading last week suggesting momentum stabilizing
Forward PE 21-24x moderately elevated but Q1 earnings estimates revised higher to 13.0% growth with record 13.9% net margins - execution risk in 2-3 weeks as earnings season validates valuations
Cautious after $5.7B ETF outflows on April 3 but relief rally suggests short covering - stale March 3 COT data limits positioning visibility as quarter opened with defensive flows reversing
VIX compressed sharply from 31.05 to 23.87 (down 23% from peak) showing fear subsiding rapidly, equity put/call 0.59 bullish bias confirms reversal momentum but still elevated versus January compression
Fed held 3.50-3.75% with 94.8% probability of April 29 hold, Atlanta Fed GDPNow Q1 at 1.6%, ISM Manufacturing 52.7 expansion, March NFP +178K stable labor - soft landing intact but no dovish catalyst
Fear premium unwinding - VIX spot 23.87 down sharply from 31.05 peak showing near-term fear compression accelerating as geopolitical catalyst resolved, term structure normalizing from inverted panic configuration
VIX spikes above 30 from geopolitical events typically compress 50% of peak-to-trough move within 10-14 days - current pattern at day 7 with 23% compression suggests additional 10-15% downside to 20-22 range likely before stabilization absent new fear catalyst
VIX compression from 31.05 to 23.87 over 7 days suggests continued normalization toward 20-22 range over next 5-7 trading days with 60% probability as relief rally extends, though March 11 CPI binary catalyst presents asymmetric re-expansion risk
High-to-normal transitioning volatility suggests 1.0-1.5% daily ES moves expected with current 6600-6640 consolidation representing 0.6% range - March 11 CPI catalyst presents asymmetric expansion risk with potential 2-3% intraday swings on inflation surprise
Contracting VIX from extreme 31.05 creates asymmetric setup - potential 4-5% downside to 6300-6400 zone if March CPI validates stagflation and VIX re-expands above 28 versus 5-7% upside to 6850-6900 if continued VIX compression below 20 and earnings season validates stretched multiples, but extreme March fear positioning and rapid 23% VIX compression favors mean reversion scenario over next 2 weeks
|
⚠️ Primary Risk
Relief rally reversal if March CPI surprises hot validating oil-driven inflation fears and forcing markets to reprice zero 2026 cuts assumption, triggering re-test of 6500-6400 support on renewed stagflation narrative Probability: MEDIUM
|
✦ Primary Opportunity
Sustained recovery toward 6746-6850 resistance reclaiming 200-day MA if VIX continues compression toward 20 and Q1 earnings season delivers on 13% growth expectations validating extreme March fear as washout low Timeframe: April 7-18 2026
|
ES trades at 6603.75 on April 5, 2026 at 07:30 UTC, consolidating after a violent relief rally that snapped a brutal 5-week losing streak. MACRO REGIME CLASSIFICATION: TRANSITIONAL. Markets are shifting from RISK-OFF (VIX above 25, extreme fear, breakdown) toward normalization but have not yet confirmed RISK-ON. VIX at 23.87 sits just below the 25 threshold after compressing from the March 29 peak of 31.05, sentiment remains in fear territory (Fear & Greed 19, AAII bears 51.4%), but price action shows recovery momentum with the S&P 500 gaining 3.4% for the holiday-shortened week ending April 2.
Post-input news scan reveals ES futures currently at 6603.75 opened the week at 6622.50, with CNBC reporting the index snapped its 5-week skid driven by easing Middle East tensions and oil price pullback from above $90. This marks a dramatic reversal from last week's BEARISH call at conviction 3 that delivered a MISS as price rallied +2.99% instead of declining - my first missed call after three consecutive CORRECT bearish weeks. The March extreme fear capitulation proved to be the washout low as discipline agents forecasted: Sentiment at +3.5 (extreme contrarian bullish), VIX spiking to 31.05, Fear & Greed at 19, AAII bears at 51.4% all signaled oversold exhaustion.
Current reading shows VIX compressed 23% from peak to 23.87, Fear & Greed marginally improved to 19 (still extreme fear), and AAII bears remain elevated at 51.4% versus bulls 33.6% - suggesting the sentiment extreme persists even as price recovers. The catalyst for reversal was geopolitical de-escalation with Iran conflict fears subsiding (S&P surged 2.9% on April 1 alone per Ad-Hoc News) and oil pulling back from the $90+ spike that drove March stagflation concerns. Technical structure shows ES recovered from the March 29 low of 6412 to current 6603.75 (+191.75 points) but faces critical resistance at 6640 (200-day MA per discipline data).
RSI recovered from deeply oversold 22.08 to neutral 57.9, yet the index remains below both 50-day and 200-day moving averages confirming the breakdown structure has not yet healed. Resistance immediate at 6640 represents the first major technical reclaim target. Fundamental dynamics provide support: Q1 2026 earnings estimates revised higher this week to 13.0% growth from 12.8%, with net profit margins at record 13.9% and forward EPS projections of $305-$309. Earnings season begins mid-April presenting the critical test - if companies deliver on 13% growth expectations, the forward PE 21-24x valuations (down from October's 30+ extreme) appear justified.
Miss on earnings and multiple compression threatens. Economic backdrop shows Fed on hold at 3.50-3.75% with 94.8% probability of hold at April 29 FOMC per CME FedWatch. March NFP delivered +178K jobs with unemployment steady at 4.3%, Atlanta Fed GDPNow projects Q1 GDP at 1.6%, ISM Manufacturing at 52.7 shows expansion - soft landing narrative intact but no dovish Fed catalyst emerging. The critical tension: is March 6412 the correction low enabling sustained recovery, or a temporary relief rally within a larger distribution pattern?
Arguments for recovery: extreme sentiment capitulation marked bottoms historically, geopolitical catalyst resolved, earnings growth trajectory intact, VIX compressing rapidly from 31.05 suggesting fear premium unwinding. Arguments for distribution: technical damage with breakdown below 200-day MA unrepaired, elevated starting valuations at forward PE 21-24x, Fed restrictive at 3.50-3.75% with zero cuts priced through April, and March CPI (next catalyst April 11) presents binary risk if oil-driven inflation validates stagflation concerns.
Applying ES parameters: I am at the 3-week Bias Review threshold after three consecutive BEARISH calls, requiring fresh re-justification. Last week's MISS breaks the CORRECT streak, starting a 1-miss count. Noise Floor 0.75%, probable weekly move in current consolidation 1.5-2.0% given VIX 23.87 regime exceeds noise threshold justifying directional view. My signal +0.5 marginally exceeds Min Signal 1.0 threshold - this represents a cautious lean recognizing the setup's ambiguity. Devil's advocate: the March extreme fear washout, VIX compression from 31.05, and 3.4% weekly rally represent classic capitulation reversal pattern with 70%+ historical resolution upward, making a continuation of bearish bias against this evidence statistically unfavorable despite unrepaired technical damage.
| Week | Bias | Confidence | Result |
|---|---|---|---|
| April 3, 2026 | BEARISH | 3/10 | ❌ |
| March 27, 2026 | BEARISH | 3/10 | ✅ |
| March 20, 2026 | BEARISH | 4/10 | ✅ |
| March 14, 2026 | BEARISH | 6/10 | ✅ |
| March 6, 2026 | NO CALL | 5/10 | ➖ |
| February 27, 2026 | NO CALL | 6/10 | ➖ |
| February 21, 2026 | NO CALL | 5/10 | ➖ |
| February 13, 2026 | NO CALL | 5/10 | ➖ |
| February 8, 2026 | BULLISH | 6/10 | ✅ |
| February 1, 2026 | NO CALL | 6/10 | ➖ |
| January 25, 2026 | BULLISH | 6/10 | ✅ |
| January 11, 2026 | BULLISH | 7/10 | ❌ |
📋 PROMPT-READY CONTEXT
Copy this entire block into any AI chat for follow-up analysis
▼ Expand
MACRO AGENT DESK — WEEKLY INTELLIGENCE BRIEFING
═════════════════════════════════════════════════
Asset: S&P 500 (ES)
Report Date: April 5, 2026

── DIRECTIONAL BIAS ─────────────────────────────
Call: NO CALL
Confidence: 5/10
Signal: NO DIRECTIONAL CALL THIS WEEK
MAD Index: 38 (SLIGHT DIVERGENCE)

── MARKET CONTEXT ───────────────────────────────
State: CONSOLIDATING
Regime: CONSOLIDATING
Sentiment: FEAR

── WHAT THE MARKET SEES ─────────────────────────
Divided between relief rally continuation toward 6746-6850 and consolidation/reversal risk given unrepaired technical breakdown and elevated valuations awaiting earnings validation

── WHAT THE MARKET IS MISSING ───────────────────
Market may be underestimating persistence of March extreme fear positioning creating sustained short-covering pressure toward 6746 resistance while overestimating consolidation sustainability given critical March CPI catalyst April 11 presents binary stagflation re-pricing risk

── KEY DRIVERS ──────────────────────────────────
1. Violent sentiment mean-reversion rally from March extreme fear levels - S&P 500 snapped 5-week losing streak with 3.4% weekly gain as VIX compressed from 31.05 to 23.87 and Iran conflict fears subsided
2. Technical recovery from March 6412 lows (+191.75 points, +2.99% intraweek) but ES still below 200-day MA at 6640, creating consolidation range at 6600-6640 resistance zone as market digests relief rally sustainability
3. Q1 2026 earnings season begins mid-April with 12% growth expectations and fresh upward revisions supporting forward PE 21-24x valuations, while Fed remains on hold at 3.50-3.75% through April 29 FOMC with zero cut probability

── KEY ZONES ────────────────────────────────────
Resistance 2: 6721 – 6771
Resistance 1: 6615 – 6665
Pivot: ~6620
Support 1: 6573 – 6623
Support 2: 6475 – 6525

── DISCIPLINE BIASES ────────────────────────────
Technical: BEARISH
Fundamental: BULLISH
Institutional: BEARISH
Options: BULLISH
Economic: NO CALL
Sentiment: BULLISH

── TECHNICAL STRUCTURE ──────────────────────────
Recovering from breakdown but still below 200-day MA 6640 creating overhead resistance - RSI 57.9 neutral after deeply oversold 22.08 reading last week suggesting momentum stabilizing

── FUNDAMENTAL ASSESSMENT ───────────────────────
Forward PE 21-24x moderately elevated but Q1 earnings estimates revised higher to 13.0% growth with record 13.9% net margins - execution risk in 2-3 weeks as earnings season validates valuations

── INSTITUTIONAL POSITIONING ────────────────────
Cautious after $5.7B ETF outflows on April 3 but relief rally suggests short covering - stale March 3 COT data limits positioning visibility as quarter opened with defensive flows reversing

── OPTIONS FLOW ─────────────────────────────────
VIX compressed sharply from 31.05 to 23.87 (down 23% from peak) showing fear subsiding rapidly, equity put/call 0.59 bullish bias confirms reversal momentum but still elevated versus January compression

── ECONOMIC BACKDROP ────────────────────────────
Fed held 3.50-3.75% with 94.8% probability of April 29 hold, Atlanta Fed GDPNow Q1 at 1.6%, ISM Manufacturing 52.7 expansion, March NFP +178K stable labor - soft landing intact but no dovish catalyst

── VOLATILITY REGIME ────────────────────────────
Regime: HIGH
Percentile: 68th
Trend: Contracting ▼
Days in Regime: 7
Term Structure: Fear premium unwinding - VIX spot 23.87 down sharply from 31.05 peak showing near-term fear compression accelerating as geopolitical catalyst resolved, term structure normalizing from inverted panic configuration
Historical Pattern: VIX spikes above 30 from geopolitical events typically compress 50% of peak-to-trough move within 10-14 days - current pattern at day 7 with 23% compression suggests additional 10-15% downside to 20-22 range likely before stabilization absent new fear catalyst
Outlook: VIX compression from 31.05 to 23.87 over 7 days suggests continued normalization toward 20-22 range over next 5-7 trading days with 60% probability as relief rally extends, though March 11 CPI binary catalyst presents asymmetric re-expansion risk
Trading Context: High-to-normal transitioning volatility suggests 1.0-1.5% daily ES moves expected with current 6600-6640 consolidation representing 0.6% range - March 11 CPI catalyst presents asymmetric expansion risk with potential 2-3% intraday swings on inflation surprise
Vol Risk/Opportunity: Contracting VIX from extreme 31.05 creates asymmetric setup - potential 4-5% downside to 6300-6400 zone if March CPI validates stagflation and VIX re-expands above 28 versus 5-7% upside to 6850-6900 if continued VIX compression below 20 and earnings season validates stretched multiples, but extreme March fear positioning and rapid 23% VIX compression favors mean reversion scenario over next 2 weeks

── PRIMARY RISK ─────────────────────────────────
Relief rally reversal if March CPI surprises hot validating oil-driven inflation fears and forcing markets to reprice zero 2026 cuts assumption, triggering re-test of 6500-6400 support on renewed stagflation narrative
Probability: MEDIUM

── PRIMARY OPPORTUNITY ──────────────────────────
Sustained recovery toward 6746-6850 resistance reclaiming 200-day MA if VIX continues compression toward 20 and Q1 earnings season delivers on 13% growth expectations validating extreme March fear as washout low
Timeframe: April 7-18 2026

── NEXT CATALYST ────────────────────────────────
Date: April 11, 2026
Event: March CPI inflation release critical for validating Fed policy trajectory and stagflation concerns amid recent oil price volatility from Iran conflict that drove crude above $90
Expected Impact: HIGH

═════════════════════════════════════════════════
Source: Macro Agent Desk (macroagentdesk.com)
═════════════════════════════════════════════════

── FULL ANALYSIS ────────────────────────────────
ES trades at 6603.75 on April 5, 2026 at 07:30 UTC, consolidating after a violent relief rally that snapped a brutal 5-week losing streak. MACRO REGIME CLASSIFICATION: TRANSITIONAL. Markets are shifting from RISK-OFF (VIX above 25, extreme fear, breakdown) toward normalization but have not yet confirmed RISK-ON. VIX at 23.87 sits just below the 25 threshold after compressing from the March 29 peak of 31.05, sentiment remains in fear territory (Fear & Greed 19, AAII bears 51.4%), but price action shows recovery momentum with the S&P 500 gaining 3.4% for the holiday-shortened week ending April 2. Post-input news scan reveals ES futures currently at 6603.75 opened the week at 6622.50, with CNBC reporting the index snapped its 5-week skid driven by easing Middle East tensions and oil price pullback from above $90. This marks a dramatic reversal from last week's BEARISH call at conviction 3 that delivered a MISS as price rallied +2.99% instead of declining - my first missed call after three consecutive CORRECT bearish weeks. The March extreme fear capitulation proved to be the washout low as discipline agents forecasted: Sentiment at +3.5 (extreme contrarian bullish), VIX spiking to 31.05, Fear & Greed at 19, AAII bears at 51.4% all signaled oversold exhaustion. Current reading shows VIX compressed 23% from peak to 23.87, Fear & Greed marginally improved to 19 (still extreme fear), and AAII bears remain elevated at 51.4% versus bulls 33.6% - suggesting the sentiment extreme persists even as price recovers. The catalyst for reversal was geopolitical de-escalation with Iran conflict fears subsiding (S&P surged 2.9% on April 1 alone per Ad-Hoc News) and oil pulling back from the $90+ spike that drove March stagflation concerns. Technical structure shows ES recovered from the March 29 low of 6412 to current 6603.75 (+191.75 points) but faces critical resistance at 6640 (200-day MA per discipline data). RSI recovered from deeply oversold 22.08 to neutral 57.9, yet the index remains below both 50-day and 200-day moving averages confirming the breakdown structure has not yet healed. Resistance immediate at 6640 represents the first major technical reclaim target. Fundamental dynamics provide support: Q1 2026 earnings estimates revised higher this week to 13.0% growth from 12.8%, with net profit margins at record 13.9% and forward EPS projections of $305-$309. Earnings season begins mid-April presenting the critical test - if companies deliver on 13% growth expectations, the forward PE 21-24x valuations (down from October's 30+ extreme) appear justified. Miss on earnings and multiple compression threatens. Economic backdrop shows Fed on hold at 3.50-3.75% with 94.8% probability of hold at April 29 FOMC per CME FedWatch. March NFP delivered +178K jobs with unemployment steady at 4.3%, Atlanta Fed GDPNow projects Q1 GDP at 1.6%, ISM Manufacturing at 52.7 shows expansion - soft landing narrative intact but no dovish Fed catalyst emerging. The critical tension: is March 6412 the correction low enabling sustained recovery, or a temporary relief rally within a larger distribution pattern? Arguments for recovery: extreme sentiment capitulation marked bottoms historically, geopolitical catalyst resolved, earnings growth trajectory intact, VIX compressing rapidly from 31.05 suggesting fear premium unwinding. Arguments for distribution: technical damage with breakdown below 200-day MA unrepaired, elevated starting valuations at forward PE 21-24x, Fed restrictive at 3.50-3.75% with zero cuts priced through April, and March CPI (next catalyst April 11) presents binary risk if oil-driven inflation validates stagflation concerns. Applying ES parameters: I am at the 3-week Bias Review threshold after three consecutive BEARISH calls, requiring fresh re-justification. Last week's MISS breaks the CORRECT streak, starting a 1-miss count. Noise Floor 0.75%, probable weekly move in current consolidation 1.5-2.0% given VIX 23.87 regime exceeds noise threshold justifying directional view. My signal +0.5 marginally exceeds Min Signal 1.0 threshold - this represents a cautious lean recognizing the setup's ambiguity. Devil's advocate: the March extreme fear washout, VIX compression from 31.05, and 3.4% weekly rally represent classic capitulation reversal pattern with 70%+ historical resolution upward, making a continuation of bearish bias against this evidence statistically unfavorable despite unrepaired technical damage.


